






Square
Following
Hot
News
Profile
Share your thoughts
placeholder
Article
#BTC跌破8.2万 #ShareWeekly #BitcoinTops$82K
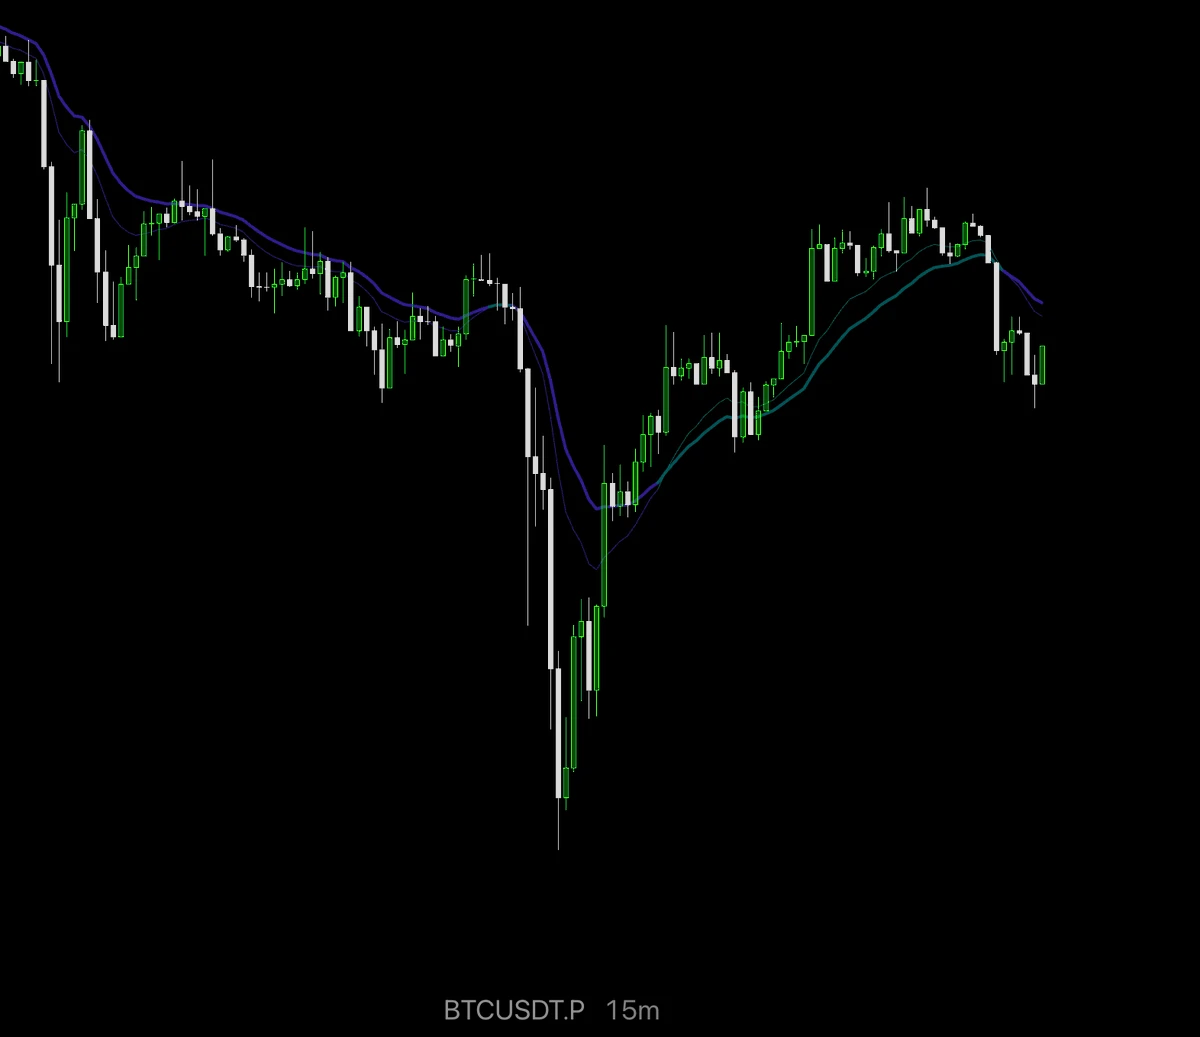
BITCOIN AT $81,621.6: CPI SHOCK, CRITICAL SUPPORT, AND THE ROAD AHEAD
Bitcoin is navigating a critical phase after slipping below the $82,000 level. With BTC currently trading at $81,621.6, the market is balancing renewed inflation concerns, changing Federal Reserve expectations, and uncertainty surrounding leveraged positions. The key question is whether buyers can stabilize the market or whether Bitcoin will face another test near $80,000.
1. Current BTC Market Snapshot
- Current price: $81,621.6
- 24-hour high: $81,880.7
- 24-hour low: $81,196.4
- 2
BTC-0.87%
$BTW dropped about 40% from its peak, then jumped back 60%. This isn’t normal demand.
The easy story is “Bitway is hot.”
The harder fact is supply. Only about 1.5 billion of BTW’s 10 billion tokens are trading. That’s roughly 15%.
On top of that, reward programs push holders to lock their tokens up. Fewer tokens are left for sale, so a small amount of buying moves the price a lot.
And plenty of traders were betting against the rally, some publicly. When the price rises, those bets lose money and the losers are forced to buy. That pushes it higher again.
No single piece of news explains this m
BTW+30.86%
BTW+30.48%
  • 1
Trenches
AGT
A
bade
b
AGT
0x5d...e274
Market Cap
$.
Change
.
24h Vol
$.
Holders
.
CNPY
C
bade
b
CNPY
0xc6...ddd2
Market Cap
$.
Change
.
24h Vol
$.
Holders
.
FOLIO
F
bade
b
FOLIO
0x5f...e411
Market Cap
$.
Change
.
24h Vol
$.
Holders
.
Q
Q
bade
b
Q
0xc0...0589
Market Cap
$.
Change
.
24h Vol
$.
Holders
.
Gato
G
bade
b
Gato
55A3...pump
Market Cap
$.
Change
.
24h Vol
$.
Holders
.
$ZEC Moving toward $1,300 — bulls are fighting back‼️
Zcash is currently trading near $1,158 after bouncing from the key $1,140 support zone. Buyers are showing signs of recovery! If $ZEC holds above $1,138 and breaks through $1,200, the next upside targets could be $1,240 and $1,285–$1,300. However, losing $1,138 could trigger another drop toward $1,090. Potential long setup: Entry: $1,140–$1,160; Targets: $1,200 / $1,240 / $1,285 / $1,300; Stop-loss: $1,090👀 $ZEC Can it reclaim $1,300, or will sellers take control again? Stay patient, manage risk, and follow the next move with me!
post-image
ZEC-1.72%
The day I lost 80k U, I deleted my trading app. $ALT bounced from 0.0082 to 0.0094 this time, but I just couldn't bring myself to chase it. But the data doesn't lie: 24h trading volume is 31.2M, turnover has clearly picked up, and retail traders couldn't have driven a 14.32% gain on their own. Net inflows to ALT staking contracts on-chain have risen 23% over the past 7 days, and with TVL in the L2 sector recovering, it's one of the most direct beneficiaries. Technically, 0.0082 is the confirmed bottom after the second retest this cycle, while 0.0098 is resistance at the previous high. My plan
ALT+12.70%
While most retail investors are focusing exclusively on the upcoming Consumer Price Index (CPI), sophisticated capital is betting on today’s PPI.
These two indices are closely linked, but producer inflation provides the first and most important hint of what will happen in the U.S. economy in the near future. Historical data shows that a soft, low PPI often acts as a catalyst for the start of a local altcoin season. When pressure on the industrial sector eases, capital markets price in positive expectations for the month ahead.
If PPI comes in in the “green zone” (that is, below forecasts), we
BTC-0.87%
$TIA suffered a major setback, but some interesting moves are emerging around $0.65. Sellers pushed the price sharply lower, but buyers are starting to defend this support level.
I plan to go long $TIA here, expecting the price to rebound to around $0.713. The recent bounce looks promising, but I’d like to see buyers hold above $0.664 before momentum picks up. Entry: $0.664–$0.668 Target: $0.680 / $0.700 / $0.713 Stop-loss: $0.6416
After a major sell-off, this is still a high-risk bounce trade. If $0.6478 gives way, the bullish setup will weaken significantly. Can $TIA reclaim $0.71, or wil
post-image
TIA-3.20%
Layout: Bitcoin, Ethereum, Dogecoin
live-cover
LIVE880
  • 4
Bitcoin Support and Resistance Levels
live-cover
LIVE85
The Fear and Greed Index remains in the greed zone at 55, but $PUMP is currently at 0.004315, below the Bollinger lower band at 0.00432588, down 7.86% in 24h, with a trading volume of 14.8M USDT; MA5=0.0044206 is below MA20=0.00452215, RSI=36.6 is nearing oversold territory, and the MACD histogram at -2.051e-05 remains bearish. While broader market sentiment has not turned cold, this token is weakening independently. The decline reflects capital outflows amid sector rotation. The funding rate of +0.0015% shows that longs are still paying to hold their positions. A short-term rebound is due, bu
post-image
GTC
GTC芝麻币
Gate.Fun
MC:$0.1Holders:1
0%
ALT+12.70%
Big Tech earnings week is colliding with a wave of defense orders, and the market has to bankroll two money-burning machines at once: AI compute and global rearmament. Margins are bound to get squeezed. After all these years, I still think position sizing matters more than calling the direction. Anyone heavily positioned this week has to be feeling uneasy. Maybe I’m wrong—just waiting to get proven wrong.
#Macro
post-image
$BTW Facing strong selling pressure, hurry to open a short position now! 📉🔥
🎯 Take profit: 2.250
post-image
BTW+30.48%
Why is $BTW trading at a $25 billion FDV, and few people are talking about it?
post-image
BTW+30.86%
$NEAR Can Buyers Defend $4.30?
NEAR is facing a key technical test. The weekly TD Sequential sell signal puts $4.30 support in focus, with $3.76 as a potential downside level if buyers fail to defend it.
However, a bearish signal alone doesn't confirm a breakdown.
A weekly close below $4.30 would increase downside risk, while a strong recovery and resistance reclaim could keep the bullish scenario alive.
The key level is clear. Now the market needs to confirm the direction.
Will NEAR hold support, or are sellers preparing another leg down?
#NEAR #NEARProtocol #CryptoAnalysis
post-image
NEAR-3.12%
Bitcoin Tests $81,000 as Rate Hike Fears Linger After Hot Inflation Data
Bitcoin dipped below $81,000 on Thursday, extending its slide a day after U.S. consumer prices rose faster than expected and revived bets on another Federal Reserve rate hike.
The leading cryptocurrency is currently trading at $81,002, per CoinGecko data, down 2.7% over the past 24 hours and 2.5% over the past week, after slipping to an intraday low of $80,444.
⚠️ Personal market analysis only. NFA — manage risk and DYOR.
Educational content, not investment advice or a recommendation to buy, sell, deposit, or withdraw any
post-image
BTC-0.87%
Odds of an October rate hike dropped to a new monthly low of 14%
#USSeptemberPPIBeatsExpectations
post-image
  • 3
$APR Down 16% in a day, plunging straight from 0.0478 to 0.0380. It’s now at 0.0399, with 13.7M in trading volume—this isn’t a pullback; someone’s moving out overnight. Here’s the dilemma: is this a golden opportunity or catching a falling knife?
The bullish case: First, the 24-hour low of 0.0380 has been tested twice without breaking, showing signs of short-term support; second, 13.7M in trading volume means liquidity is still there—it’s not a stagnant pool, so you can get in or out; third, after dropping 20% from 0.0478 to 0.0380, most of the short-term panic has likely played out, making a
APR-15.86%
MSCI’s new rules may squeeze Strategy’s Bitcoin buying machine
MSCI is moving to exclude non-operating companies from its Global Investable Market Indexes, and the final list of affected constituents will be announced on Nov. 11. The new rules take effect after the Nov. 30 market close.
The change puts Michael Saylor's Bitcoin treasury company, Strategy (MSTR), at risk of losing access to billions of dollars in index-linked investment. MSTR shares are trading roughly 69% below their peak.
⚠️ Personal market analysis only. NFA — manage risk and DYOR.
Educational content, not investment advice o
post-image
MSCI-1.02%
MSTR-9.52%
BTC-0.87%
You all say the Apple iPhone Duo will be hard to get? No need—you can just buy it directly 😂 You just have to wait until next year for it to ship 😫
post-image
These 5 altcoins are plunging hard, guys. These coins aren't looking good $ZEREBR Down 22.12%
$AP Down 15.50%
$PARTI Down 12.52 %N XPC down 11.93 %O PN down 11.41% Some people are losing money, while others are waiting to buy at lower prices. What do you think? Will the plunge continue, or is a strong rebound imminent?
post-image
PARTI-14.18%
The most unusual detail in today's market is $FIL : the price is down nearly 4% intraday, yet the funding rate is -0.0121%, meaning shorts are paying to hold their positions, while the Fear and Greed Index remains at 55, in the greed zone. This clear divergence between price, sentiment, and holding costs suggests this downswing looks more like a short-term squeeze than a trend-driven sell-off.
Technically, $FIL is currently at 1.0906, above the MA5 (1.08098) but still capped by the MA20 (1.12724), with the moving averages in a bearish alignment. The MACD histogram at -0.005785 is bearish, but
post-image
FIL-6.28%
BCH-0.55%
TRX-0.35%
Load More

Join 40 M users in our growing community

⚡️ Join 40 M users in the crypto craze discussion

💬 Engage with your favorite top creators

👍 See what interests you

Trending Topics

USSeptemberPPIBeatsExpectations

91.35k Views1.93k Discussing

US September PPI came in at 6.3% YoY, well above the 5.3% market expectation, pointing to renewed producer-side inflation pressure. Weekly jobless claims were 199K, broadly in line with forecasts. Could hotter inflation further reduce room for rate cuts, and what does it mean for $BTC, US stocks, and gold?

GateWCTCS9GlobalTradingCompetition

37.87k Views6.67k Discussing

GateBTCAndETHFuturesVolumeRanksTop3

53.8k Views1.81k Discussing

View More