Square
Following
Hot
News
Profile
Share your thoughts
placeholder
Article
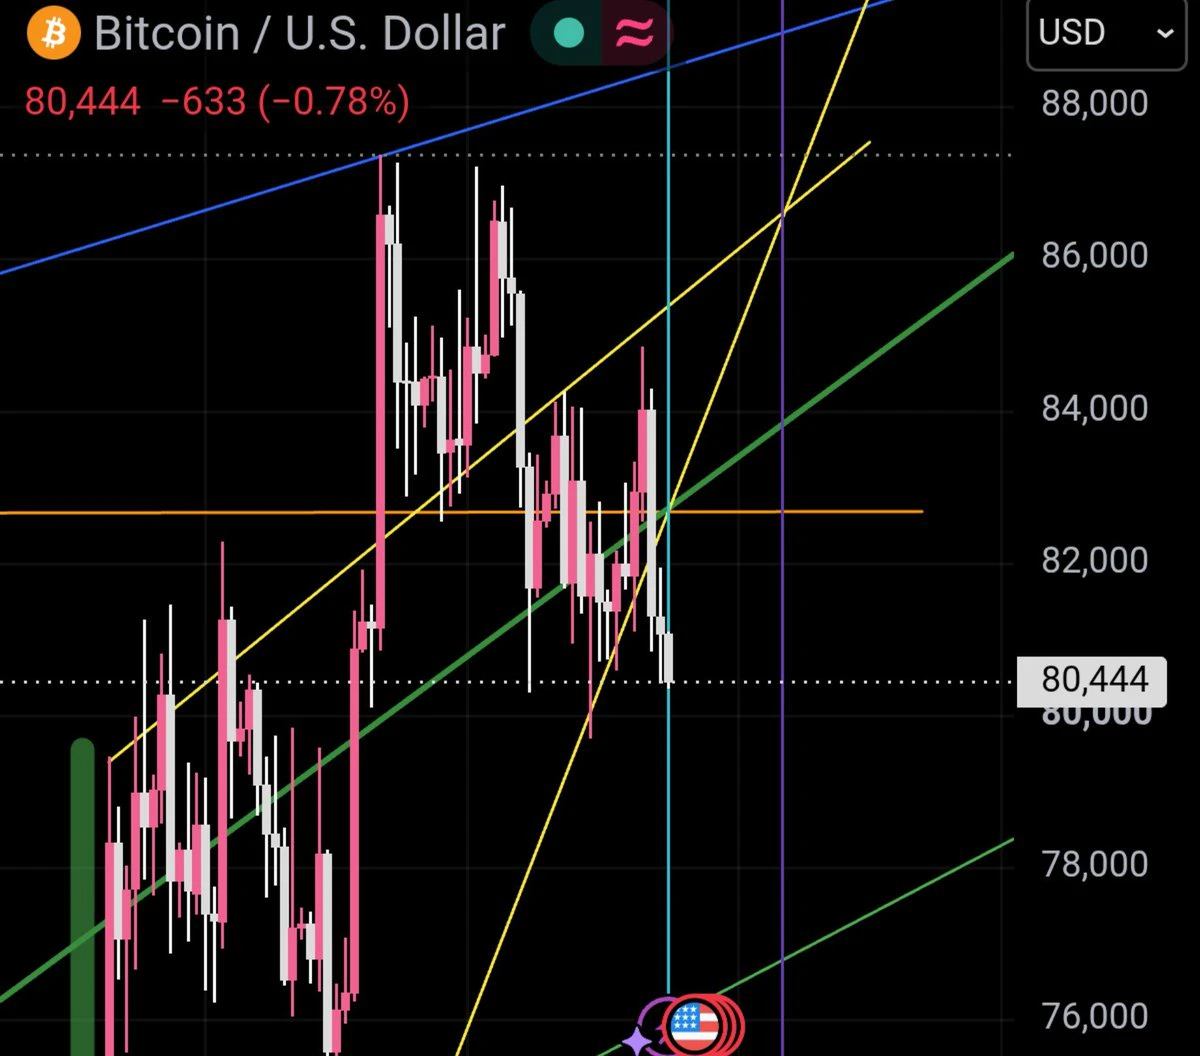
#btc Massive weekly close and looking strong. Ideally a quick sweep down to build a larger weekly down wick, then up to new highs. If we close above blue supply and OTE from here we likely straight go for $90k+
post-image
BTC+0.52%
$DOGE Pulls Back From Local High Short Setup, Momentum Still Intact
Pair: $DOGE /USDT
Direction: SHORT
Entry Zone: 0.08649
Take Profit:
- TP1: 0.08558 +1.1%
- TP2: 0.08497 +1.8%
- TP3: 0.08406 +2.8%
Stop Loss: 0.08771
Chart Structure:
- DOGE had been basing in a tight range for over a day, then pushed up sharply through MA7/MA25 to a local high near 0.0885, and has since pulled back with a couple of red candles to entry, right at the MA7/MA25 cluster
- MA99 (purple) remains well above, still declining from much higher not a near-term factor either way
- RSI(14) spiked to the mid-60s on t
DOGE+1.96%
🏆 Finally conquers Singapore, Max unlocks a new career achievement
Starting from pole and leading from start to finish, Max Verstappen delivered a spectacular Pole to Win at the F1 Singapore Grand Prix, claiming his first Singapore GP victory 🏎️
Gate founder Dr. Han was also on-site with the Red Bull team, celebrating this historic moment with Max. Isack Hadjar’s performance also deserves applause.
From the TOKEN2049 driver meet-and-greet to winning the F1 Singapore GP, Gate, as Red Bull Racing’s official sponsor and long-term partner, has been along for the journey, witnessing speed and bre
GateSquare
🏆 Finally conquers Singapore, Max unlocks a new career achievement
Starting from pole and leading from start to finish, Max Verstappen delivered a spectacular Pole to Win at the F1 Singapore Grand Prix, claiming his first Singapore GP victory 🏎️
Gate founder Dr. Han was also on-site with the Red Bull team, celebrating this historic moment with Max. Isack Hadjar’s performance also deserves applause.
From the TOKEN2049 driver meet-and-greet to winning the F1 Singapore GP, Gate, as Red Bull Racing’s official sponsor and long-term partner, has been along for the journey, witnessing speed and breakthroughs together.
💙 First victory secured, the legend continues.
Bring #Max首夺F1新加坡站冠军 to Gate Square to chat:
Which moment from the race left the deepest impression on you?
repost-content-media
SOL+1.92%
BTC+0.52%
hyperliquid:native $125+ before EOY
post-image
HYPE+2.44%
**$ETH /USDT Perp – "Pullback in Uptrend – Watch Long"**
Trading Plan Long $ETH
Entry: 2,551.69
SL: 2,531.13
TP1: 2,578.45
TP2: 2,583.18
ETH is up +2.07% and pulling back to the 2,551.69 level after the 2,578.45 high. MACD is cooling. Buying the current dip targets the 2,578.45 high.
#ShareWeekly
post-image
ETH+2.16%
Everyone calling $XAG /USDT a range is about to get proven wrong.

$XAG /USDT - SHORT

Trade Plan:
Entry: 60.58 – 60.68
SL: 61.08
TP1: 60.29
TP2: 60.07
TP3: 59.73

Why this setup?
Why now? The 4h setup shows a SHORT bias with the 1h price locked at 60.63, the 15m RSI sitting at 34.59 and the 1h ATR at 0.187812, which together signal a sharp move is overdue. The entry zone between 60.58 and 60.68 aligns perfectly with the entry reference, giving a precise trigger for the first target at 60.29 and the second target at 60.07. The daily range trend offers no strong directional anchor, so this t
XAG-0.08%
$BTC THE ROAD TO $100K? KEY RETEST ZONE TO WATCH
#BTC has broken above the $67,000 resistance, and I’m now waiting for a potential retest / re-entry near this level.
▶️ $82,800: Immediate structural support
▶️ $67,000: Major breakout retest zone
▶️ $59,809: Key downside reference
▶️ $100,000: Major upside target
If BTC revisits $67,000 and buyers defend this level, it could establish a Higher Low (HL) before the next bullish expansion toward $100K.
This is my preferred scenario, but the retest is not guaranteed. I’ll be watching price action for confirmation before considering re-entry.
NFA |
post-image
BTC+0.52%
  • 1
#KoreanStocksPlungeWillYouBuyTheDip
SKHYNIX: $1,227 Don’t Confuse a Weak Rebound With a Trend Reversal
When a market is falling, the hardest decision is knowing whether to sell the rebound or wait for a genuine recovery. At $1,227, SKHYNIX is at a level where patience matters more than prediction. Buying simply because the price has dropped can be dangerous when sellers are still controlling the market.
1. Technical Structure: The Pressure Is Still Downward
According to the chart levels provided, SKHYNIX fell from $1,386 to $1,186 before entering a weak consolidation phase. The price is now s
SK Hynix-4.52%
BTC+0.52%
ETH+2.14%
  • 2
Many people see a 70% gain in 24 hours and their first reaction is, “If I chase it, it can still rise,” while their second reaction is, “After rising this much, it’s definitely due for a pullback, so I’ll short it first.” These two intuitions are essentially the same mistake: using the size of the gain instead of the trend structure to make a judgment. A large rise does not mean the price is expensive, and a large drop does not mean it is cheap. Price levels only become meaningful when placed within a moving-average framework.
Take $W as an example. The current price is 0.03044, and MA5=0.029
post-image
STRK-3.27%
#阿斯麦与台积电即将发布Q3财报 The real stress test for the AI trade is just beginning: two earnings reports in 48 hours
The AI trade is still moving higher, but a tough round of validation is coming this week. Last week, all three major U.S. stock indexes closed higher. A rebound in technology stocks helped the market withstand upward pressure from oil prices and Treasury yields, while the Nasdaq Composite rose for a fourth consecutive week. As the new week began, S&P 500, Nasdaq 100, and Dow futures were broadly little changed, with investors clearly waiting for new catalysts. One of the most important se
ASML+0.62%
TSM-1.03%
NVDA-0.52%
SPX500+0.17%
NAS1000.00%
Michael Saylor sends another signal of increased BTC holdings! Strategy may continue its buying spre
live-cover
LIVE2,270
$FIL Long
Entry 1.24 Take-profit 1.28 Take-profit 1.33 Stop-loss 1.20 FIL could rebound from here. I want to see it regain strength and turn this level into a genuine uptrend.
post-image
FIL+12.38%
$SUN SUNUSDT — Major Accumulation or Bearish Continuation?
The price is moving within a descending channel on the 1-hour timeframe; it has reached the lower boundary and appears poised for a rebound, suggesting a potential upward move upon retesting this level.
The Relative Strength Index (RSI) indicates a bearish trend, but an upward breakout is likely due to oversold conditions on the 1-hour chart.
An orange trend line supports the potential upward rebound.
There is initial support at 0.01644, acting as a primary support zone.
A key support zone (marked in green) exists at 0.01616; the price
post-image
SUN+0.20%
🔥🚨 HOT TRADER LIVE | BTC BREAKOUT OR DUMP? 🐂🐻 | BIG MOVE ALERT ⚡📈
live-cover
LIVE1,451
There’s no need to deny $RSR ’s strength, but treating overheating as safety often means sentiment is at its most expensive.
This time, I’m not looking at the gainers and losers list, only the price levels. The current price is 0.002323, about 31.94% above the 1-hour support at 0.001581 and about 29.10% below the resistance at 0.002999.
My criteria are simple: only a breakout above 0.002999 followed by continuation would count as an upside handoff; a drop below 0.001581 invalidates the original view. The 1-hour and 4-hour trends are both strong, with RSI at 72 and 92, respectively.
The debate
post-image
RSR+46.67%
🧧 South Korean stocks plunge—will you buy the dip? The Gate Square “Weekly Share” special edition is here!
Post with the hashtags to claim red packets; new users have a 100% chance of winning, with weekly leaderboard rewards of up to 100 USDT!
📌 How to participate
1️⃣ Register for the event 👉 https://www.gate.com/campaigns/6244
2️⃣ Share your views with #每周来晒 and #韩股大跌你会抄底吗
💬 This edition’s hot topic
South Korean stocks have fallen sharply, led by Samsung Electronics and SK hynix. Is this a short-term correction or a chance to buy the dip?
💡 Share your views
1️⃣ What will happen to Sout
GateSquare
🧧 South Korean stocks plunge—will you buy the dip? The Gate Square “Weekly Share” special edition is here!
Post with the hashtags to claim red packets; new users have a 100% chance of winning, with weekly leaderboard rewards of up to 100 USDT!
📌 How to participate
1️⃣ Register for the event 👉 https://www.gate.com/campaigns/6244
2️⃣ Share your views with #每周来晒 and #韩股大跌你会抄底吗
💬 This edition’s hot topic
South Korean stocks have fallen sharply, led by Samsung Electronics and SK hynix. Is this a short-term correction or a chance to buy the dip?
💡 Share your views
1️⃣ What will happen to South Korean stocks next? Will you buy the dip or stay on the sidelines?
2️⃣ Will you buy the dip or stay on the sidelines?
🎁 Limited red packets available—share your views on a first-come, first-served basis!
Share now: https://www.gate.com/post/topic/KoreanStocksPlungeWillYouBuyTheDip?topic_id=205811
repost-content-media
ETH/USDT Technical Analysis and Monday Outlook
Current Price: $2,552.75
24h Range: $2,496.52 to $2,578.45
Weekly Chart Analysis
The weekly timeframe shows the price has recovered from the lower Bollinger Band at $1,355. The asset is currently trading above the middle Bollinger Band, which sits at $2,139. The upper band is located at $2,923, marking a long-term resistance level. The MACD indicator remains in negative territory, but the downward momentum is decreasing.
Daily Chart Analysis
On the daily chart, the price is trading below the middle Bollinger Band at $2,640. The recent local high w
KatyPaty
Tom Lee: Ethereum may break $5,000 by the end of the year, and this cycle is expected to hit $50,000.
Tom Lee said in an interview that Ethereum could rise to $25,000–$50,000 in this cycle and may exceed $5,000 by the end of the year. According to him, ETH has been trading in the same range for five years, and prolonged accumulation could form the basis for a major breakout. If Bitcoin rises above $100,000, ETH could reach approximately $7,500.
It is important to understand: this is a forecast, not a guarantee. Traders, according to the prediction market, estimate the probability of reaching $5,000 by the end of 2026 at just 4%.
Weekly chart (1W): price below the Bollinger middle band
On the weekly timeframe, ETH is trading around $2,501. The Bollinger middle band (MB) is at $2,110, the upper band (UB): $2,869, and the lower band (LB): $1,351.
The price is holding above the middle band, preserving the global uptrend, but it is still far from the upper channel boundary. MACD on the weekly chart: the histogram is positive (100.69), while the DIF and DEA lines are near the zero mark, indicating weak but not negative momentum. Weekly OBV is declining, indicating a lack of significant inflows on this timeframe.
Daily chart (1D): attempt to hold above support
The daily timeframe provides a more precise picture. The price of $2,501 is below the Bollinger middle band ($2,648), which technically indicates weakness. The upper band: $2,818, and the lower band: $2,478.
MACD on the daily chart: the histogram is negative (-35.59), but the DIF and DEA lines are converging—the downward momentum is slowing. Daily OBV is also declining, indicating that selling is prevailing. The nearest support is the lower Bollinger band at $2,478; resistance is the middle band at $2,648.
4-hour chart (4H): consolidation near the lower band
On the 4-hour timeframe, the price of $2,501 is slightly above the Bollinger middle band ($2,496). The bands are: UB — $2,548, LB — $2,444.
MACD on the 4H chart is only beginning to form: the histogram is slightly positive (8.02), while DIF (-27.02) and DEA (-35.05) remain in negative territory. This indicates a possible reversal, but there is no confirmation yet. 24-hour volume is 506.13K ETH, which is below average. OBV on the 4H chart is declining, confirming the absence of aggressive buying.
Conclusion
The technical picture on the ETH charts looks neutral and cautious. The price is trapped between support at $2,444–$2,478 and resistance at $2,548–$2,648. For Tom Lee’s scenario to materialize, the upper boundary of the daily Bollinger channel ($2,818) must be broken with rising volumes. For now, the market is in a consolidation phase, and the forecast remains just a forecast and nothing more.
#EthereumUpOver71%inQ3
$ETH ‌
repost-content-media
ETH+2.14%
  • 7
  • 1
$BTC 3W composite
1. Failed auction below VAL
2. Acceptance back inside value
3. Retest of the POC
Reclaim and hold above POC = retest higher in play.
Rejected = back to VAL.
post-image
BTC+0.52%
On Solana, the DFDVx token trades +3.35% above the $DFDV share it tracks. Buyers of the wrapper are paying that much extra over the stock price to hold the same company on chain.
DFDVX-4.46%
SOL+1.92%
Pengu has found support, as if fish were free, so it’s time for an ice-slide rebound! Bullish on $PENGU . Trading levels: Entry 0.008121 - 0.008162 Take profit 1 0.008535 Take profit 2 0.008850 Stop loss 0.007877 Note: If the support level cannot hold, the price may plunge toward the 24-hour low. Don’t go all in, brothers. Position size should suit your account. The bulls are awake. 👇👇👇 Today, keep an eye on these assets: and $NEAR .
post-image
SPCXB
SPCXBSpaceX
Four.meme
MC:$4.44KHolders:2
0%
PENGU-0.58%
NEAR+10.61%
Load More

Join 40 M users in our growing community

⚡️ Join 40 M users in the crypto craze discussion

💬 Engage with your favorite top creators

👍 See what interests you

Trending Topics

GateWCTCS9GlobalTradingCompetition

35.02k Views5.3k Discussing

Gate WCTC S9 Global Trading Competition is officially live, crossing asset boundaries across crypto, stocks, and CFDs with an 8M USDT total prize pool. The Lucky Launchpad guarantees a win every time, new users get a 20 USDT futures voucher upon registration, and the Event Contract PK tournament features a prize pool of up to 400,000 USDT.[👉 Read announcement](https://www.gate.com/announcements/article/102133)

GateXRedBullWinsSingaporeGP

172.94k Views6.43k Discussing

WillYouBuyDipInKoreanStocks

61.39k Views1.77k Discussing

View More