




Square
Following
Hot
News
Notifications
Profile
Share your thoughts
placeholder
Article
Today @nindibabi reminded me, and I only then remembered that a few years ago in Shanghai, I ate at this place with him. I even sat in Jensen Huang’s seat 🤣
post-image
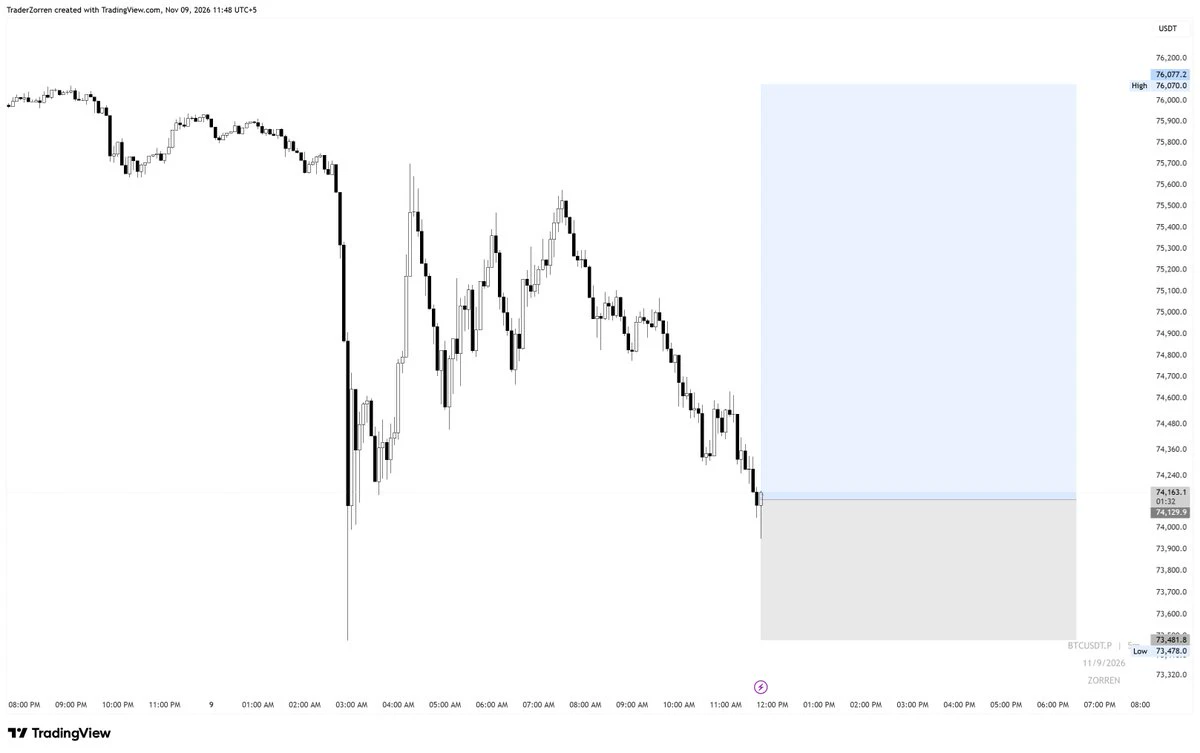
$BTC BTC fell below the lower Bollinger Band, leaving the 74,600 long just $150 from its 74,300 stop loss
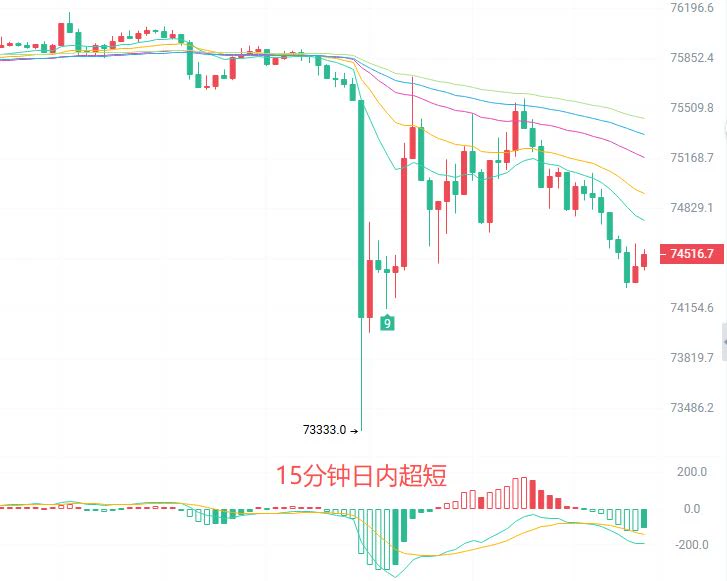
The 2-hour chart looks ugly: price has already fallen below the lower Bollinger Band at 74,462, the first time since late October. It’s accelerating downward along the lower band. All the moving averages are overhead, forming a thick bearish wall. The MACD green bars are expanding below the zero line and opening downward; the bears haven’t let up at all. The TD buy count just printed its first bar, and a single bar doesn’t tell us anything
The 15-minute chart is clearer: it closed at 74,44
post-image
BTC-0.65%
Trenches
ZIG
Z
bade
b
ZIG
0x8c...1145
Market Cap
$.
Change
.
24h Vol
$.
Holders
.
牛逼
牛
bade
b
牛逼
0x96...7777
Market Cap
$.
Change
.
24h Vol
$.
Holders
.
BTC
B
bade
b
BTC
C5xp...pump
Market Cap
$.
Change
.
24h Vol
$.
Holders
.
STONK
S
bade
b
STONK
6GmA...UNgx
Market Cap
$.
Change
.
24h Vol
$.
Holders
.
ANSEM
A
bade
b
ANSEM
9cRC...pump
Market Cap
$.
Change
.
24h Vol
$.
Holders
.
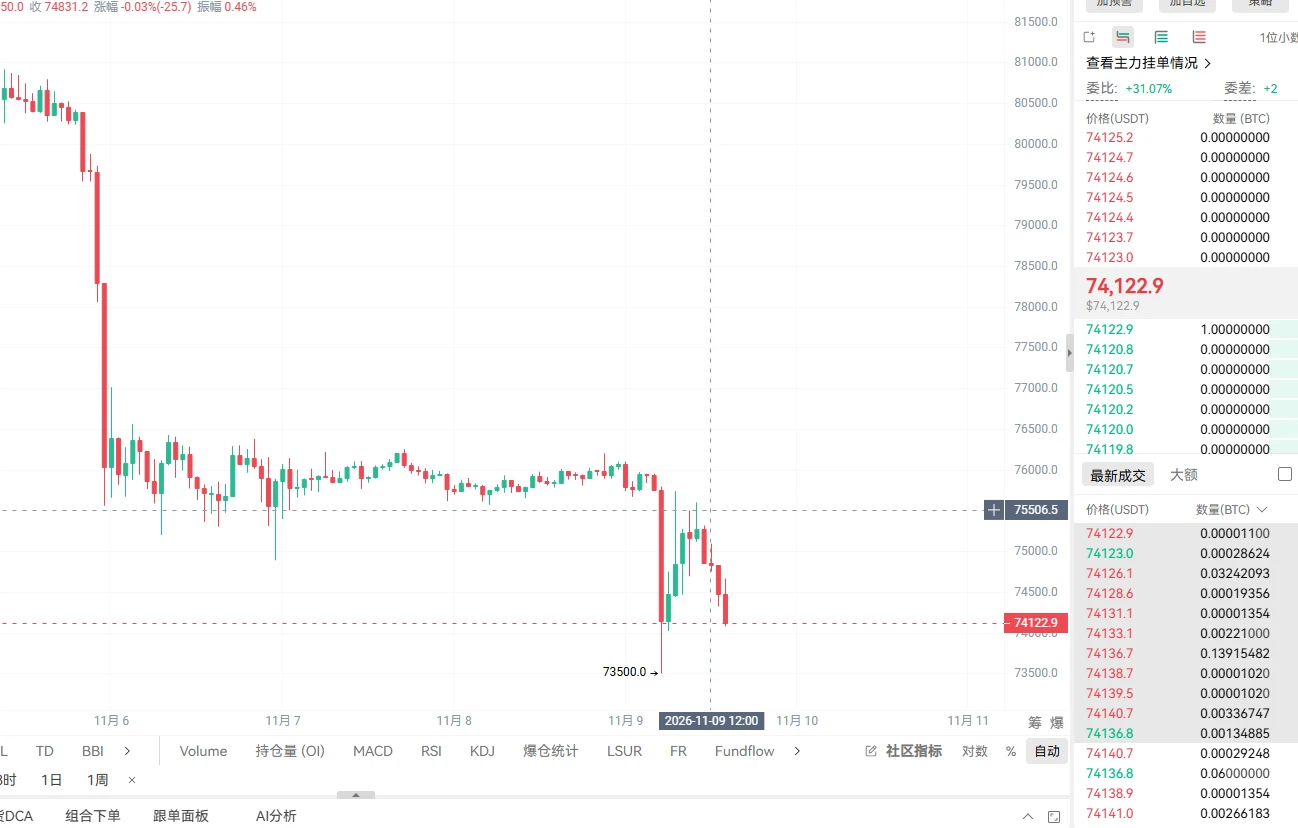
Bitcoin is at 74,100 now, after hitting a low of 73,980 this afternoon—just shy of breaking below 74,000.
It’s been falling for five straight weeks, with not a single bullish weekly candle. The Nasdaq fell 3.4% last week, led lower by AI chip stocks, and Bitcoin followed U.S. stocks. Until U.S. stocks stop falling, Bitcoin won’t stop either.
Bad news has also been piling up this weekend. Binance was hacked, Democrats won the midterm elections, Huang’s affair made headlines, and interest rates are set to rise again next month. Right now, money just wants to flow out, and nobody’s willing to buy
post-image
BTC-0.67%
NAS100-0.13%
Morning Market Updates
live-cover
LIVE4,782
Over the past few years as a key account manager, I’ve found that clients mainly look at three things when choosing a platform: whether their assets are safe, whether liquidity is deep enough, and whether someone responds promptly when problems arise.

Today, that was confirmed once again. DefiLlama data shows that Gate had approximately $194 million in net inflows over 24 hours, ranking first among centralized exchanges worldwide. In the current market environment, the ability to attract sustained, large-scale net inflows fully demonstrates the platform’s overall competitiveness in liquidity
The Musk-themed puppy token Puppies emerged out of nowhere within a minute of Musk's tweet, “l love you puppies”; its contract address ends in 6eb2, it is listed on over ten exchanges, and communities in more than 50 countries are continuing to build, making it worth accumulating at low levels
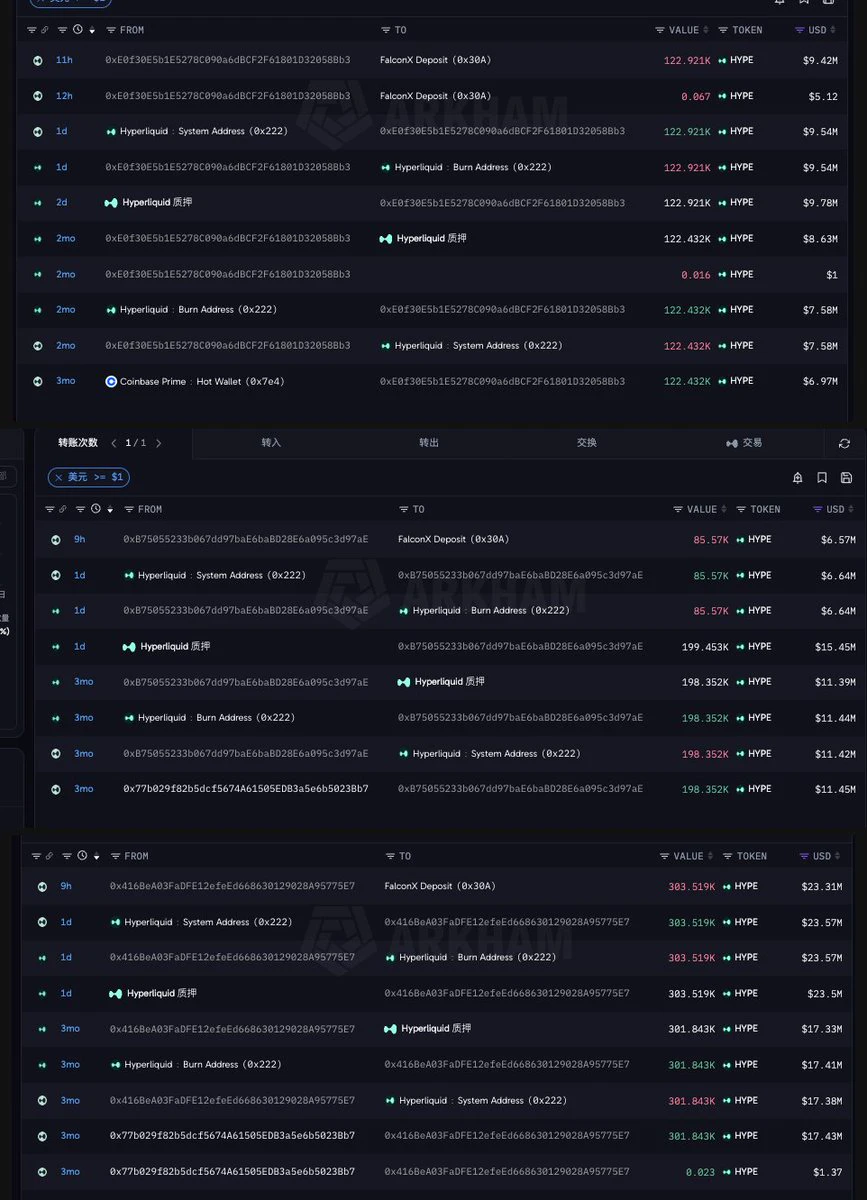
[On-chain activity] $HYPE Large unstaked holdings flow into FalconX 👀
Over the past ~11 hours, three addresses transferred a total of 512k $HYPE to FalconX Deposit one after another, worth approximately $39.3 million
0xE0f3: 122.9k tokens, approximately $9.42 million
0xB750: 85.6k tokens, approximately $6.57 million
0x416Be: 303.5k tokens, approximately $23.31 million
Looking further back, all three addresses had previously recorded large staking positions
Over the past two days, the related holdings have gradually moved out of the Hyperliquid staking system and then into FalconX
The three tr
post-image
HYPE+0.24%
What Is Walk-Forward Backtesting? Why Might a Fixed Historical Dataset Fail to Adapt to a Changing Crypto Market?

In the cryptocurrency market, a strategy may perform exceptionally well during an uptrend over the past two years, yet incur frequent losses in the choppy market that follows.

This does not necessarily mean the strategy has no value at all; the market environment may have changed. If a trading strategy is developed and tested using only a fixed set of historical data, it may not fully reflect how well it can adapt across different periods.

One method worth learning about is Walk
post-image
11.9 SOL Trading Plan
Market Analysis

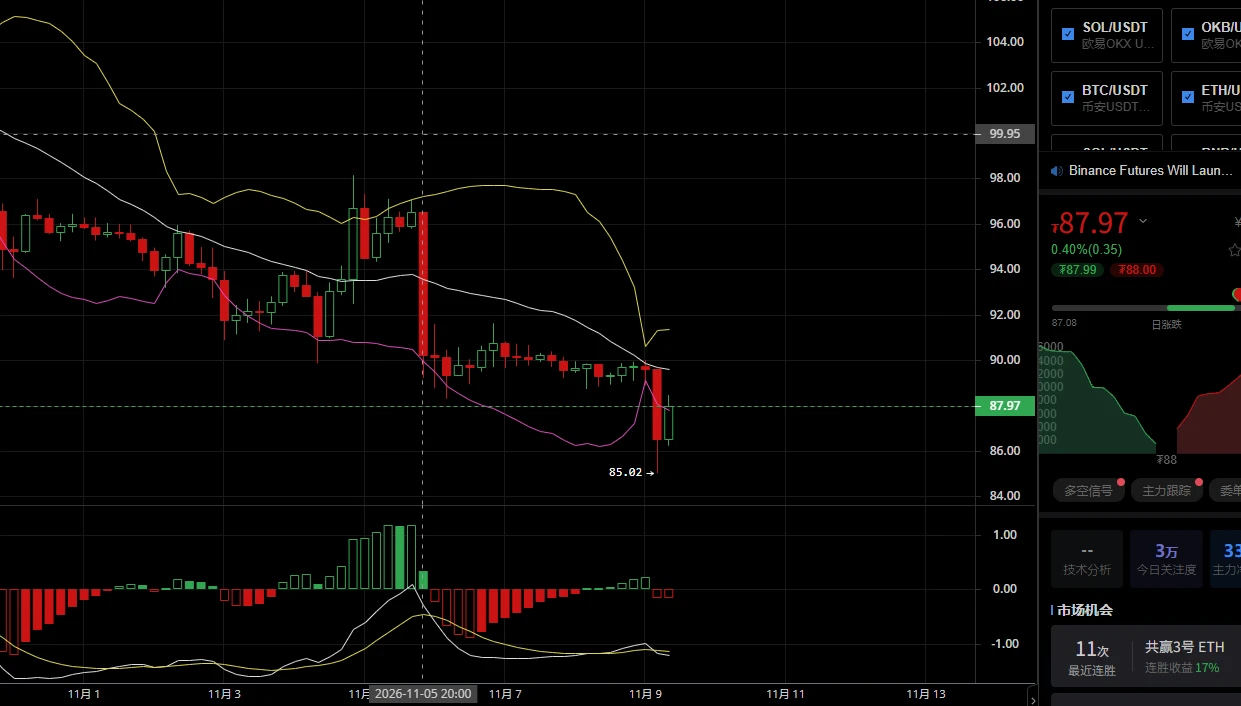
The candlestick chart shows SOL recently dropping sharply, hitting a low of **85.02** and forming a long lower wick—a sign of a short-term plunge that has released bearish pressure. The current price is 87.97, with a slight recovery after the retest. Support is emerging at the lower Bollinger Band, and indicators below show signs of bullish divergence. Bearish momentum is fading, creating an opportunity for a rebound.

Entry Zone

Preferably wait for a retest of the 86.80–87.20 range and enter long in batches;
Aggressive approach: Open a small long pos
post-image
SOL-0.74%
Imagine dedicating 30 or 35 years of your life to serving the state, retiring, and then spending another 15, 20 or even 26 years waiting for your gratuity.
Money you legitimately worked for. Some of these outstanding payments date back to the year 2000, with others reportedly going as far back as the military era.
What makes this even more touching are the personal stories of the beneficiaries. People who had almost given up hope. Retirees who had resigned themselves to fate, families dealing with illness and financial difficulties, and people who never thought they would live to enjoy the fr
Tomorrow night at 21:30, the truth will come out! How should investors respond if U.S. CPI comes in hotter than expected?

When it comes to U.S. CPI, the easiest mistake is to bet on a one-way move in advance.
At 21:30 on November 10, the U.S. October CPI will be released. The market is watching for a year-over-year reading of 3.7%; if the figure comes in above expectations, bets on a December rate hike may heat up further.
But investors would do well to prepare three possible scenarios first.
Scenario one: CPI comes in significantly above expectations. The dollar and Treasury yields may rise,
BTC-0.65%
  • 34
TODAY LIVE TECNICAL WITH SIGNALS
live-cover
LIVE1,877
#USAIStocksHitHard
#美股史诗级抛售 #美股史诗级抛售 #ShareWeekly $NVDA $AMD $SPX
Thursday’s selloff is being called either “the end of the AI trade” or “just profit taking”. The numbers say neither. The cleanest way I can read it is to split the AI trade into three layers and look at what each one did.

What happened

The Nasdaq fell 5.5% into correction territory, the S&P 500 fell 4.4%, and the Dow dropped about 1,833 points. The semiconductor index fell about 12%, one of its largest one day drops on record. Nvidia lost 9%, which wiped out around $447 billion of value. AMD and Micron each fell about 17
NVDA+3.04%
AMD+1.73%
SPX+0.33%
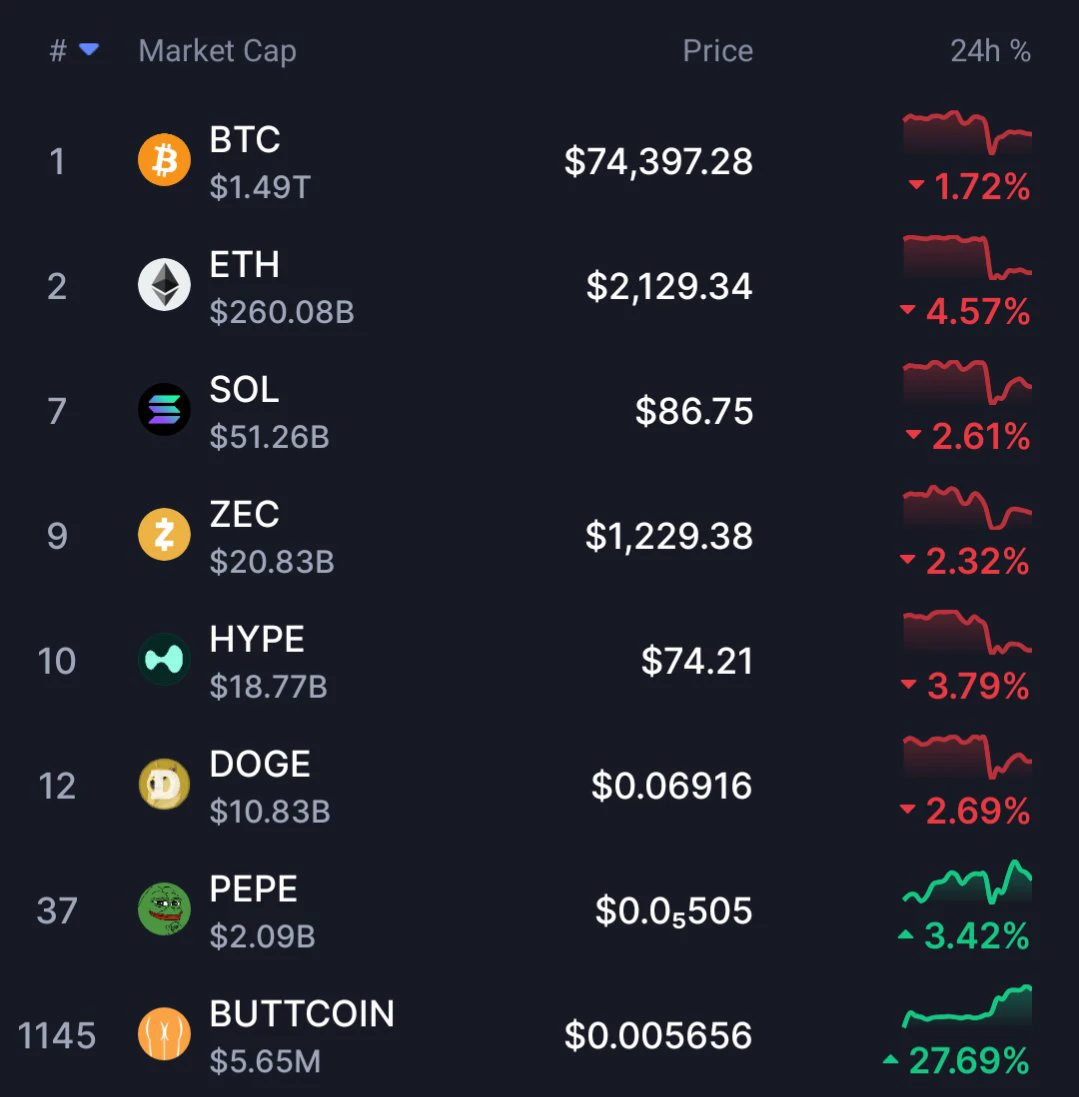
$Buttcoin is the new bitcoin
post-image
BTC-0.67%
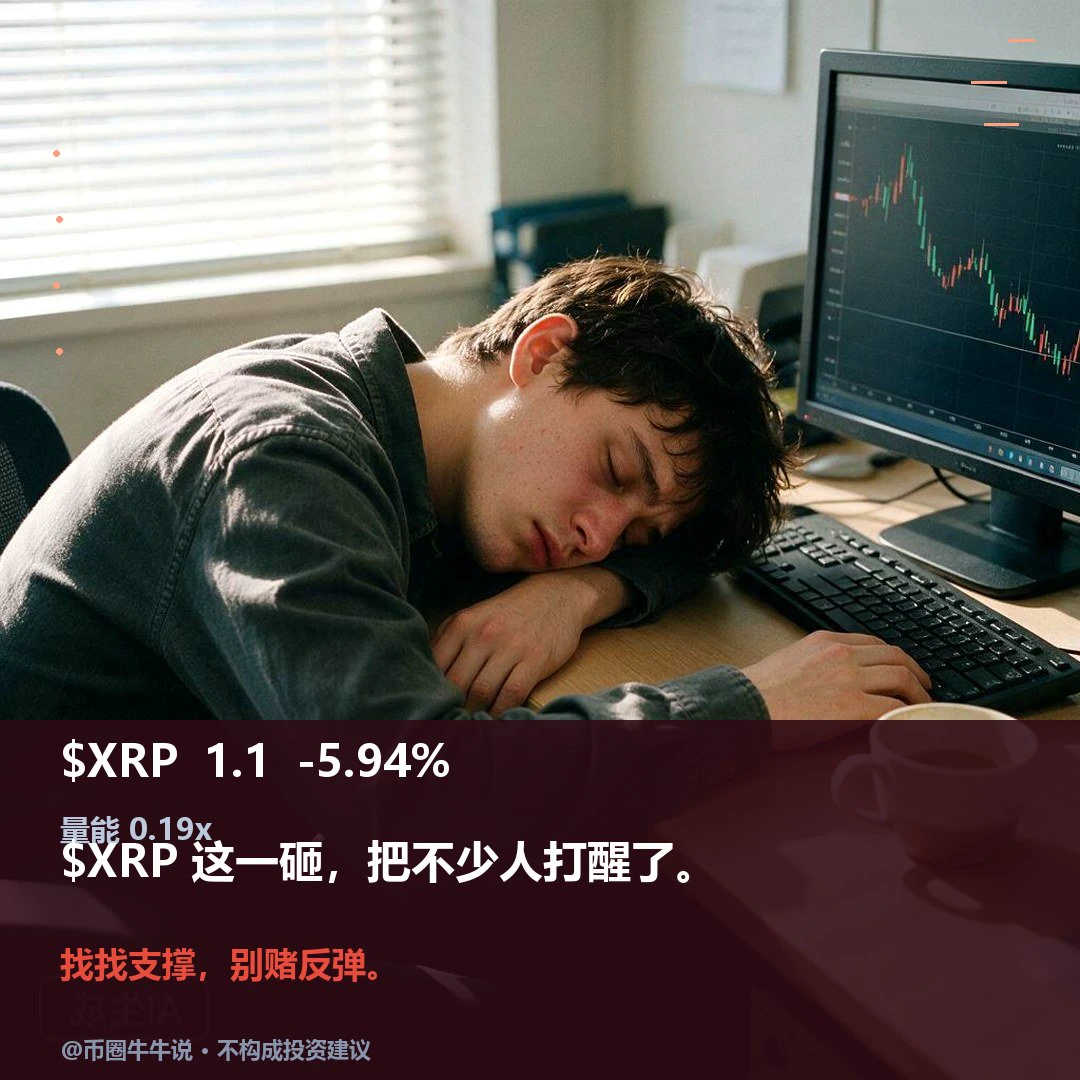
$XRP Currently trading at 1.0966, 24H -5.94%. 1H is weak: RSI17.1, EMA20 1.1263, resistance 1.1699, support 1.0925; 4H is weak: RSI18.5, EMA20 1.1653, resistance 1.3271, support 1.0925. Volume is only 0.19x the average. To the upside, price needs to hold above the 1.1699 resistance; a break below the 1.0925 support would weaken the structure. Going forward, watch whether price can hold above 1.1699 and reclaim 1.0925 after losing it; a break below 1.0925 without a recovery invalidates the setup. Market volatility is high; for observation only.
post-image
XRP-1.15%
I called it when the crowd was at its loudest, and lost a few hundred followers afterward. ETH at 2.2K and BTC at 73K both hit, and it hasn’t even been two months—once again, I don’t have to leave crypto. With ETH at 2.7K and BTC at 87K, you still can’t bring yourself to short?
Are the haters still around? During this downturn, many streamers keep urging you to buy the dip and go long. Block and unfollow anyone giving you that advice—if they can’t even read the trend, why are they trading? #BTC闪崩插针
ETH-1.26%
BTC-0.67%
  • 4
BTC plunged and quickly rebounded! Is this the final shakeout or a fake move before the storm?

Longs have just been slaughtered, but shorts shouldn’t pop the champagne just yet!
BTC briefly fell to $73,510 in 15 minutes, then quickly rebounded. In just 1 hour, about $745 million in positions across the market were liquidated, including about $715 million in long positions.
This kind of market action can easily create an illusion: a plunge makes people think the bull market is over, while a rebound makes them believe it’s about to return.
But the market’s true direction often isn’t revealed by
SPCX+8.74%
  • 30
The White House’s move to make automatic military-service registration for men aged 18 to 45 law takes effect at midnight on December 31, and analysts are all calling it the last step before an invasion. Social media is in an uproar, and those early-morning hours when liquidity is thinnest are when price wicks are most likely. Tell us your position.
post-image
💰 The market continues to fluctuate, while Gate's 24-hour net inflows rank among the top three globally

According to DefiLlama data, Gate recorded net inflows of about $40.66 million over the past 24 hours, ranking third among centralized exchanges worldwide. 🏆

Amid market volatility, fund flows have once again become a focus of attention.

Some believe inflows reflect trading demand and market confidence; others think short-term inflows may simply result from portfolio adjustments, margin top-ups, or waiting for the next trading opportunity.

Inflows are a positive signal, but more data i
GateSquare
💰 The market continues to fluctuate, while Gate's 24-hour net inflows rank among the top three globally

According to DefiLlama data, Gate recorded net inflows of about $40.66 million over the past 24 hours, ranking third among centralized exchanges worldwide. 🏆

Amid market volatility, fund flows have once again become a focus of attention.

Some believe inflows reflect trading demand and market confidence; others think short-term inflows may simply result from portfolio adjustments, margin top-ups, or waiting for the next trading opportunity.

Inflows are a positive signal, but more data is needed to determine whether they can translate into sustained buying pressure.

💬 What do you think will be more important to watch next: spot trading volume, sustained fund inflows, or BTC's price performance?

Join #Gate24小时净流入全球第三 on Gate Square to share your market observations, trading strategies, or ideas on fund allocation.

📖 Odaily reports:
https://www.odaily.news/zh-CN/newsflash/532275

repost-content-media
BTC-0.67%
bitcoin:native
Long
post-image
BTC-0.67%
Load More

Join 40 M users in our growing community

⚡️ Join 40 M users in the crypto craze discussion

💬 Engage with your favorite top creators

👍 See what interests you

Trending Topics

USCPIDataIncoming

26.7k Views1.77k Discussing

The U.S. October CPI report will be released on November 10 at 8:30 a.m. ET. September CPI came in at 3.7% year over year, and markets will be watching closely for signs that inflation is cooling, especially in core CPI. A softer-than-expected reading could strengthen rate-cut expectations, while hotter inflation may pressure risk assets through higher Treasury yields and a stronger dollar. How do you think this CPI print will move $BTC, U.S. stocks and gold?

RedBullDoublePodiumInBrazil

1.25k Views30.52k Discussing

BTCFlashCrash

59.21k Views66.18k Discussing

View More