Square
Following
Hot
News
Profile

Ai_Power

vip
Active for: 0.4y
Peak Tier 5
No content yet
22
Following
4.6k
Followers
10.7k
Liked
Pin
#股票交易分享挑战
Stock Trading Share Challenge
Introduction
The Stock Trading Share Challenge is basically a way to make trading more structured and content-focused. Instead of just clicking buy and sell, it’s about sharing your market thoughts, analysis, risk management habits, and what you’re learning along the way.
Success comes from solid research, disciplined execution, good risk control, and being able to clearly explain your ideas — not from chasing quick wins or overtrading.
Understanding the Challenge
The goal can be trading, content creation, community engagement, or a mix of all three.
A
  • 12
  • 4
#ShareWeekly #WeekendMarketBullishOrBearish
This weekend I am starting from a market that took three separate shocks in five days and still closed the week roughly where it opened, and that single fact is the reason I am not bearish going into Saturday and Sunday.

Bitcoin's seven days, session by session, because the path matters more than the destination. BTC began the week around $77,300 and traded a range of roughly $75,000 to $79,538. Monday, September 14, it gained about 1.75% and closed near $78,185 after tagging that weekly high. Tuesday, September 15, was the break, down about 3
HighAmbition
#ShareWeekly #WeekendMarketBullishOrBearish
This weekend I am starting from a market that took three separate shocks in five days and still closed the week roughly where it opened, and that single fact is the reason I am not bearish going into Saturday and Sunday.

Bitcoin's seven days, session by session, because the path matters more than the destination. BTC began the week around $77,300 and traded a range of roughly $75,000 to $79,538. Monday, September 14, it gained about 1.75% and closed near $78,185 after tagging that weekly high. Tuesday, September 15, was the break, down about 3.28% to roughly $75,620 after the Senate rejected the CLARITY Act cloture motion 49 to 50, a vote that needed 60 and instead triggered heavy long liquidations and pushed price back under $76,000. Wednesday, September 16, recovered about 0.76% to around $76,190 despite the Fed, and Thursday, September 17, added another 0.17% to roughly $76,323. Friday, September 18, opened near $76,350, up 0.3%, and lifted to about $77,991 early in the session. Net change across seven days, between -0.2% and -0.3%, inside a range of roughly 6% from low to high. A market that absorbs a legislative defeat and the first rate hike since 2023 in the same week and finishes flat is a market that found buyers.

Zoom out and the repair is clearer than the weekly candle suggests. Bitcoin is up roughly 21% over thirty days, from about $63,350 to the $76,000 area, against a 52-week range of $57,800 to $126,200. It is still down about 34% year over year and sits near 60% of its all-time high of $126,198 from October 6, 2025. Market cap is around $1.53 trillion and dominance is roughly 58.7%, which tells me capital is parking in Bitcoin first and rotating later, not leaving the asset class.

Ethereum's week, same treatment. ETH ranged between roughly $2,360 and $2,608. Midweek it dipped to about $2,406, down roughly 2% on Fed day, and on Friday it opened near $2,445, up about 1.2%, then pushed to about $2,501 while Bitcoin was still under $78,000. It is currently around $2,450 to $2,490 depending on venue, up about 0.3% on the week. That intraday push through $2,500 with BTC lagging is the relative strength I keep pointing at.

The thirty-day comparison is where Ethereum wins clearly. ETH is up between 27% and 32% over a month against Bitcoin's roughly 21%, while still down about 45% year over year and trading near 50% of its all-time high of $4,953.73 from August 24, 2025. Market cap is near $300 billion, dominance around 11.8%, with 24-hour volume close to $16 billion against a weekly figure near $110 billion.

Flows are the honest part of this picture, so here they are. Spot Bitcoin ETFs took in $986.9 million in the week ending September 5, the strongest stretch of 2026, then flipped to $463 million of net outflows for September 7 to 11, ending a three-week inflow streak, and bled another $299 million on September 16 after the CLARITY vote failed. On September 17 they turned positive again with about $159.5 million, led by BlackRock's IBIT at roughly $183.7 million. Month to date Bitcoin ETFs remain net positive near $307 million across eight sessions, category assets sit around $97.6 billion, and cumulative inflows since launch are about $55.6 billion. Ethereum ETFs are the stronger tape, with $197 million of inflows for September 7 to 11, a fourth consecutive positive week, though they gave back $193.5 million on September 16 and about $39 million on September 17.

Derivatives and sentiment tell the same cautious story. Bitcoin open interest is near $52 billion with funding at a mild 0.0066%, and daily RSI readings sit at 42 on the one-hour, 36.9 on the four-hour and 48.5 on the daily, which is neutral to oversold rather than stretched. Liquidations over the past day ran about $346 million, with shorts at roughly $196 million against $150 million of longs, meaning the bounce was partly short covering rather than pure new demand. The Fear and Greed Index is at 50, neutral, down from 69 a week ago. Sentiment cooling while price holds is usually a healthier setup than the reverse.

The macro is the reason I keep position sizes small. The Fed raised rates 25 basis points to a 3.75% to 4.00% range, the first hike since 2023, with Goldman already shifting to an October hike call, and the Bank of Japan met September 17 and 18, adding a third liquidity variable to the week. Against that, the regulatory story did not stop. The SEC and CFTC announced new measures expanding room for crypto and tokenized assets, the SEC granted temporary conditional relief on September 17 for on-chain trading of genuine tokenized US stocks, and Strategic Bitcoin Reserve legislation keeps moving through Congress. The CLARITY Act is delayed rather than dead, with its path most likely pushed into 2027. DeFi repriced immediately, with UNI up around 27%, and Zcash jumped 23%. Gold near $4,291 an ounce, silver around $63.60 and the Nasdaq near 25,978 tell me liquidity is rotating, not disappearing.

Wider market snapshot for context. Solana is near $100, up about 2%, XRP around $1.30, and BNB near $743, up 2.4%. Solana ETFs added roughly $10.3 million and XRP ETFs about $19 million in the same week, small numbers that still point in one direction. That is a rotation profile, not a risk-off profile.

So, bullish or bearish this weekend. Cautiously bullish, with smaller size. Both negative catalysts are priced and the positive structural one is not. On Bitcoin I am watching support at $75,000 and then $73,000, with resistance at $78,200, then $80,000, and a weekly close above $80,000 would confirm the September 15 liquidation reset is finished. The risk is thin weekend liquidity, which can turn a 1% move into 3% with no fundamental reason behind it.

On Ethereum the levels are support at $2,400 and then $2,360, the weekly low, with resistance at $2,500, then $2,608, then $2,700. Above $2,400 on ETH and $75,000 on BTC I expect the weekend to grind higher. Below both on a daily close, my thesis is wrong and I would rather be flat than argue with the tape.

Crypto or tokenized stocks. Over the next twelve months I am more bullish on tokenized stocks than on any single altcoin, and that still surprises me. The sector grew about 149% year to date to roughly $1.7 billion in market value by June 2026 with monthly volumes above $6.7 billion, and some forecasts now point near $4 billion by year end. Tokenized equity perpetuals alone processed about $376 billion in July 2026, roughly 50 times spot tokenized equity volume and up 209-fold in a single year. Wallet growth of about 195,000 in the second quarter, a $4,800 average wallet value, and 42% of all real-world-asset wallets says this is retail adoption rather than headline plumbing. Robinhood rose 5.2% on the regulatory news and trades near a $100 billion value, Coinbase added 5.8%, and Robinhood now reports 28.6 million funded customers alongside $384 billion of platform assets. For weekend trading specifically I still pick crypto, because leverage, liquidity and depth remain better there even now that tokenized stocks are moving toward around-the-clock sessions.

If I could trade only one asset, it is Ethereum. Stronger thirty-day momentum at 27% to 32% versus Bitcoin's 21%, a reclaim of $2,500 while BTC fights $78,000, and the fact that Ethereum and Solana host more than 70% of tokenized stock value, which means the tokenization theme runs on Ethereum rails. Bitcoin stays my long-term anchor and the asset I would rather hold through a bad quarter, but for a weekend view with a defined stop, ETH is the cleaner expression of the trend.

One more number to hold in mind. Fidelity's fourth-quarter outlook notes that if Bitcoin's four-year cycle still holds, a bottom could form around November 2026, while Standard Chartered projects Ethereum at $4,000 by end-2026 and higher through the decade. I treat both as context, not targets, and I would rather trade levels than narratives.
#GateSquareMidAutumnReunion

repost-content-media
  • 4
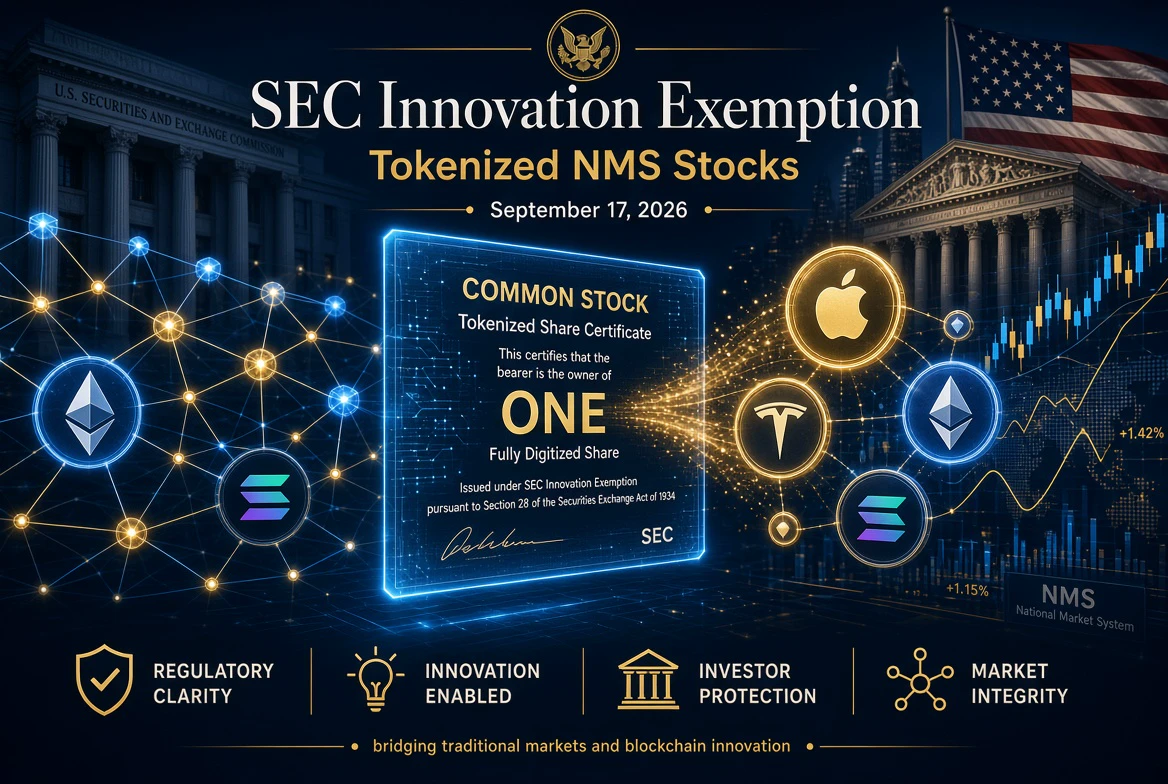
#SECApprovesLimitedOnChainTradingOfTokenizedStocks .
The United States Securities and Exchange Commission approved limited on-chain trading of tokenized stocks on 17 September 2026, through an order the Commission calls the Innovation Exemption. In simple terms, a small number of regulated venues are now allowed to let people trade blockchain tokens that represent genuine listed American shares, without those venues being treated as fully registered stock exchanges. This is a temporary, conditional experiment rather than a general legalisation, and it applies only to tokens that represent real
HighAmbition
#SECApprovesLimitedOnChainTradingOfTokenizedStocks .
The United States Securities and Exchange Commission approved limited on-chain trading of tokenized stocks on 17 September 2026, through an order the Commission calls the Innovation Exemption. In simple terms, a small number of regulated venues are now allowed to let people trade blockchain tokens that represent genuine listed American shares, without those venues being treated as fully registered stock exchanges. This is a temporary, conditional experiment rather than a general legalisation, and it applies only to tokens that represent real ownership of the underlying security. It does not mean every stock has suddenly become crypto, and it does not cover synthetic tokens or derivatives that merely track a price. The correct reading is that a regulatory pathway now exists where none existed before.
The technical design is worth understanding because it explains both the opportunity and the limits. Eligible venues are called Tokenized Securities Venues, or TSVs, and they may match buyers and sellers through permissioned automated market makers and liquidity pools. To use the relief, a venue must give public notice before operating, publish US dollar denominated transaction data at regular intervals including price, size, time, pool address, end of day pool size and daily volume, keep proper books and records, apply technology safeguards, and coordinate trading halts whenever the underlying stock is halted on its primary exchange. There are caps on how many symbols a venue may list and how much volume it may handle, calibrated by limit up and limit down tiers. Issuers must be informed and must retain the ability to object to their stock being represented as a token. Token holders must receive the same economic and governance entitlements as ordinary shareholders, including dividends and voting rights. Certain liquidity providers committing their own capital receive tailored dealer relief subject to disclosure and recordkeeping requirements. The relief runs for five years and the Commission is openly requesting public comment on how the framework should evolve toward permanent rules.
The exclusion list matters as much as the permission list. Synthetic tokens and derivative products are outside the order, which means instruments that only deliver price exposure, including some retail offerings that became popular over the past two years, would need to restructure to fit this US pathway. The SEC's stated rationale is that tokenization can modernise issuance, trading, transfer, settlement and ownership records, with the potential to reduce costs, improve transparency and expand liquidity, particularly for assets that have historically been less liquid. Regulators also framed this as resolving genuine legal uncertainty that had pushed responsible innovation away from the United States rather than as an endorsement of speculative token design.
The immediate market reaction was decisive. Securitize, which became the first major tokenization firm to list in the United States in July, jumped roughly fourteen percent on the day, while Coinbase rose about five percent and crypto linked equities extended their gains into the following session. The combined value of tokenized assets stood near thirty eight and a half billion dollars, up more than seventy percent year on year.
So what genuinely changes for the crypto market. The most important shift is legal rather than financial. For the first time, a US federal securities framework creates a compliant lane for trading real equity on chain rather than merely tolerating lookalike tokens. That moves the real world asset narrative from a marketing promise toward actual market plumbing, and it gives institutional participants a rulebook they can point to when internal compliance teams ask whether on-chain securities are permitted.
The second effect is settlement efficiency. On-chain settlement delivers near instantaneous finality and eliminates the multi day clearing cycle that traditional equities still rely on, which is the structural cost argument behind the entire tokenization thesis. If that advantage proves real in practice and not just in theory, it pressures the economics of the existing clearing and back office stack over time.
The third effect is that public blockchains and decentralised venues become second order beneficiaries. Research commentary from major digital asset firms argues that the exemption increases the utility of tokenized assets, benefiting leading public chains such as Ethereum, Solana and BNB Chain, as well as decentralised trading applications that can meet the conditions. That is real fee and activity potential, though the permissioning requirement means the flow will arrive wrapped in identity checks rather than open permissionless trading.
The fourth effect concerns stablecoins. If tokenised equities settle on chain, the natural cash leg is a dollar stablecoin. That quietly widens the addressable role of stablecoin infrastructure from trading pairs and payments toward settlement of regulated securities, which is a structurally larger opportunity than most retail participants appreciate.
The fifth effect is legitimacy and signalling. The Commission described this as a scoped experiment intended to generate data for future policymaking, and it referenced money market funds, index funds and exchange traded funds as products that once grew out of similar exemptive relief. Reuters noted that over the long term this could bring crypto native venues into direct competition with established retail brokerages whose business models depend on the current market structure. That is a slow threat, not an immediate one, but it is now on the table.
There is also context worth holding alongside the headline. The SEC authorised Nasdaq to facilitate tokenized securities trading in March 2026, and the New York Stock Exchange announced a partnership with a tokenization platform, while the broader policy push has been labelled Project Crypto. This order is not an isolated event but the latest step in a coordinated direction that also touches the Depository Trust and Clearing Corporation and other core market infrastructure.
Now the honest caveats, because a post that only lists upside is not analysis. Permissioned liquidity pools and identity verification mean this is not permissionless decentralised finance, so composability with open protocols will be limited and slow to develop. Symbol and volume caps constrain near term revenue, which means any valuation re-rating should be judged against a multi year runway rather than a single quarter. Off hours price discovery is a genuine risk, since a token trading around the clock while the underlying stock is closed can drift and then gap when the real market reopens. The issuer objection rights give listed companies real leverage over listings. Liquidity may fragment across several venues instead of concentrating. And because this is a five year conditional exemption and not permanent rulemaking, policy reversal remains a live risk in any future administration.
On who benefits, the clearest structural winners are tokenization and issuance infrastructure providers, transfer agents and custodians with regulated models, and venue operators able to satisfy the conditions. Liquidity providers using their own balance sheet gain a newly legal business line. Ethereum, Solana and BNB Chain gain real asset flow. DeFi venues on those chains gain a regulated entry point, even if permissioning limits how far that goes. Stablecoin issuers, oracle and market data providers, wallet builders and compliance vendors benefit indirectly as the supporting stack gets built. End investors gain fractional access, the option of self custody, round the clock trading windows, and, under the conditions of this order, preservation of dividends and voting rights. US capital markets gain a defensive position against offshore venues that had been capturing this activity.
On who faces pressure, providers of synthetic price exposure tokens must adapt or be excluded from the US market. Offshore venues lose part of their relative regulatory advantage. Traditional brokerages face a slow erosion of fee structures if on chain execution eventually proves cheaper. Tokenization start-ups without compliance infrastructure face higher barriers. And holders of legacy price tracking stock tokens should be clear about what they own, because those instruments generally represent no ownership, no voting rights and no dividends, which is a different product from what has just been approved. On Gate, for example, users can already access equity and ETF exposure as well as stock tokens listed on the spot market, so the practical takeaway for readers is to know exactly which category they hold: a rights bearing tokenised share, a price tracking token, or a derivative arrangement. The risk profiles are not the same.
Here is where I agree with your reading and where I would sharpen it. You are right that this is significant for real world assets, tokenized stocks and crypto exchanges, and right that the regulatory path for bringing traditional financial assets into the blockchain ecosystem is expanding. My refinement is that today the signal is much larger than the substance. The caps, the permissioning and the five year clock mean the measurable near term impact on market structure is small, while the narrative re-rating is large and immediate. That asymmetry explains why token prices and related equities move hard on the headline. It also means short term moves around this news are sentiment driven and should be treated as such.
The thesis becomes durable only if a few things happen. Caps get lifted after the data review. Issuers choose not to opt out at scale. Published volume data shows that automated market makers can handle genuine equity flow with acceptable spreads and without destabilising off hours pricing. The exemption is extended or converted into permanent rulemaking. And coverage widens from a limited set of stocks toward exchange traded funds, bonds and other instruments. Until those boxes are ticked, the accurate description is a bridge under construction, not a market that has already crossed it.
For crypto more broadly, the deeper implication is that capital, compliance and technology are converging, and the winners will be entities that can hold regulated securities and on chain rails at the same time. That combination is rare today, which is exactly why the next twelve to twenty four months of filings, listings and volume disclosures deserve close attention rather than a single day of price action.
#GateSquareMidAutumnReunion
repost-content-media
  • 2
#GateTrenchesExclusive0GasTrading
#GateSquareMidAutumnReunion

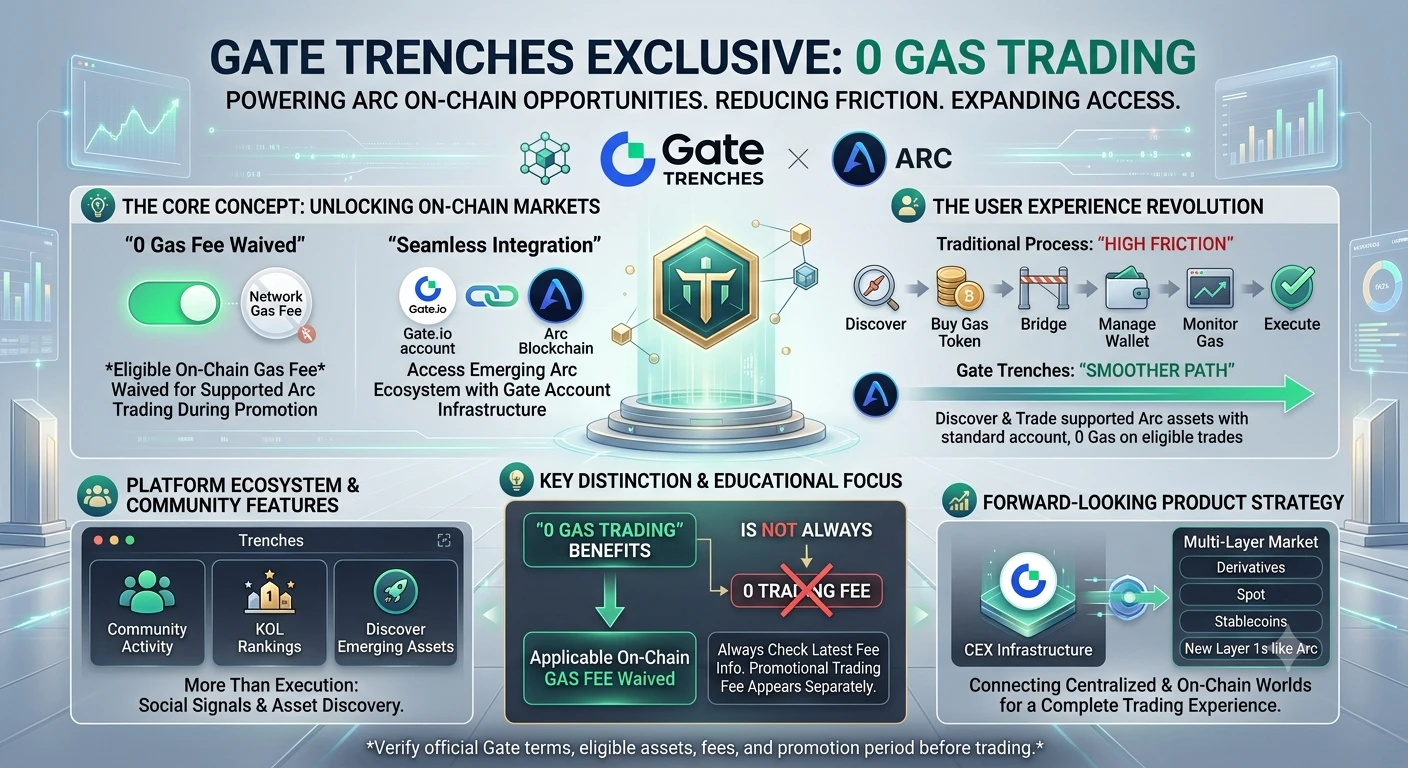
GATE TRENCHES EXCLUSIVE 0 GAS TRADING — MAKING ON-CHAIN TRADING SIMPLER, FASTER AND MORE ACCESSIBLE
When I look at the evolution of crypto trading, one thing becomes increasingly clear: the next stage of growth is not only about adding more assets, but about removing the complexity that prevents users from accessing those assets. This is exactly where Gate Trenches becomes extremely interesting. Gate is bringing a more streamlined on-chain trading experience to users while introducing an exclusive 0 Gas benefit for eligible Arc tr
HighAmbition
#GateTrenchesExclusive0GasTrading
#GateSquareMidAutumnReunion

GATE TRENCHES EXCLUSIVE 0 GAS TRADING — MAKING ON-CHAIN TRADING SIMPLER, FASTER AND MORE ACCESSIBLE
When I look at the evolution of crypto trading, one thing becomes increasingly clear: the next stage of growth is not only about adding more assets, but about removing the complexity that prevents users from accessing those assets. This is exactly where Gate Trenches becomes extremely interesting. Gate is bringing a more streamlined on-chain trading experience to users while introducing an exclusive 0 Gas benefit for eligible Arc trading, creating a powerful combination of accessibility, convenience and blockchain innovation.
The phrase “0 Gas Trading” sounds simple, but its practical meaning is important. On-chain transactions can normally require a blockchain network fee, commonly known as gas. Users may need to hold the network's gas asset before they can execute certain transactions. Gate's current Trenches promotion for eligible Arc trading removes that particular gas-cost requirement during the promotional period. In other words, eligible users can trade supported Arc assets through Trenches without separately paying the applicable on-chain gas fee.
This is a meaningful improvement because gas management has historically added another layer of complexity to on-chain trading. A user may discover an asset, but then realize that they need a specific gas token. They may need to transfer funds, manage a wallet, monitor the correct network, and make sure enough gas is available before executing a transaction. Gate Trenches is designed to reduce those unnecessary steps and create a much smoother path from asset discovery to actual trading.
What makes Gate's approach particularly impressive is the integration of this experience directly into its broader ecosystem. Instead of making users completely disconnect from the Gate environment, Trenches provides access to supported on-chain opportunities while allowing users to use their Gate account infrastructure. This creates a much more familiar experience for users who want to explore emerging blockchain markets without immediately dealing with every technical layer of self-managed on-chain transactions.
And this is where I believe Gate's product strategy deserves serious recognition. Gate is not simply adding another token list or another trading screen. It is building bridges between centralized exchange infrastructure and on-chain markets. Trenches represents a different type of trading environment where discovery, community activity, emerging assets and blockchain execution can exist much closer together.
The Arc integration makes this even more significant. Arc is a new blockchain ecosystem designed with financial-market use cases in mind, including payments, trading, stablecoin activity, tokenized assets and other financial applications. Gate's rapid support for the Arc ecosystem demonstrates how quickly Gate can connect its users with new blockchain infrastructure as these ecosystems develop.
The most impressive part for me is the speed of execution. When a new blockchain ecosystem emerges, infrastructure matters. Users need wallets, asset discovery, trading access, liquidity, information and a simple way to interact with the network. Gate is positioning Trenches as a gateway where users can discover and trade supported Arc assets without turning the process into a complicated technical exercise.
There is also an important distinction that every trader should understand. “0 Gas” does not automatically mean “0 Trading Fee.” These are different costs. The 0 Gas benefit refers to the applicable on-chain gas fee for eligible transactions. Gate's current Arc Trenches promotion separately lists a promotional trading fee of 0.5% for buying and selling. Therefore, users should always check the latest fee information and promotional terms displayed by Gate before executing a trade.
This distinction is actually a positive sign from an educational perspective because understanding the difference between network fees and trading fees is essential for anyone participating in on-chain markets. Gas belongs to blockchain transaction processing, while trading fees are charged according to the trading platform's fee structure. Keeping these concepts separate helps users understand exactly what benefit they are receiving.
Beyond the fee advantage, Trenches is interesting because of its social and discovery-oriented design. Gate has introduced features around community activity, KOL rankings, Callout rankings and active-account information. That means the experience is not built purely around clicking buy or sell. Users can observe activity, discover emerging assets and explore what is happening within the on-chain trading environment.
This combination of discovery and execution is one of the strongest ideas behind the product. In traditional trading, users often move between multiple platforms for research, social signals, asset discovery and execution. A more integrated environment can reduce that fragmentation. Gate is effectively trying to bring more of the trading journey into one ecosystem.
For me, the bigger story is not simply that Gate is offering a temporary gas-fee benefit. The bigger story is that Gate understands where trading infrastructure is heading. The market is becoming increasingly multi-layered. Users want access to centralized markets, derivatives, global assets, emerging tokens, on-chain opportunities and new blockchain ecosystems. A platform that can connect these different environments has the potential to provide a much more complete experience.
Gate has consistently built its ecosystem around this idea of broad market access. Trenches adds another dimension by focusing on emerging on-chain markets and reducing the technical friction that can discourage mainstream users from exploring them.
The 0 Gas feature therefore becomes more meaningful when viewed as part of the entire product strategy. It reduces one of the most visible barriers to on-chain participation while the broader Trenches infrastructure addresses discovery, execution and community interaction.
I also appreciate the timing of the Arc integration. New blockchain ecosystems often face a difficult early stage: the technology may be available, but users still need convenient access. By connecting Arc with Gate's infrastructure, Trenches can give users a familiar route into a new ecosystem while helping increase awareness and participation around supported assets.
This is the type of product development that can make a difference in the real user experience. Innovation is not only about complicated technology or impressive technical terminology. Sometimes the strongest innovation is simply taking a complicated process and making it easier for the user.
That is exactly what Gate is attempting with Trenches.
Imagine the traditional on-chain process: discover a token, find the correct network, prepare the required gas asset, connect a wallet, transfer funds, confirm the transaction and then finally execute the trade. Every additional step introduces another opportunity for confusion or delay.
Now compare that with a more integrated Gate experience where users can access eligible Arc assets through Trenches and benefit from the current 0 Gas promotion. The difference is not merely one fee. It is a reduction in friction across the entire user journey.
This is why I see Gate Trenches as more than another feature. It represents Gate's broader ambition to make the crypto ecosystem more connected.
Gate deserves strong praise for continuing to invest in products that focus on actual user problems. The strongest platforms are not defined only by how many assets they list. They are defined by how effectively they help users discover markets, understand opportunities and execute transactions.
Gate is increasingly building that complete ecosystem.
The combination of Gate account infrastructure, Trenches, Arc integration, on-chain asset discovery, community features and the limited-time 0 Gas benefit creates a compelling example of how centralized and on-chain experiences can move closer together.
Another important point is that the 0 Gas promotion is limited by its official terms. Users should not assume that the benefit is permanent or applies to every asset and every transaction. Eligibility, supported assets, applicable fees and promotional duration should always be checked through Gate's latest official information before trading.
That transparency matters because professional trading is not simply about finding an attractive opportunity. It is about understanding the complete cost structure, knowing the rules and managing risk appropriately.
From my perspective, Gate's biggest achievement here is not the headline “0 Gas.” The bigger achievement is the infrastructure behind it.
Gate is taking something that can feel technically complicated and presenting it through a trading environment that is much easier for ordinary users to approach.
That is what outstanding product innovation looks like.
The future of crypto trading will likely involve multiple layers: centralized exchanges, decentralized infrastructure, stablecoins, tokenized assets, new Layer 1 ecosystems, social discovery and real-time on-chain markets. Gate is already building across many of these areas, and Trenches is another important piece of that larger ecosystem.
Gate Trenches shows that the exchange experience does not have to stop at traditional spot and derivatives markets. It can become a gateway to emerging on-chain economies.
And the 0 Gas initiative makes that gateway even more accessible during the promotional period.
For users exploring eligible Arc assets, the message is simple: Gate is reducing one of the practical barriers associated with on-chain trading and giving users a more convenient route into a new blockchain ecosystem.
For the broader market, the message is even bigger: exchanges are evolving from simple order-matching platforms into complete digital-asset ecosystems.
Gate is clearly participating in that evolution.
Gate Trenches + Arc + 0 Gas is therefore not just a promotional headline. It represents a broader philosophy: reduce friction, expand access, simplify blockchain interaction and give users more ways to participate in emerging markets.
That is the kind of innovation I want to see from a major crypto platform.
Gate is not standing still. It continues to expand, experiment and connect different parts of the digital-asset ecosystem. Trenches is a strong example of that direction, and the current 0 Gas benefit gives users an additional reason to explore what the platform is building.
0 Gas may sound like a small feature.
But when it removes a technical barrier from the user's journey, its real value becomes much bigger.
Gate Trenches is turning that idea into a practical trading experience — and this is exactly why Gate continues to be one of the most interesting platforms to watch as on-chain trading moves into its next phase.
l
repost-content-media
#USHouseAdvancesBitcoinReserveBill
GATE MARKET VIEW — US HOUSE ADVANCES BITCOIN RESERVE BILL
For Gate traders and crypto investors, the headline “US House Advances Bitcoin Reserve Bill” is important, but the word “Advances” matters more than anything else. This is legislative progress, not confirmation that the bill has become law, and it does not mean the US government has already started buying billions of dollars of Bitcoin from the open market. The reported committee action moves the proposal forward in the legislative process, while further congression
HighAmbition
#USHouseAdvancesBitcoinReserveBill
GATE MARKET VIEW — US HOUSE ADVANCES BITCOIN RESERVE BILL
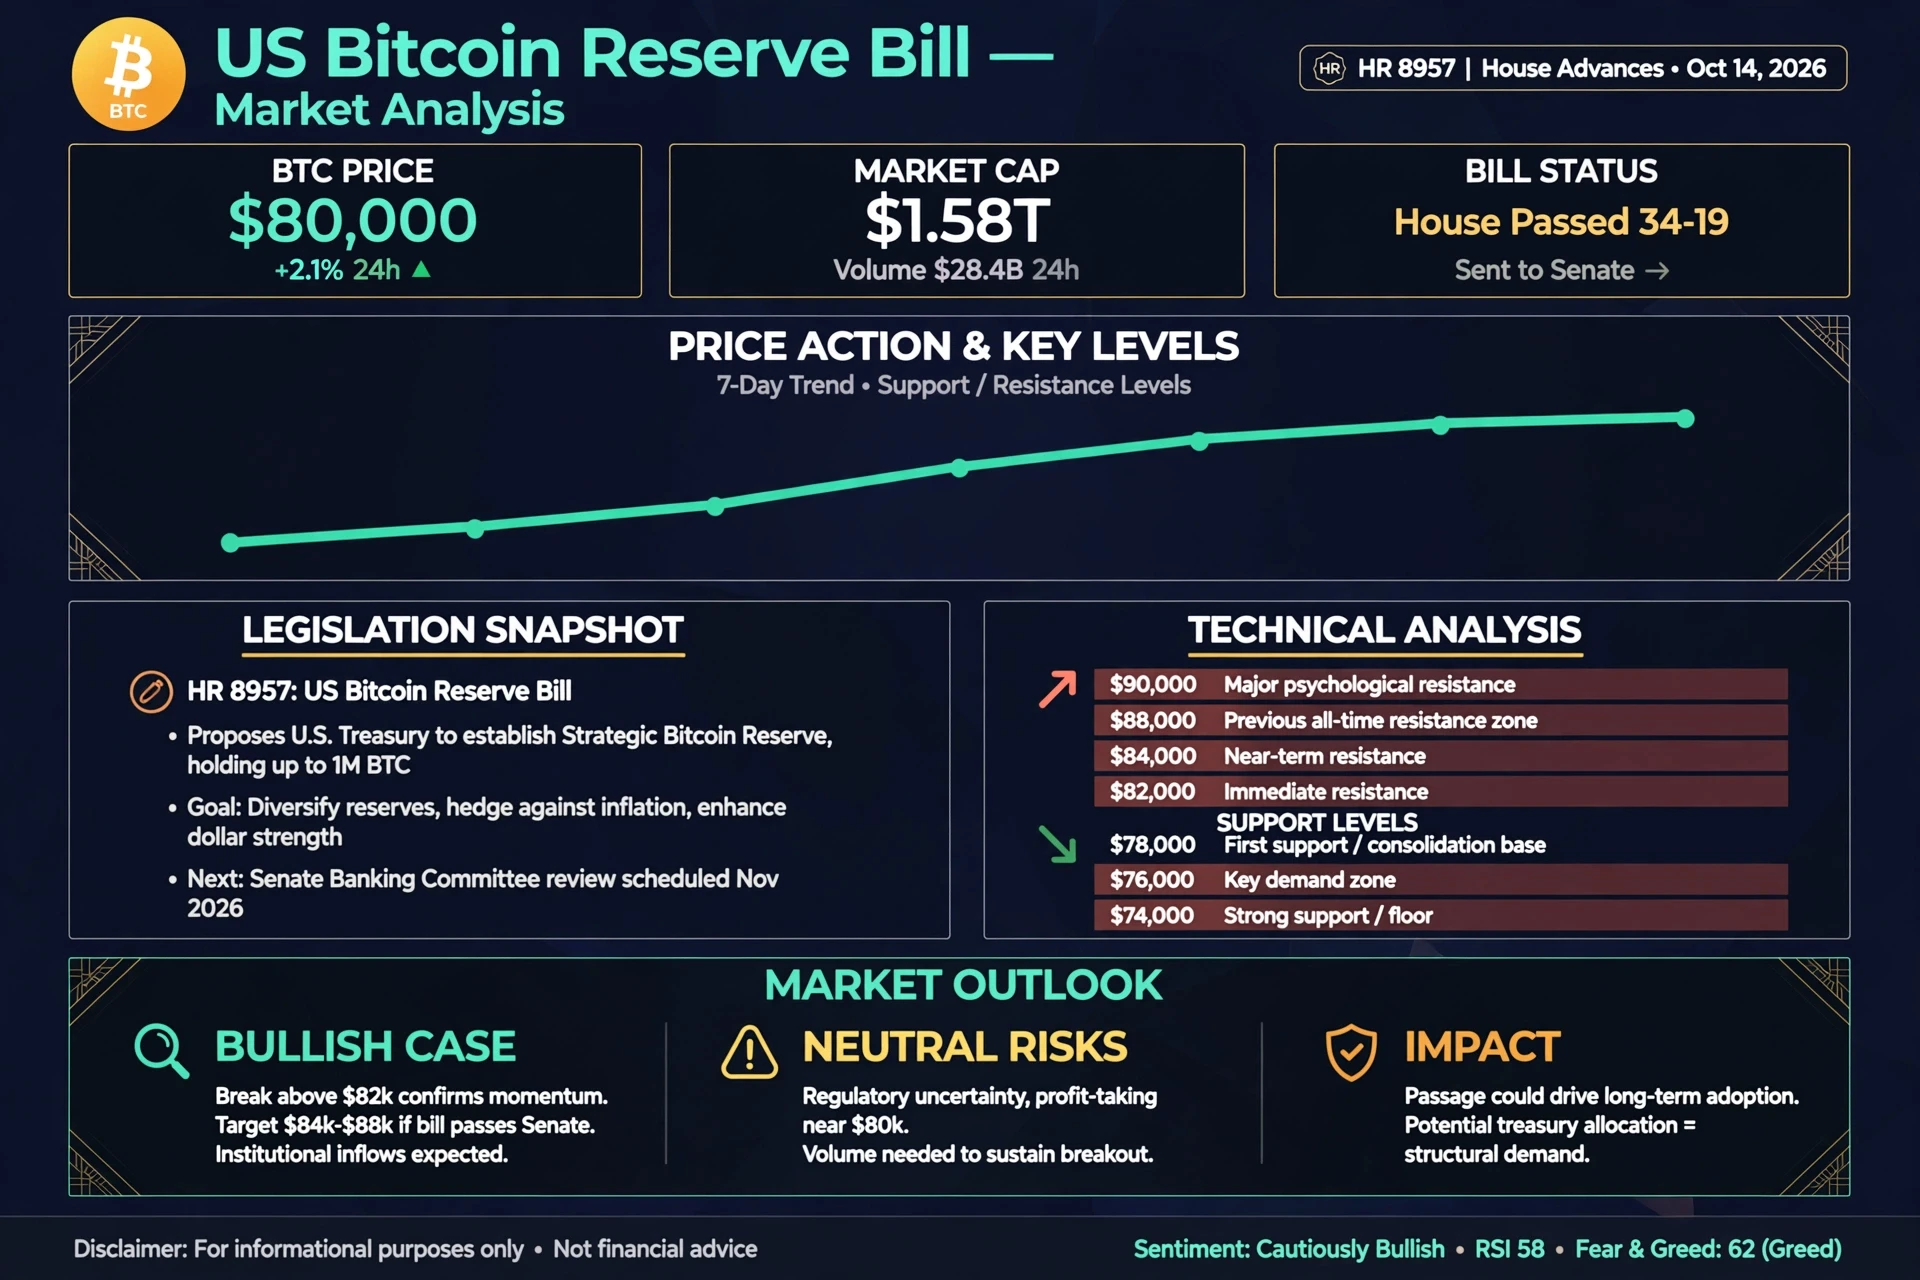
For Gate traders and crypto investors, the headline “US House Advances Bitcoin Reserve Bill” is important, but the word “Advances” matters more than anything else. This is legislative progress, not confirmation that the bill has become law, and it does not mean the US government has already started buying billions of dollars of Bitcoin from the open market. The reported committee action moves the proposal forward in the legislative process, while further congressional consideration, possible final approval, enactment and implementation would still remain separate stages.
This distinction is critical because crypto markets often price expectations before actual policy implementation. A legislative advancement can strengthen the narrative around Bitcoin as a strategic asset, but expectations should not be confused with confirmed government demand. Existing government Bitcoin holdings have largely come through seizures and forfeitures, while a future reserve framework would involve questions around how government-held Bitcoin is managed and potentially treated strategically. Any future authorized open-market purchases would represent a separate and potentially much more direct demand catalyst.
From a Gate market-analysis perspective, I would focus on what the market actually does after the headline rather than chasing the headline itself. Bitcoin has recently reclaimed the $80,000 area, making $80K an important psychological zone. If BTC holds above $80K and confirms strength through $82K with healthy spot participation, the next areas I would monitor are $84K, $86K and $88K. A sustained move above $88K could bring $90K back into focus, while continued momentum could eventually open the $92K–$95K region. These are conditional scenarios, not guaranteed targets.
The downside structure is equally important. If BTC fails repeatedly around $82K–$84K and selling pressure increases, a return toward $80K becomes possible. Losing $80K would put $78K and then $76K on watch, while stronger downside pressure could expose the $74K–$75K region. I would not treat these levels as automatic buy or sell signals; volume, liquidity, spot demand, derivatives positioning and broader market participation should confirm the move.
Volume quality is especially important because a political or regulatory headline can create a fast leveraged move that later reverses. A sustainable BTC rally would ideally combine higher prices with stronger spot activity, improving liquidity and controlled leverage. If BTC gains several percentage points while open interest expands aggressively but spot participation remains weak, the move could be more vulnerable to profit-taking and liquidation. The quality of the move matters more than the size of the first candle.
The reserve narrative also matters because Bitcoin has a maximum supply of 21 million coins. If governments, institutions, companies and long-term investors increasingly view BTC as a strategic asset, more supply could potentially move into longer-term custody. That does not mean the current committee advancement suddenly removes coins from circulation, but it strengthens the discussion around strategic ownership and liquid supply. The actual impact will depend on future legislation, implementation and real holdings rather than headlines alone.
Ethereum has a different relationship with this development. The proposed reserve framework is centered on Bitcoin, so ETH should not automatically be treated as receiving the same direct policy catalyst.
However, stronger institutional confidence in Bitcoin can potentially improve the broader digital-asset environment. One possible market sequence is BTC leading, BTC consolidating at higher levels, ETH gaining relative strength and then selected large-cap altcoins receiving additional liquidity.
For ETH, I would therefore watch relative performance rather than simply asking whether ETH is green. If BTC moves toward $84K–$86K and then stabilizes while ETH begins outperforming, that could indicate capital rotation beyond Bitcoin. If BTC continues climbing while ETH remains comparatively weak and Bitcoin dominance rises, liquidity may remain concentrated in BTC. XRP, SOL and other large-cap altcoins could participate if broader risk appetite expands, but their percentage moves can also become significantly larger on the downside during a BTC correction.
Bitcoin dominance is another key signal. A Bitcoin-specific institutional catalyst can initially concentrate capital in BTC. If dominance rises sharply, altcoins may lag even during a BTC rally. If BTC later stabilizes while liquidity remains strong, capital can potentially rotate toward ETH and selected large-cap altcoins. This makes market breadth, ETH/BTC strength and altcoin liquidity important confirmation signals.
The bigger story is Bitcoin’s continued institutionalization. The conversation is increasingly moving beyond simple speculation toward reserves, custody, treasury strategy, regulation and long-term allocation. That does not eliminate Bitcoin’s volatility. Even a strong long-term structure can experience 5%, 10% or larger corrections. What matters is whether legislative progress eventually develops into confirmed policy and real implementation.
For the Gate market roadmap, my key zones are straightforward: BTC holding $80K keeps the structure constructive; $82K is an important confirmation area; $84K–$88K becomes the next upside zone; $90K is the major psychological milestone; and $92K–$95K represents an extended upside scenario if momentum and liquidity remain strong. On the downside, $78K, $76K and $74K–$75K are the areas I would monitor if $80K fails. I would combine these levels with volume, liquidity, derivatives data and market breadth rather than using price alone.
The most important takeaway is simple: ADVANCEMENT IS NOT ENACTMENT. The committee progress can strengthen expectations around Bitcoin’s strategic role, but it is not confirmation that the United States has launched a new large-scale open-market Bitcoin buying program.
For Gate traders, the best way to follow this story is to separate political headlines from confirmed policy action and then let price, volume, liquidity and capital rotation reveal how strongly the market is actually responding.
repost-content-media
BTC-0.03%
ETH+0.58%
XRP+0.50%
SOL+0.34%
#NEARSurgesOver21Breaking3 #GateSquareMidAutumnReunion
NEAR PROTOCOL BREAKS $3 — THE BREAKOUT, THE CATALYSTS AND WHAT COMES NEXT
NEAR has suddenly moved from a recovery story into one of the market’s strongest momentum narratives. After gaining more than 20% in a single day and pushing toward the $3.90 area, NEAR decisively reclaimed the psychological $3 level and reached a roughly one-year high. What makes this move particularly interesting is that it is not being driven by a single headline alone. Confidential perpetual futures, the NEAR 3.33 incentive mechanism, record NEAR Intents activit
HighAmbition
#NEARSurgesOver21Breaking3 #GateSquareMidAutumnReunion
NEAR PROTOCOL BREAKS $3 — THE BREAKOUT, THE CATALYSTS AND WHAT COMES NEXT
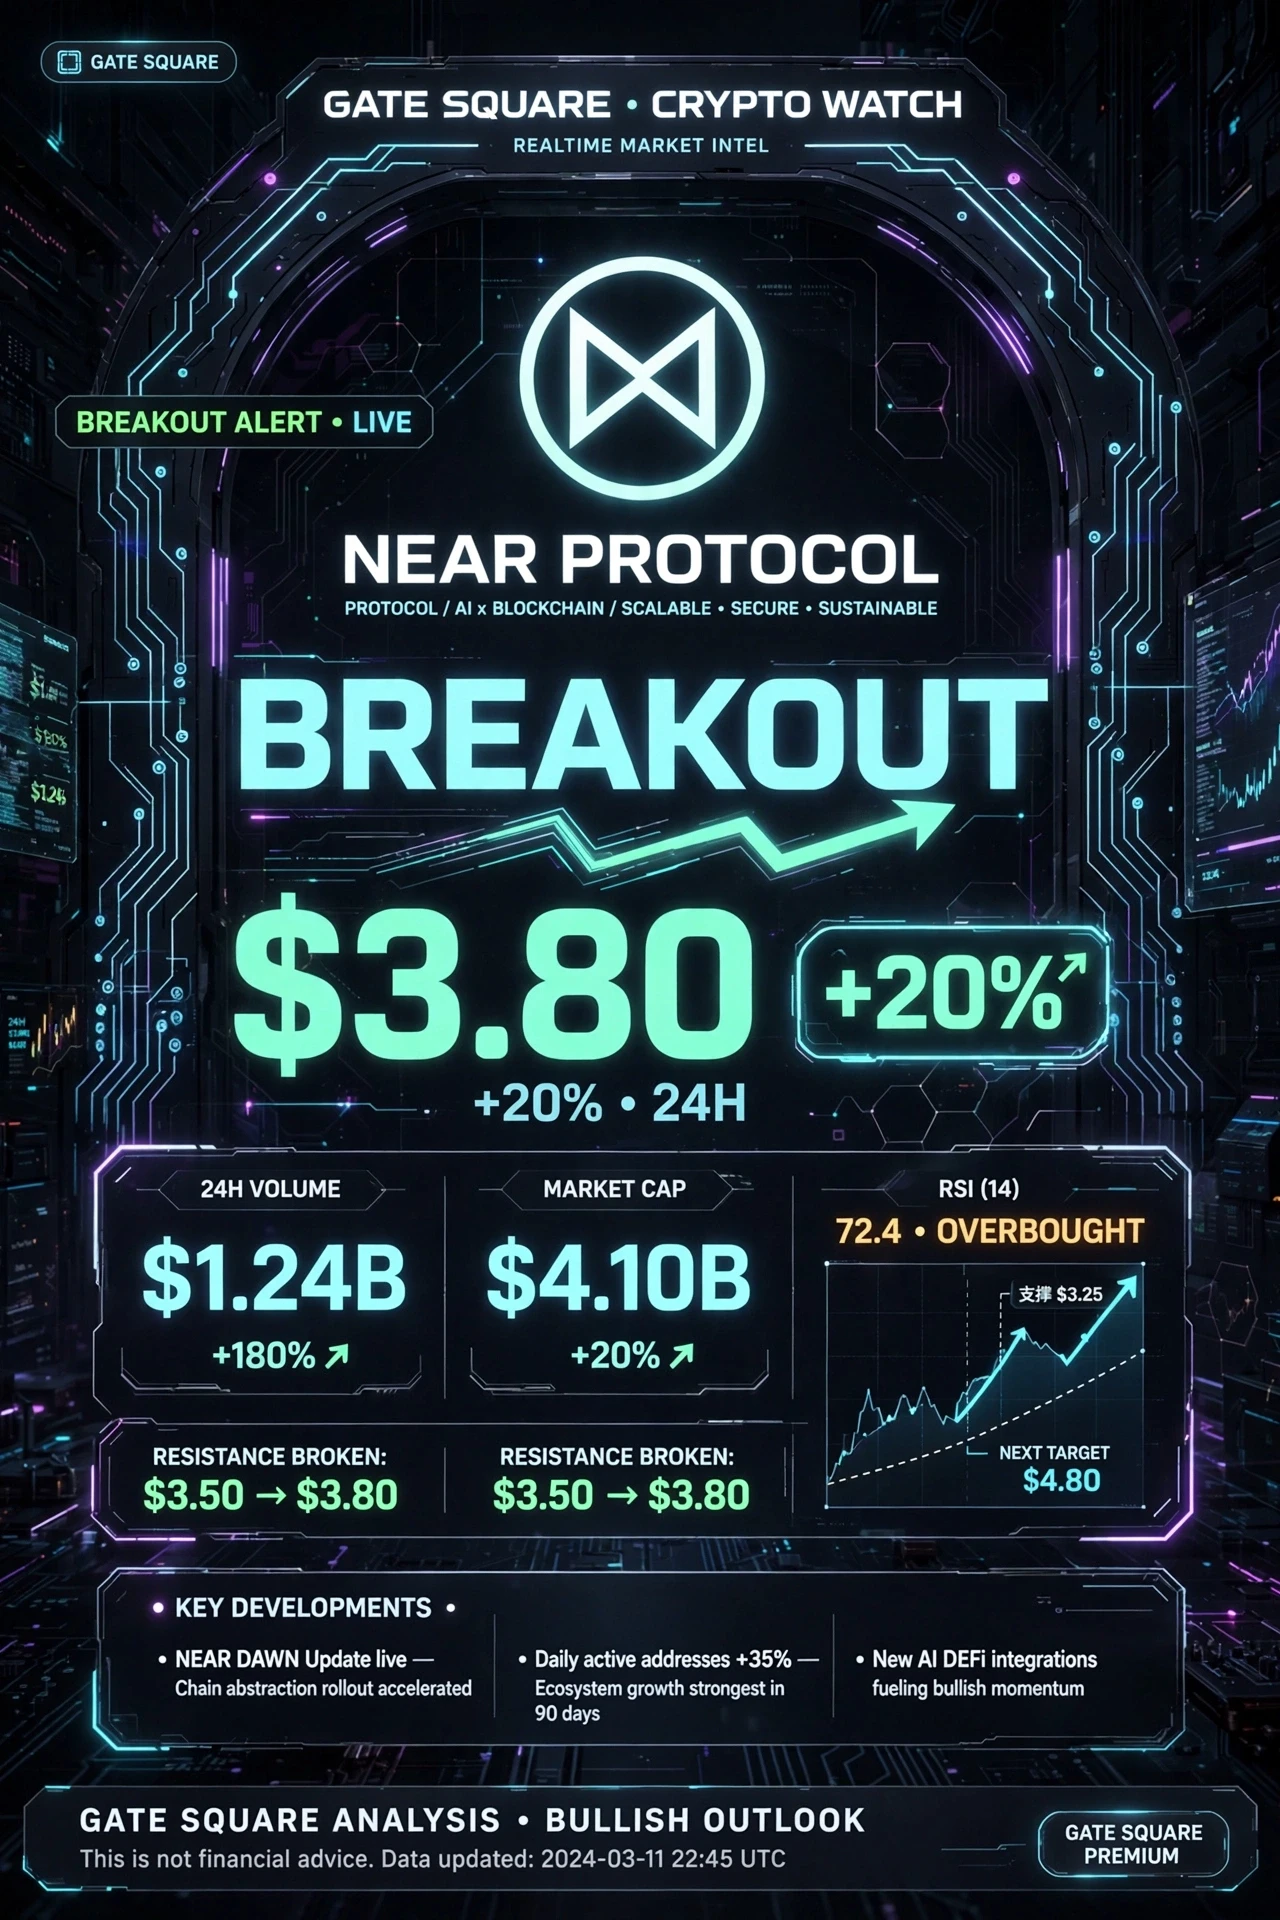
NEAR has suddenly moved from a recovery story into one of the market’s strongest momentum narratives. After gaining more than 20% in a single day and pushing toward the $3.90 area, NEAR decisively reclaimed the psychological $3 level and reached a roughly one-year high. What makes this move particularly interesting is that it is not being driven by a single headline alone. Confidential perpetual futures, the NEAR 3.33 incentive mechanism, record NEAR Intents activity, improving institutional and regulatory narratives, and a broader recovery across crypto are all combining around the same price structure.
LIVE MARKET SNAPSHOT
NEAR is trading around the $3.68–$3.91 region in the latest market data, after moving through a session range near $2.99–$3.91. The documented 24-hour gain has been around +20.8%, with the strongest part of the move reaching roughly +30%. Seven-day performance is around +38% to +46%, while the 30-day advance has reached roughly +120%. Market capitalization is around $4.8B–$5.1B, with 24-hour trading volume around $1.8B–$2.2B. Compared with NEAR’s January 2022 all-time high near $20.44, the token remains roughly 80% below its historical peak, which shows both the scale of the previous drawdown and the potential distance still separating the current price from the old cycle high.
WHY IS NEAR MOVING SO FAST?
The first major catalyst is the launch of confidential perpetual futures on September 17. Built using Hyperliquid infrastructure, the product introduces privacy-focused perpetual trading with more than 50 markets and leverage of up to 40x. The importance is not simply the existence of another derivatives product; it strengthens NEAR’s broader positioning around privacy, chain abstraction and confidential financial activity.
The second catalyst is the NEAR@3.33 mechanism. Confidential Intents TVL crossed approximately $70M, triggering a 333,333-token snapshot mechanism. The important condition is that the tokens convert 1:1 only if NEAR maintains a three-day VWAP at or above $3.33. This creates a measurable market level rather than a purely narrative target. Traders therefore have a specific zone to monitor around $3.33, because sustained acceptance above that level has both technical and ecosystem significance.
NEAR Intents activity is another major part of the story. Daily volume reached approximately $303M, around 2.4 times the previous seven-day average, while lifetime volume moved above $29.5B. When price appreciation occurs alongside a significant increase in actual network activity, the market has more evidence to evaluate than price alone. It does not guarantee that the rally will continue, but it strengthens the fundamental narrative behind the move.
The broader market environment is also helping. A more constructive regulatory environment around tokenized US equities and increasing institutional interest in on-chain financial products fit naturally with NEAR’s focus on chain abstraction, interoperability and private financial infrastructure. At the same time, the upcoming SPICE upgrade is being developed with the objective of improving network performance, while the wider altcoin market has benefited from renewed risk appetite.
TECHNICAL STRUCTURE — STRONG BUT EXTENDED
The technical picture is powerful, but it is also flashing an important warning. Daily RSI is around 77, placing NEAR firmly in overbought territory. Weekly RSI is also above 70, showing the strength of the current demand while simultaneously increasing the probability of short-term cooling or consolidation. On shorter timeframes, RSI remains elevated, Stoch RSI is strong, MACD remains bullish and ADX is rising.
NEAR is trading above its major short- and medium-term moving averages, including the 10-day, 50-day, 100-day and 200-day structures. More importantly, the token has reclaimed the 200-week moving average around the $3 area. That makes the move more significant than a simple one-day pump because the market is now testing a major long-term technical structure.
However, volatility has expanded dramatically. With ATR around 7% of price, daily moves of several tens of cents should not be surprising. A $0.25–$0.40 move can occur quickly in either direction, particularly when leverage is high. This is why position size becomes more important as volatility increases.
THE KEY LEVELS I AM WATCHING
The $3.00–$3.10 region is now the first major breakout zone. If former resistance continues acting as support, the breakout structure remains constructive. Above that, $3.18–$3.19 becomes another important short-term level, while $3.33 is arguably the most significant level because of the NEAR@3.33 VWAP mechanism.
Around $3.80–$3.91 is the immediate momentum zone and current local-high area. A clean move through $4.00 would be psychologically important and could open the way toward approximately $4.20. Above that, $4.32–$4.67 becomes a larger supply and extension zone, followed by the broader psychological areas around $5 and potentially $7 if the long-term trend continues to expand.
On the downside, losing $3.33 would weaken the immediate momentum structure, while a break below $3.19 would increase the probability of a deeper retest toward $3.00–$3.10. A decisive daily breakdown below approximately $2.80 would significantly weaken the breakout thesis and could expose $2.60 and then $2.40.
THE THREE MARKET SCENARIOS
In a bullish continuation scenario, NEAR holds above $3.33, buyers absorb profit-taking and price eventually produces a strong daily close above $4.00 with expanding real volume. That would put $4.20 into focus, followed by the $4.60–$5.00 region. Longer-term market participants may continue discussing $7 and higher levels, but those require substantially more liquidity and confirmation and should not be treated as immediate targets.
In a consolidation scenario, NEAR trades between approximately $3.33 and $4.00 while RSI cools and the market absorbs the recent +120% monthly advance. This would not automatically represent weakness. After a vertical move, sideways consolidation can allow momentum indicators to reset without destroying the broader breakout structure.
In a bearish scenario, NEAR loses $3.33 and then $3.19 with increasing selling volume. That could send price back toward $3.00 and potentially $2.80. A deeper breakdown below $2.80 could expose $2.60–$2.40. The possibility of a retracement should not be surprising because part of the explosive move was associated with short covering, including a major reduction in open interest during the strongest candle.
TRADING PLAN
The key lesson here is simple: do not confuse momentum with unlimited upside. With daily RSI around 77 and NEAR already up roughly 120% over 30 days, chasing a vertical candle can create poor risk-to-reward conditions.
The more structured approach is to watch how price behaves around $3.33–$3.19. If buyers defend this area and volume confirms renewed demand, the market can potentially attempt another move toward $3.80–$4.00. A continuation setup becomes more interesting if NEAR produces a confirmed daily close above $4.00 with meaningful volume, because that would demonstrate that buyers are willing to accept prices above the psychological breakout level.
For leveraged traders, caution becomes even more important. With ATR near 7% and perpetual leverage available as high as 40x, relatively small adverse moves can create significant losses. Position size should therefore be reduced as volatility increases, and stops should be based on market structure rather than arbitrary tight distances. Scaling rather than entering one oversized position can also reduce the impact of short-term volatility.
WHAT I WOULD WATCH NEXT
The most important confirmation is whether NEAR can maintain the $3.33 area during the required VWAP period. I would also watch whether open interest expands together with price in an orderly way or whether leverage rises much faster than spot demand. Funding conditions, liquidation data, NEAR Intents volume, BTC dominance and total crypto-market liquidity are also important because NEAR does not trade in isolation.
The market sentiment remains strongly constructive, but the combination of elevated RSI, extreme monthly performance and increased volatility means the next phase could be very different from the previous one. The strongest signal would not simply be another green candle; it would be NEAR holding the breakout zone after profit-taking and then producing another expansion with genuine volume.
FINAL VIEW
NEAR’s move above $3 is significant because several narratives are converging at the same time: a live confidential-perpetual product, the NEAR@3.33 incentive mechanism, record Intents activity, improving infrastructure and a broader recovery in crypto risk appetite. Technically, the reclaim of major moving averages and the 200-week structure adds another layer to the breakout story.
But this is also an extended market. Daily RSI near 77, weekly RSI above 70, approximately +120% monthly performance and evidence of short covering all argue for respecting the possibility of consolidation or a sharp shakeout. The strongest setup is therefore not simply “NEAR goes higher”; it is whether the market can transform the $3 breakout into sustainable support.
For my roadmap, $3.33 is the key momentum level, $3.19 is the next structural checkpoint, $3.00–$3.10 is the broader breakout zone, and $2.80 is the major invalidation area. On the upside, $4.00 is the next major psychological test, followed by $4.20 and the $4.60–$5.00 region if momentum remains strong.
repost-content-media
#Gate24HFuturesOpenInterestTops$11.479B Gate’s Futures Open Interest Crosses $11.479B: A Strong Signal of Trust, Liquidity and Market Participation
Gate continues to prove that serious traders are paying attention. The latest futures market data shows Gate’s open interest around $11.479 billion, placing the exchange among the world’s leading centralized exchanges by derivatives activity. For me, this is much more than a headline number. It is a market signal: capital is being deployed, positions are staying active, and traders are increasingly comfortable using Gate as a venue for sophisticate
HighAmbition
#Gate24HFuturesOpenInterestTops$11.479B Gate’s Futures Open Interest Crosses $11.479B: A Strong Signal of Trust, Liquidity and Market Participation
Gate continues to prove that serious traders are paying attention. The latest futures market data shows Gate’s open interest around $11.479 billion, placing the exchange among the world’s leading centralized exchanges by derivatives activity. For me, this is much more than a headline number. It is a market signal: capital is being deployed, positions are staying active, and traders are increasingly comfortable using Gate as a venue for sophisticated futures strategies.
First, let us understand what $11.479 billion of open interest actually means. Open interest represents the total value of futures positions that remain open rather than already being closed or settled. It is therefore different from trading volume. Volume measures how much trading happens during a period, while open interest shows how much positioning remains active in the market. When both activity and open positions are substantial, the market is telling us that participation is not merely a short burst of transactions. Traders are maintaining exposure and using the derivatives market continuously.
That distinction matters. A large open-interest figure should never be interpreted as automatically bullish or bearish. It does not tell us whether traders are predominantly long or short, and it does not guarantee that prices will rise. Instead, it tells us that there is substantial participation and capital committed to open positions. In my view, that is exactly why Gate’s $11.479B milestone deserves attention.
What impresses me most is the scale. Eleven billion dollars is not a small figure. It places Gate’s futures market firmly in the conversation with the largest global trading venues. Current third-party market data also shows Gate with roughly $18.47B in 24-hour futures volume alongside about $11.47B of open interest. That combination is important because it shows both active turnover and a large pool of outstanding positions. Liquidity and participation are becoming major competitive advantages in derivatives, and Gate is building meaningful strength on both fronts.
The numbers become even more interesting when we look at individual markets. Current data tracks close to 1,000 perpetual futures markets on Gate. BTC remains a major contributor, with roughly $4.91B in open interest, while ETH is another major source of activity with around $3.04B of open interest and approximately $1.99B in 24-hour volume. SOL is also active, with about $742.84M in open interest and roughly $249.77M in 24-hour volume. These figures show that Gate is not depending on a single contract. It is supporting meaningful participation across major crypto assets and a growing range of markets.
For me, this breadth is one of Gate’s strongest advantages. Traders do not only want one popular BTC contract. They want access to ETH, SOL, XRP, BNB, DOGE and many other markets, while increasingly looking at RWA-linked and equity-related perpetual products as well. Gate’s ability to expand its derivatives universe means traders can respond to different market conditions without constantly changing platforms.
The RWA story is particularly impressive. Recent Gate data reported that its RWA perpetual futures volume reached $64.7B in August, up 158% month over month, while its market share increased from 5.32% to 12.6%. That is a remarkable acceleration. In my opinion, this is where Gate’s broader strategy becomes visible: the exchange is not simply trying to compete for existing crypto futures activity; it is also positioning itself around the next generation of multi-asset derivatives.
This matters because the future of trading will increasingly connect crypto, equities, commodities, indices and real-world assets. Gate’s expansion into these areas gives traders more flexibility and creates a stronger ecosystem around the platform. When a platform can provide deep markets, diverse instruments and active derivatives participation in one place, its usefulness rises substantially.
I also see the $11.479B open-interest level as a trust signal, although it should not be confused with a guarantee of safety or profit. Traders generally do not maintain large amounts of active exposure on a platform unless they consider its infrastructure useful for their strategy. High open interest therefore reflects a combination of market participation, available products, execution needs and trader confidence. The fact that Gate is attracting this level of positioning tells me that the exchange has earned an increasingly important place in the derivatives landscape.
Gate’s transparency efforts strengthen that impression. Its recent August transparency report showed approximately $8.215B in reserves and an overall reserve ratio of 127%, while 30-day net inflows were reported at about $308.1M. To me, these figures are meaningful because trust in an exchange is built from more than trading screens. Users want to know that the platform is taking custody, liquidity and reserves seriously. Transparency does not remove market risk, but it can improve confidence when users evaluate where to trade.
The liquidity question is equally important. A futures platform can list hundreds of contracts, but the real test is whether traders can enter and exit positions efficiently. High 24-hour volume, substantial open interest and active markets together create a stronger environment for execution. Gate’s reported $18.47B in 24-hour futures volume and $11.47B of open interest indicate that the platform has developed considerable derivatives activity. For traders, that matters because liquidity can influence spreads, execution quality and the ability to manage positions during fast-moving markets.
My view is that Gate is moving from being simply another crypto exchange toward becoming a serious multi-asset trading ecosystem. The growth of futures, RWA perpetuals, stock-related contracts and broader financial products supports that direction. The exchange is competing not only through the number of listings, but through market depth, product diversity and the ability to attract sustained trading activity.
There is another important point: open interest can become especially informative during volatile periods. If BTC moves sharply and open interest rises at the same time, it may indicate that traders are adding new exposure. If price rises while open interest falls, the move can instead be associated with position closures or short covering. If price falls while open interest rises, new positions may be entering on the bearish side.
Therefore, I would never analyze Gate’s $11.479B figure in isolation. I would combine it with price action, funding rates, long/short ratios, liquidation data, volume and market structure.
For BTC, for example, current Gate market data places open interest around $4.91B. That is a huge portion of Gate’s overall futures positioning, which makes BTC a key market to monitor. ETH also deserves close attention because its futures activity is substantial, with around $1.99B in 24-hour volume and roughly $3.04B in open interest in the latest available data. When BTC and ETH liquidity remain strong, they can provide the foundation for broader derivatives activity across altcoins.
Altcoins bring a different opportunity and a different risk profile. SOL, XRP, DOGE, BNB and other contracts can experience much larger percentage moves than BTC. High liquidity can help traders execute strategies, but leverage can amplify both gains and losses. That is why I believe Gate’s strongest feature is not simply that it offers futures; it is that traders can use market data to make more informed decisions.
My personal analysis is straightforward: Gate’s $11.479B open-interest milestone is a strong vote of confidence from market participants. It shows that Gate is attracting serious derivatives activity, while its broader RWA and multi-asset expansion suggests that the exchange is preparing for a much larger role in global trading.
I particularly like the way Gate is combining established crypto markets with newer financial products. The 158% month-over-month growth in RWA perpetual volume is not ordinary growth. Moving from 5.32% to 12.6% market share in one month shows that Gate is gaining ground rapidly in an emerging category. If this momentum continues, Gate could strengthen its position even further as traders search for platforms capable of supporting both crypto-native and traditional-asset-linked strategies.
There is also a psychological element behind these numbers. Traders have choices. They can move between major exchanges, compare liquidity, evaluate fees, monitor execution and choose where to keep their active positions. When an exchange consistently attracts billions of dollars in open interest and billions more in daily futures volume, that choice becomes meaningful. In my opinion, Gate is increasingly becoming a platform that traders are choosing because it offers a combination of liquidity, product variety, infrastructure and a growing reputation.
For me, Gate’s progress is not only about ranking among the top three global CEXs. The bigger story is the trajectory. The platform is expanding its derivatives footprint, strengthening RWA markets, increasing product diversity and attracting substantial capital participation. That combination can create a powerful network effect: more products attract more traders, more traders generate more volume, deeper markets improve liquidity, and better liquidity makes the platform more attractive to additional participants.
My conclusion is bullish on Gate’s growth. $11.479B in open interest matters, but the bigger story is the ecosystem behind it: approximately $18.47B in 24-hour futures volume, around $11.47B in open interest, close to 1,000 tracked perpetual markets, strong BTC and ETH participation, and growing RWA derivatives. For me, these numbers show growing trader confidence in Gate’s liquidity. High open interest is not automatically bullish, so I would combine it with price action and volume. Still, Gate’s trajectory is impressive.#ShareWeekly #weeklyshare
repost-content-media
#BTCUSDT
BTC/USDT Near $78K: Bitcoin Is Consolidating — The Next Break Could Matter
$BTC ‌
«Bitcoin is trading around the $78,000 area after a sharp rejection from above $81K. Price has stabilized near the lower part of the recent range, but the short-term structure remains undecided. For traders, this is a zone where confirmation matters more than prediction.»
Bitcoin’s recent price action has been anything but quiet.
On August 28, BTC traded as high as roughly $81,300 before falling toward the $77,000 area. Since then, price has recovered and stabilized around $78K. Recent market data also
2In1
#BTCUSDT
BTC/USDT Near $78K: Bitcoin Is Consolidating — The Next Break Could Matter
$BTC ‌
«Bitcoin is trading around the $78,000 area after a sharp rejection from above $81K. Price has stabilized near the lower part of the recent range, but the short-term structure remains undecided. For traders, this is a zone where confirmation matters more than prediction.»
Bitcoin’s recent price action has been anything but quiet.
On August 28, BTC traded as high as roughly $81,300 before falling toward the $77,000 area. Since then, price has recovered and stabilized around $78K. Recent market data also shows BTC continuing to trade close to this psychological level.
That creates the key question:
Is Bitcoin building a base for another move higher, or is this simply a temporary recovery after the sell-off?
At the moment, the chart does not provide enough confirmation to confidently choose either scenario.
$78K Is the Immediate Battlefield
The $78,000 area is currently an important short-term psychological zone.
However, simply trading above $78K does not automatically confirm a bullish breakout.
For bulls, the first signal I would watch is a sustained move through the $78,300–$78,500 area, followed by a successful retest.
If that happens, the next levels become:
$79,000 → $80,000 → $80,300 → $81,300–$81,500
The $80,000 level is particularly important because it is both psychological resistance and close to the recent reaction zone.
A sustained move above $80K could improve short-term momentum and bring the recent $81K+ area back into focus.
But confirmation is essential.
What If BTC Loses $77,500?
The bearish setup becomes more interesting if Bitcoin loses the lower part of the current range.
The first level to watch is approximately:
$77,500
Below that, the next chart-based support area is around:
$76,700–$77,000
This zone is important because the recent sell-off found buyers around the mid-to-upper $76K area.
If BTC loses this region with strong momentum and fails to reclaim it, downside pressure could increase.
The next major chart reference would then be around:
$75,500–$75,600
A confirmed breakdown below that area would weaken the short-term recovery structure considerably.
So instead of asking:
“Will Bitcoin go up or down?”
A better question may be:
“Which important level breaks first?”
That is where the market could provide a clearer signal.
RSI Shows a Mixed Picture
The 4-hour RSI readings shown on the Gate chart are also worth monitoring:
RSI(6): ~42.5
RSI(12): ~45.7
RSI(24): ~53.9
The shorter-period RSI readings are below 50, suggesting that short-term momentum has not yet returned to strong bullish territory.
At the same time, the longer-period RSI remains above 50, which suggests the broader momentum picture is not decisively bearish.
In simple terms:
Short-term momentum: cautious
Broader momentum: neutral to slightly constructive
That combination supports a wait-for-confirmation approach rather than chasing the market in the middle of the range.
The Bigger Picture Still Matters
Bitcoin does not move based on technical levels alone.
Macro expectations, liquidity, institutional flows, ETF activity, derivatives positioning, funding rates, open interest and liquidations can all influence short-term volatility.
Gate provides market-data tools that allow traders to monitor areas such as liquidations and other market activity. Its current BTC liquidation page also shows that leveraged positions can be affected quickly when volatility increases.
This is important because BTC has recently demonstrated how quickly the market can move.
The August 28 session is a good example: Bitcoin moved from above $81K to below $77K before stabilizing.
That type of volatility can punish traders who enter without a defined invalidation level.
My BTC/USDT Key Levels
Current area: ~$78K
Immediate resistance: $78,300–$78,500
Resistance: $79,000
Major psychological resistance: $80,000
Next resistance: ~$80,300
Major upside reference: $81,300–$81,500
Immediate support: ~$77,500
Lower support: $76,700–$77,000
Major chart-based support: ~$75,500–$75,600
These are reference zones, not guaranteed reversal points.
What Would Make the Setup More Bullish?
A stronger bullish scenario would look like:
BTC holds $78K → breaks $78.5K → confirms the breakout → successfully retests the zone → targets $79K and $80K.
A sustained move above $80K would make the recent $81K–$81.5K area increasingly important.
The key word is sustained.
A quick wick above resistance is not the same as a confirmed breakout.
What Would Make the Setup More Bearish?
The bearish scenario becomes stronger if:
BTC loses $77.5K → fails to reclaim it → breaks the $76.7K–$77K zone → sellers maintain control on the 4-hour structure.
If that happens, $75.5K–$75.6K becomes an important downside reference.
A confirmed break below that area could significantly change the short-term structure.
Don't Let Leverage Decide Your Trade
If the Gate interface shows a 20x leverage option, remember that the availability of leverage does not make a setup stronger.
Higher leverage simply increases the speed at which both gains and losses can develop.
This is especially important while BTC is moving between major support and resistance.
A disciplined approach is:
Define the invalidation level first.
Calculate position size second.
Choose leverage last.
Not the other way around.
Final View
Bitcoin around $78K is sitting at an important technical decision zone.
The recent move from above $81K toward the $77K area showed that sellers are still capable of producing aggressive volatility. At the same time, BTC has recovered and is holding around $78K rather than immediately continuing lower.
For me, the levels are straightforward:
Above $78.5K: short-term bullish momentum could strengthen.
Above $80K: the setup becomes considerably more interesting.
Above $81K–$81.5K: a larger bullish confirmation would develop.
Below $77.5K: downside pressure could increase.
Below $76.7K–$77K: bears could gain greater short-term control.
Around $75.5K–$75.6K: major chart-based support comes into focus.
Until one of these zones breaks with confirmation, I would treat BTC as being inside a volatile consolidation range rather than blindly predicting the next move.
The market does not reward confidence without evidence.
It rewards preparation.
Watch the levels. Wait for confirmation. Manage risk. Then make the decision.
You can also monitor BTC, ETH, altcoins, spot markets, futures and other crypto market data through Gate’s trading and market-data tools.
This analysis is for educational purposes only and is not financial advice. Cryptocurrency trading involves significant risk, and traders should make decisions based on their own risk tolerance, position size and strategy.
#TopFiveLeaguesPreMatchPredictor
@Gate_Square
repost-content-media
BTC-0.04%
ETH+0.58%
  • 5
#GTUSDTUPDATE
GT/USDT: $8.09 — A Quiet Move That Could Become a Bigger One

$GT ‌
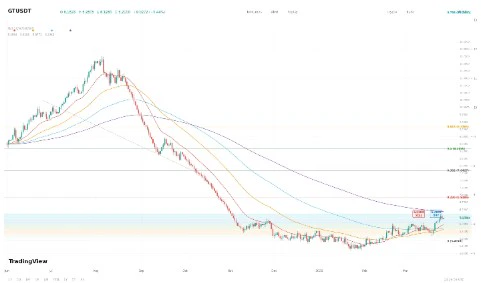
> GT/USDT is currently trading around $8.09, up 2.41% on the day, with the chart showing a market that is recovering from lower levels but is still facing an important resistance zone. The key question now is simple: can GT turn the $8.20–$8.27 area into support, or will sellers step in again?
Looking at the 4-hour chart, GT has been moving through a wide range rather than following a clean one-direction trend.
The recent structure shows repeated attempts to move higher, followed by periods of selling. Price ha
2In1
#GTUSDTUPDATE
GT/USDT: $8.09 — A Quiet Move That Could Become a Bigger One

$GT ‌
> GT/USDT is currently trading around $8.09, up 2.41% on the day, with the chart showing a market that is recovering from lower levels but is still facing an important resistance zone. The key question now is simple: can GT turn the $8.20–$8.27 area into support, or will sellers step in again?
Looking at the 4-hour chart, GT has been moving through a wide range rather than following a clean one-direction trend.
The recent structure shows repeated attempts to move higher, followed by periods of selling. Price has already moved away from the lower area around $7.63, and the recovery toward $8.21–$8.27 shows that buyers are still active.
But this is also the area where the market needs confirmation.
At the moment, $8.09 is the price that matters most for understanding the short-term structure.
If GT can remain above $8.00 and gradually push toward $8.20, the chart could start looking stronger.
If buyers manage to break and hold above $8.27, the next important area visible on the chart is around $8.43.
On the other hand, if GT fails to hold $8.00, the market could return toward the lower support areas.
That makes the current zone interesting for traders and content creators watching GT closely.
GT/USDT PRICE STRUCTURE
Current Price: $8.09
24H Change: +2.41%
24H High: $8.27
24H Low: $7.90
The first thing I would watch is the relationship between $8.00 and $8.27.
Right now, GT is sitting almost in the middle of that short-term range.
That means there is no reason to blindly assume that the next move must be upward.
The better approach is to watch what price does at the important levels.
$8.00 is becoming an important psychological area.
Above $8.00, buyers have room to challenge:
$8.21
then
$8.27
and after a confirmed breakout:
$8.43
But below $8.00, attention should shift toward:
$7.90
$7.77
and the stronger lower zone around:
$7.63
These levels create a much clearer map than simply saying “GT is bullish” or “GT is bearish.”
WHY $8.20–$8.27 MATTERS
The chart clearly shows that GT has previously faced selling pressure around the $8.20+ region.
Price reached approximately $8.21–$8.27, but the candles that followed showed rejection and a move back toward $8.09.
This tells us something important.
Buyers are present, but sellers are also defending the upper area.
For GT to develop stronger short-term momentum, the market needs to do more than touch $8.27.
A stronger signal would be:
Break $8.27 → hold above $8.27 → build support → continue higher
That type of movement would be more convincing than a quick spike above resistance followed by an immediate rejection.
If that confirmation appears, $8.43 becomes an important next reference level on this chart.
But if price repeatedly fails around $8.20–$8.27, traders should respect that resistance instead of chasing every green candle.
THE $8.00 LEVEL
Sometimes the most important level is not the highest resistance.
It is the level that decides whether the current recovery remains healthy.
For GT, $8.00 is exactly that kind of area.
The current price of $8.09 means GT is only slightly above this psychological level.
A clean hold above $8.00 would keep the short-term recovery structure alive.
If buyers continue defending $8.00, the market can attempt another move toward:
$8.21
$8.27
and potentially:
$8.43
But if $8.00 is lost with strong selling pressure, the situation changes.
Then the market could test $7.90 first.
A deeper pullback could bring $7.77 into focus.
And if the selling becomes much stronger, the chart shows the previous low around $7.63 as another important area.
So, for me, the immediate battle is not complicated:
Above $8.00 = buyers still have a chance
Below $8.00 = caution increases
RSI IS NOT SHOWING EXTREME CONDITIONS
The 4-hour chart also gives us RSI readings around:
RSI 6: 54.02
RSI 12: 54.50
RSI 24: 56.34
This is an interesting position.
The RSI is above the middle area but nowhere near an extreme overbought reading.
That means the chart does not currently show the kind of RSI condition where we can simply say that buyers have pushed the market too far.
At the same time, RSI around the mid-50s is not enough by itself to confirm a major bullish breakout.
It simply tells us that momentum is currently somewhat positive.
The real confirmation still needs to come from price.
If GT breaks $8.27 while momentum remains strong, the RSI structure could support the move.
If price gets rejected again while RSI starts weakening, that would increase the possibility of another pullback.
This is why combining price levels with momentum is much better than using one indicator alone.
THE BIGGER PICTURE
One of the most interesting parts of this chart is the performance across different time periods.
The screenshot shows:
Today: -1.58%
7 Days: +4.93%
30 Days: +23.89%
90 Days: +15.74%
180 Days: +16.40%
1 Year: -52.37%
This tells a much bigger story.
GT has shown meaningful recovery across the shorter and medium-term periods.
The 30-day performance of +23.89% is particularly important because it shows that the token has gained significant ground over the past month.
But the 1-year performance of -52.37% also reminds us that the longer-term picture is still very different.
This is exactly why traders should avoid looking at only one timeframe.
A coin can be recovering strongly over 30 days while still being far below its previous yearly levels.
Both things can be true at the same time.
$10.14 AVERAGE PRICE — AN IMPORTANT LONGER-TERM REFERENCE
Another number visible on the chart is the average price around:
$10.14
Compared with the current price of $8.09, this area is still significantly higher.
That means GT has a much larger challenge if the market eventually attempts to return toward the $10+ region.
But before thinking about $10.14, the market has several levels to clear.
First:
$8.21
Then:
$8.27
Then:
$8.43
After that, traders can start watching whether momentum is strong enough to create a broader recovery toward higher zones.
The important lesson is simple:
Don't jump directly from $8.09 to a huge target.
Let the chart prove each level one by one.
BULLISH SCENARIO
The bullish setup becomes more interesting if GT continues holding above $8.00.
A possible structure would look like this:
$8.09 → $8.21 → $8.27 → $8.43
The first major confirmation would be a strong move above $8.27.
If price breaks that level and then successfully holds it instead of falling straight back below, buyers could gain additional confidence.
In that situation, $8.43 becomes the next visible resistance area.
A clean move through $8.43 would improve the overall short-term structure even further.
But this is a scenario, not a guarantee.
Crypto markets can reverse quickly, especially when resistance is being tested.
BEARISH SCENARIO
The bearish side of the chart should not be ignored.
If GT repeatedly fails near:
$8.21–$8.27
and then loses:
$8.00
the recovery could lose momentum.
The first area to watch would then be:
$7.90
If that level fails, the next visible support is around:
$7.77
And below that:
$7.63
The $7.63 region is particularly important because it represents the lower point visible in the recent chart structure.
A move back toward that area would mean that the recent recovery has been seriously weakened.
So the market currently has a clear decision zone.
Hold $8.00 → attempt higher
Lose $8.00 → watch $7.90 and $7.77
Break $7.77 → $7.63 becomes important
WHAT I WOULD WATCH NEXT
For the next few 4-hour candles, I would focus on five things.
1. $8.00
Does GT continue to defend this level?
2. $8.21
Can buyers push through the first major resistance?
3. $8.27
Can GT break the recent 24-hour high and stay above it?
4. $8.43
If $8.27 breaks, does momentum continue toward this next visible resistance?
5. $7.77–$7.63
If sellers take control, these are the important lower areas to monitor.
This gives us a much more practical way to read the chart.
Instead of predicting every candle, we simply wait for the market to show its hand.
FOR CONTENT CREATORS
For content creators, GT is an interesting chart because it currently has a clear story.
There is a recovery from the lower $7.63 area.
There is current trading around $8.09.
There is resistance around $8.21–$8.27.
There is another visible level near $8.43.
And there is a clear psychological battle around $8.00.
That gives creators enough information to build a meaningful market discussion without making unrealistic promises.
The strongest crypto content is not about telling people that a coin “must pump.”
It is about explaining what the chart is saying.
Right now, the chart is saying that GT has recovered, but it still needs confirmation above the upper resistance zone.
That distinction matters.
A breakout is only useful when it can hold.
A green candle is not automatically a trend.
And a resistance level should not be ignored simply because the overall market looks positive.
MY GT/USDT WATCHLIST
Current: $8.09
Immediate psychological level: $8.00
Support: $7.90
Major support: $7.77
Strong lower support: $7.63
Resistance: $8.21
Major resistance: $8.27
Next resistance: $8.43
Average price shown: $10.14
The most important area right now remains:
$8.00–$8.27
A sustained move above $8.27 would improve the short-term picture.
A rejection from $8.21–$8.27 followed by a break below $8.00 would make the chart much more cautious.
That is the balance I see from the current 4-hour structure.
FINAL VIEW
GT is not sitting in a meaningless zone.
At $8.09, the market is close enough to both support and resistance that the next few candles could provide useful information.
The positive side is that GT is above $8.00, the RSI readings are around the mid-50s, and the recent monthly performance shown on the chart is +23.89%.
The cautious side is that price has already faced rejection around $8.20–$8.27, while the longer-term one-year performance shown is still -52.37%.
So I would not treat $8.09 as a guaranteed breakout price.
I would treat it as a decision area.
Above $8.00 → watch $8.21
Above $8.21 → watch $8.27
Above $8.27 → watch $8.43
Below $8.00 → watch $7.90
Below $7.90 → watch $7.77
Below $7.77 → watch $7.63
That is the map.
The market does not need our prediction.
It will give us confirmation through price action.
For traders and content creators, the best approach is to stay patient, respect the levels, and avoid turning a possible setup into a guaranteed outcome.
GT at $8.09 is at a level worth watching — now the question is whether buyers can finally take control above $8.27.
#TopFiveLeaguesPreMatchPredictor
@Gate_Square
repost-content-media
  • 5
#ETHUSDT:
$2,466 — Ethereum Is Standing at a Very Important Price Zone
> ETH/USDT is trading around $2,466, with Ethereum currently holding above the $2,400 area. The market is showing renewed strength, but the real test is now approaching: can ETH break and hold above $2,500, or will sellers once again defend the upper zone?
Ethereum is currently moving around $2,466, and this is not a level I would ignore.
The latest market data places ETH around the $2,450–$2,470 region, with the broader market also showing positive short-term momentum.
For content creators and traders, the interesting pa
2In1
#ETHUSDT:
$2,466 — Ethereum Is Standing at a Very Important Price Zone
> ETH/USDT is trading around $2,466, with Ethereum currently holding above the $2,400 area. The market is showing renewed strength, but the real test is now approaching: can ETH break and hold above $2,500, or will sellers once again defend the upper zone?
Ethereum is currently moving around $2,466, and this is not a level I would ignore.
The latest market data places ETH around the $2,450–$2,470 region, with the broader market also showing positive short-term momentum.
For content creators and traders, the interesting part is not simply that ETH is green.
The interesting part is where ETH is trading.
Right now, Ethereum is sitting between an important support area near $2,400 and a major psychological resistance around $2,500.
That gives us a very clear map.
$2,400 → support
$2,450 → short-term decision area
$2,466 → current zone
$2,500 → major resistance
$2,600 → next upside area
$2,700 → stronger resistance zone
The next major move could depend heavily on how ETH behaves around these levels.
---
ETH/USDT AT $2,466
Ethereum has already shown that buyers are willing to defend the lower levels.
The current price around $2,466 means ETH is trading above $2,400, which is important from a psychological and technical perspective.
But there is still one major obstacle.
$2,500.
Round numbers often attract both buyers and sellers, and $2,500 is exactly the kind of level where market participants may become more aggressive.
If ETH reaches $2,500 and immediately gets rejected, we could see another pullback toward $2,450 or even $2,400.
But if ETH breaks above $2,500 and actually holds that level, the structure becomes much more interesting.
The next areas I would watch would be:
$2,550
$2,600
and potentially:
$2,700
The important word here is confirmation.
A quick move above $2,500 is not enough.
A stronger setup would be:
$2,500 break → hold $2,500 → build support → continue higher
That would show that buyers are doing more than simply creating a temporary price spike.
---
THE $2,400 LEVEL
For me, $2,400 is one of the most important levels on the current ETH map.
Why?
Because the difference between trading comfortably above $2,400 and falling back below it could change the short-term sentiment.
As long as ETH continues to defend the $2,400 region, buyers have a reasonable opportunity to challenge higher levels.
The structure would then look like:
$2,400
↓
$2,450
↓
$2,500
↓
$2,600
But if ETH loses $2,400 with strong selling pressure, the market could start looking for lower support.
The next important areas would then be around:
$2,350
$2,300
and below that:
$2,200
This is why I would not focus only on the upside.
A good market analysis must always explain both sides.
$2,500 IS THE REAL TEST
Ethereum is currently close to the $2,500 psychological level.
This is where the market could become much more interesting.
If buyers push ETH through $2,500, the first question should not be:
“How high can ETH go?”
The first question should be:
“Can ETH stay above $2,500?”
That distinction is extremely important.
Crypto markets often produce fast breakouts that look impressive for a few minutes or hours before price falls back into the previous range.
A sustainable breakout normally needs follow-through.
If ETH moves:
$2,466 → $2,500 → $2,550
and continues holding the higher levels, buyers could gain more confidence.
But if ETH moves:
$2,466 → $2,500 → rejection → $2,450
then the breakout attempt has not yet been confirmed.
That is why chasing the first green candle can be dangerous.
Patience is often more valuable than prediction.
ETH BULLISH SCENARIO
The bullish scenario is straightforward.
ETH needs to maintain the current recovery structure and eventually take control above $2,500.
A stronger bullish sequence could look like:
$2,466
→ $2,500
→ $2,550
→ $2,600
→ $2,700
The first major confirmation would come above $2,500.
The second would come if ETH can hold above $2,600.
If both levels become support rather than resistance, the market could begin looking toward higher recovery zones.
But again, these are watch levels, not guaranteed targets.
No price level is guaranteed in crypto.
The market decides.
ETH BEARISH SCENARIO
The bearish scenario begins if Ethereum repeatedly fails to break $2,500 and sellers regain control.
The first level I would watch on the downside is:
$2,450
Then:
$2,400
If $2,400 fails, attention could move toward:
$2,350
Then:
$2,300
And if selling pressure becomes significantly stronger:
$2,200
This does not mean ETH must fall to these levels.
It simply means these are areas where traders could watch for possible reactions.
The difference between analysis and prediction is important.
Analysis gives you a map.
The market chooses the direction.
WHY ETH STILL LOOKS INTERESTING
Ethereum remains one of the most important assets in the crypto market.
Current market data places Ethereum around the $2.46K area, with a market capitalization close to $298 billion and ETH remaining the second-largest crypto asset by market value.
That means ETH movements can have a wider effect across the altcoin market.
When ETH gains momentum, many traders begin looking at large-cap altcoins and the broader market for confirmation.
When ETH loses an important support level, risk sentiment can quickly become weaker.
That is why levels such as:
$2,400
$2,500
and
$2,600
matter beyond Ethereum itself.
They can also influence broader market psychology.
ETH HAS ROOM TO MOVE
Another interesting point is that Ethereum is still well below its previous all-time high.
Current data lists ETH's all-time high around $4,946, meaning the present price remains roughly half of that peak.
This does not mean ETH must return to its all-time high.
It simply tells us that the current market is still far away from the previous peak.
For long-term observers, that creates an interesting question:
Is the current move just another recovery inside a larger range?
Or is Ethereum beginning another larger trend?
The answer will not come from one candle.
It will come from the sequence of levels.
First:
$2,500
Then:
$2,600
Then:
$2,700
And eventually, if momentum remains strong, much higher resistance zones can come into consideration.
THE $2,700 AREA
If ETH successfully clears $2,500 and $2,600, I would start paying closer attention to the $2,700 area.
Why?
Because after a strong recovery, traders often begin taking profits at previous psychological and technical levels.
The market rarely moves in a straight line.
Even during a bullish trend, ETH can experience:
rise → pullback → recovery → resistance → breakout → retest
That is normal market behavior.
So if ETH reaches $2,700, a rejection would not automatically mean the entire bullish structure is finished.
What matters is where the pullback stops.
If ETH falls from $2,700 but holds $2,600, that could be healthier than a move all the way back below $2,400.
This is why support and resistance should always be viewed as zones, not perfect single-price points.
FOR CONTENT CREATORS
For a content creator, ETH is currently a much better story than simply writing:
“Ethereum is going up.”
There is a real market structure to discuss.
You can explain:
Current area: $2,466
Support: $2,400
Decision area: $2,450
Major resistance: $2,500
Next area: $2,600
Higher resistance: $2,700
This gives the audience something useful.
It tells them what to watch.
It also keeps the analysis realistic.
The strongest market content does not promise guaranteed profits.
It explains possibilities.
If ETH breaks $2,500, we watch the reaction.
If ETH holds $2,600, the structure becomes stronger.
If ETH falls below $2,400, we become more cautious.
That is a much more professional way to communicate market conditions.
WHAT I AM WATCHING NOW
My ETH/USDT watchlist is simple.
$2,466
This is the current area.
$2,450
Short-term decision zone.
$2,400
Important support.
$2,500
Major psychological resistance.
$2,550
First upside confirmation area after $2,500.
$2,600
Important next resistance/support level.
$2,700
Higher resistance zone.
$2,300
Important downside level if $2,400 fails.
$2,200
Deeper support area.
These levels create a clear map without needing to predict every single candle.
THE BIG QUESTION
The big question for ETH is not whether Ethereum can move higher.
Of course it can.
The real question is:
Can buyers prove strength above $2,500?
That is where the next part of the story begins.
If ETH stays below $2,500, we could remain inside a range.
If ETH breaks $2,500 but immediately falls back, the breakout may be weak.
If ETH breaks $2,500 and holds it as support, the market could become much more constructive.
And if ETH later clears $2,600, attention could move toward $2,700 and higher levels.
On the opposite side:
Lose $2,400 → caution
Lose $2,350 → weakness increases
Lose $2,300 → deeper correction risk
This is the kind of structure I would follow instead of trying to guess the exact top or bottom.
FINAL VIEW
Ethereum around $2,466 is sitting in an important area.
The market has already recovered enough to put $2,500 within reach, but the real test is still ahead.
$2,400 is the key support area.
$2,500 is the major psychological resistance.
$2,600 is the next important upside level.
$2,700 becomes relevant if the recovery continues.
And on the downside, $2,350–$2,300 should remain on the radar if $2,400 breaks.
The latest available market data also shows ETH around $2.46K, with Ethereum remaining the second-largest crypto asset by market capitalization.
So my view is simple:
$2,400 holds → buyers remain in the game.
$2,500 breaks → momentum can improve.
$2,600 holds → bullish structure becomes stronger.
$2,700 breaks → bigger recovery discussion begins.
$2,400 breaks → protect capital and watch lower levels.
No blind prediction.
No guaranteed target.
Just price levels, market structure, and patience.
ETH/USDT at $2,466 is approaching a decision zone — now the market needs to show whether $2,500 becomes a ceiling or the next support.
#TopFiveLeaguesPreMatchPredictor
@Gate_Square
repost-content-media
  • 4
#DOGUSDT:
$0.00123 — DOG Is Holding the Recovery, But the Next Move Could Be Decided Here
DOG/USDT is currently trading around $0.00123, after an explosive recovery from the $0.00060 area earlier this month. The move has already taken DOG close to $0.00146, but after that powerful rally, price is now entering a zone where buyers need to prove that the recovery is still strong.»
DOG•GO•TO•THE•MOON has become one of the more interesting charts to watch after its recent price expansion.
The current price is around $0.00123, while today's trading range is approximately $0.00110–$0.00130. The rece
Original content no longer visible
  • 3
🏦 Fed’s Jackson Hole Speech Ahead — Will U.S. Stocks Rise or Fall?
Markets are watching Jackson Hole closely for fresh signals on inflation and interest rates 👀
💬 Hawkish or dovish? Can tech stocks keep climbing?
⏳ The Gate Square Stock Insights Challenge ends today
Post your original view with #GateStockInsightsChallenge to join the final-day challenge
🎁 First-time participants get a guaranteed first-post reward
🔥 Post daily to win USDT, Gate merch, and exposure boosts
🌟 Keep participating to share a 10,000 USDT prize pool + VIP5 trial access
👉 Join now:
https://www.gate.com/zh/campaig
post-image
Gate_Square
🏦 Fed’s Jackson Hole Speech Ahead — Will U.S. Stocks Rise or Fall?
Markets are watching Jackson Hole closely for fresh signals on inflation and interest rates 👀
💬 Hawkish or dovish? Can tech stocks keep climbing?
⏳ The Gate Square Stock Insights Challenge ends today
Post your original view with #GateStockInsightsChallenge to join the final-day challenge
🎁 First-time participants get a guaranteed first-post reward
🔥 Post daily to win USDT, Gate merch, and exposure boosts
🌟 Keep participating to share a 10,000 USDT prize pool + VIP5 trial access
👉 Join now:
https://www.gate.com/zh/campaigns/5935
📄 Event details:
https://www.gate.com/zh/announcements/article/101239
repost-content-media
  • 6
💰 Gate Square Content Mining Rewards Distributed (Aug 17 – Aug 23)
This week's content mining rewards have been fully distributed. Check your account: Assets → Spot.
Post on Square with trading pair tags or trade cards — earn up to 60% fee rebate when users trade through your content. Keep creating and keep earning.
Event details: https://www.gate.com/announcements/article/49475
‍#ContentMining
post-image
Gate_Square
💰 Gate Square Content Mining Rewards Distributed (Aug 17 – Aug 23)
This week's content mining rewards have been fully distributed. Check your account: Assets → Spot.
Post on Square with trading pair tags or trade cards — earn up to 60% fee rebate when users trade through your content. Keep creating and keep earning.
Event details: https://www.gate.com/announcements/article/49475
‍#ContentMining
repost-content-media
  • 3
#ETHSurges20%BreaksThrough2300
Worked for 9s
ETH Surges 20% and Breaks Through $2,300
Ethereum has delivered a powerful breakout, with ETH surging roughly 20% and briefly moving above the important $2,300 level. The move marks one of ETH’s strongest daily rallies in recent years and has brought renewed attention to the second-largest crypto asset.
. Major Breakout
ETH climbed from below the $1,950 area toward $2,300, breaking through several resistance levels in a short period. The rally was supported by strong buying activity and broader strength across the cryptocurrency market.
Why $2,300
ETH+0.58%
BTC-0.03%
  • 17
  • 1
Gate Square #StockTradingShareChallenge is ongoing!
Share your trades on Gate Square to grab $150,000+ !
🏆 Top traders & analysts * up to $3,000 CFD Position Vouchers
🎁 10 lucky users daily * $500 CFD Position Vouchers each
How to Participate:
1️⃣ Post with #StockTradingShareChallenge + stock-related tags or trade cards
2️⃣ Share your trading strategies
Share my P&L today: https://www.gate.com/post
Event Details: https://www.gate.com/announcements/article/101038
ShainingMoon
Gate Square #StockTradingShareChallenge is ongoing!
Share your trades on Gate Square to grab $150,000+ !
🏆 Top traders & analysts * up to $3,000 CFD Position Vouchers
🎁 10 lucky users daily * $500 CFD Position Vouchers each
How to Participate:
1️⃣ Post with #StockTradingShareChallenge + stock-related tags or trade cards
2️⃣ Share your trading strategies
Share my P&L today: https://www.gate.com/post
Event Details: https://www.gate.com/announcements/article/101038
repost-content-media
  • 13
🤖【AI Robot Craze】Trade $UNITREE to claim 240 USDT, plus a chance to win a Unitree robot dog
The futures trading challenge featuring Unitree (UNITREE), a leading representative of embodied intelligence and humanoid robotics, is now live, with premium high-tech prizes waiting for you to unlock:
🎁 Newcomer Reward: Complete your first trade to claim 5 USDT
📅 Check-in Reward: Meet the daily trading volume target to earn up to 35 USDT in total
⚡️ Leaderboard Reward: Share the 30,000 USDT prize pool, with up to 200 USDT per person
🤖 Physical Prize: Meet the trading volume target for a chance to
ShainingMoon
🤖【AI Robot Craze】Trade $UNITREE to claim 240 USDT, plus a chance to win a Unitree robot dog
The futures trading challenge featuring Unitree (UNITREE), a leading representative of embodied intelligence and humanoid robotics, is now live, with premium high-tech prizes waiting for you to unlock:
🎁 Newcomer Reward: Complete your first trade to claim 5 USDT
📅 Check-in Reward: Meet the daily trading volume target to earn up to 35 USDT in total
⚡️ Leaderboard Reward: Share the 30,000 USDT prize pool, with up to 200 USDT per person
🤖 Physical Prize: Meet the trading volume target for a chance to win 1 of 3 Unitree Go2-Pro robot dogs
💡 Rewards are limited and available on a first-come, first-served basis!
Event period: August 19, 2026, 16:00 – August 28, 16:00 (UTC+8)
👇 After trading, you’re also welcome to visit Gate Square:
Show your positions, discuss longs and shorts, and share your UNITREE trading strategies to see which side everyone is on.
👉 Join now: https://gate.onelink.me/7pdk/d41311d9e8f2bd26
‍#Gate #宇树科技 #宇树科技上市首日大涨629%
repost-content-media
UNITREE-1.25%
  • 16
  • 1
#BTCSurgesPast70000Up8.3%
₿ BITCOIN — BTC
💰 CURRENT PRICE: LIVE
📈 24H CHANGE: +8.3%
Bitcoin has made a strong move above the $70,000 psychological level, bringing fresh momentum back into the market.
BTC is one of the world's largest and most widely followed digital assets. Its price can change continuously as buyers and sellers interact in the market, making Bitcoin highly dynamic and often volatile.
The $70,000 area is now an important level to watch. If Bitcoin can remain above this zone, market sentiment could continue to improve.
BTC KEY LEVELS
🚀 Breakout Zone: $70,000
🔴 Resistance:
post-image
BTC-0.03%
  • 9
#UnitreeTechSoars629%OnDebuts
Unitree Tech Pops 629% on Debut: A Big Moment for Humanoid Robotics
1. A Huge Stock Market Debut
Unitree Technology jumped as much as 629% on its August 19, 2026 debut on Shanghai’s STAR Market. The IPO price was 150.80 yuan, while the stock opened around 1,100 yuan.
It quickly became one of the most talked-about robotics listings, showing just how much excitement there is around humanoid robots and physical AI.
2. What Is Unitree Technology?
Founded in 2016 in Hangzhou, Unitree builds quadruped and humanoid robots that can walk, run, climb, and pull off pretty c
  • 11
#GateDebutsMOUTAIAnd9OtherA-Shares
Gate Futures Launches MOUTAI and Nine Additional A-Share Perpetual Contracts: Expanding Access Between Traditional Equities and 24/7 Derivatives Markets
1. Introduction
Gate Futures has rolled out 10 USDT-margined perpetual contracts tied to major Chinese A-share companies on August 18, 2026. The lineup covers a mix of sectors like energy, tech, consumer goods, healthcare, manufacturing, and industrial infrastructure.
The biggest name here is Kweichow Moutai, one of the most well-known stocks in China’s market. Along with nine other large caps, it gives trad
MOUTAI-0.77%
SHENHUA-0.01%
YANGTZE-0.45%
HYGON-2.33%
MIDEA-0.18%
  • 10
  • 2