#Share My Holding Returns
BTC Short From 86,460 Is Working: Here Is Where I Flip, and Why 81,139 Is the Level I Care About
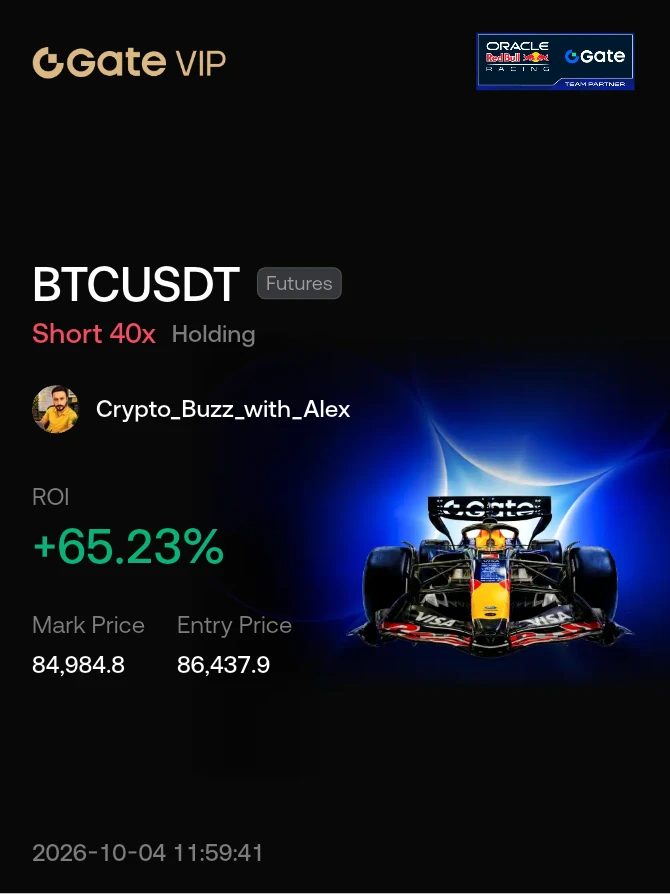
Two days ago I shared a short with an entry zone of 86,450 to 88,890, a stop at 93,000 and six targets, and I took my own entry at 86,460. It is still running. This morning BTC was around 84,940 when I made the chart. TP1 at 85,585 and TP2 at 84,721 are done, and the low so far is about 83,900. Price is roughly 1.7% in my favor. My unrealized ROI shows 66.94% because I am running 40x on this trade, while the signal I shared was 10x. At 10x the same move is about 17%. I am saying this upfront because the leverage matters more than the percentage, and please do not copy my 40x.
Why I took the short in the first place: the push toward 87,000 did not look like fresh demand to me. Before the payrolls print, open interest had grown by about 27,000 BTC and funding had jumped from around 3% to 10% annualized, and about 91% of liquidations in the prior day were shorts. That is a squeeze, and squeezes tend to fade. BTC tagged 87,250 on the number and was back near 84,000 within a day. The rate path also did not change enough to justify chasing it, with a December hike still around 86% priced.
Now the chart, which is a 5-minute view I drew yesterday. The high at 87,383.6 is the level the whole structure hangs on. Just under it I marked a rejection block at roughly 86,900 to 87,200, with a pool of stops resting above it. Below that sits a breaker block around 85,650 to 86,000. After price broke down it printed a change of character near 83,150, and since then BTC has been compressing in a tight range. What matters is what is underneath: stops sitting below the 82,468 low and under the rising trendline, and then a demand zone from about 80,800 to 81,139.
The cyan line on my chart is the path I expect. One last push up toward 85,300 to 85,400, which would grab the stops above the little range, and then a flush through 82,468 into that demand zone. I am not adding to the short up there, and a move above 86,000 would make me stop trusting that path. My TP3 at 82,992 sits just above the 82,468 low, and TP4 at 81,263 is only about 124 points from the demand zone. That is on purpose: I plan to flip from short to long right where the first trade finishes.
Short management from here is simple. After TP2 my rule is to bring the stop to entry at 86,460, so the trade cannot turn into a loss, and to take most of what is left by TP4. TP5 at 78,670 and TP6 at 76,076 stay as a small runner, and they only matter if the long fails. A 5-minute close under 80,521.7 kills the long idea and turns the runner into the main trade.
The long plan is entry at 81,139.1, stop at 80,521.7 and target at 86,146.9, which is the base of the supply area where the breaker block sits. That is a 0.76% risk against a 6.17% reward, about 8.1 to 1. I am not catching a falling knife, though. I want to see price sweep into the zone and then close back above 81,139.1 on the 5-minute, or print a change of character inside the box. That costs a little reward but raises the hit rate a lot.
Now the part most people skip, which is risk. At 40x every 1% move against me costs 40% of my margin, and my liquidation sits only about 2.5% above entry, roughly 88,200 to 88,600 depending on fees. That is well below the 93,000 stop I published, so at my leverage the real stop is liquidation, and the 87,383.6 high came within about 1,000 points of it. That is exactly why moving the stop to entry matters so much. If you follow the signal, use 10x or lower and size from the stop distance, not from the leverage button. The 93,000 stop is 7.56% above 86,460, so risking 1% of your account means a position of about 13.2% of the account, which is only 1.3% of the account as margin at 10x. For the long, a 1% risk with a 0.76% stop means a position around 1.3 times your account, which is not a high-leverage trade at all.
What would prove me wrong: a clean hourly close above 87,383.6. US spot ETFs took in about $6.34B in Q3, including $2.65B in September, so there is a real bid underneath, and ETF markets are closed until Monday. October has also historically been a strong month for BTC. I respect all of that, and if the structure breaks I would rather take the stop than argue with the chart.
Where do you think BTC goes first this week: one more push toward 85,400, or straight to the 82,468 sweep?
Not financial advice. Always do your own research before making any trading or investment decision. Leveraged trading can lose more than you expect.
#ShareWeekly #OneGateWitnessProgram #HYPETreasuryHoldingsTop$3.2B
BTC Short From 86,460 Is Working: Here Is Where I Flip, and Why 81,139 Is the Level I Care About
Two days ago I shared a short with an entry zone of 86,450 to 88,890, a stop at 93,000 and six targets, and I took my own entry at 86,460. It is still running. This morning BTC was around 84,940 when I made the chart. TP1 at 85,585 and TP2 at 84,721 are done, and the low so far is about 83,900. Price is roughly 1.7% in my favor. My unrealized ROI shows 66.94% because I am running 40x on this trade, while the signal I shared was 10x. At 10x the same move is about 17%. I am saying this upfront because the leverage matters more than the percentage, and please do not copy my 40x.
Why I took the short in the first place: the push toward 87,000 did not look like fresh demand to me. Before the payrolls print, open interest had grown by about 27,000 BTC and funding had jumped from around 3% to 10% annualized, and about 91% of liquidations in the prior day were shorts. That is a squeeze, and squeezes tend to fade. BTC tagged 87,250 on the number and was back near 84,000 within a day. The rate path also did not change enough to justify chasing it, with a December hike still around 86% priced.
Now the chart, which is a 5-minute view I drew yesterday. The high at 87,383.6 is the level the whole structure hangs on. Just under it I marked a rejection block at roughly 86,900 to 87,200, with a pool of stops resting above it. Below that sits a breaker block around 85,650 to 86,000. After price broke down it printed a change of character near 83,150, and since then BTC has been compressing in a tight range. What matters is what is underneath: stops sitting below the 82,468 low and under the rising trendline, and then a demand zone from about 80,800 to 81,139.
The cyan line on my chart is the path I expect. One last push up toward 85,300 to 85,400, which would grab the stops above the little range, and then a flush through 82,468 into that demand zone. I am not adding to the short up there, and a move above 86,000 would make me stop trusting that path. My TP3 at 82,992 sits just above the 82,468 low, and TP4 at 81,263 is only about 124 points from the demand zone. That is on purpose: I plan to flip from short to long right where the first trade finishes.
Short management from here is simple. After TP2 my rule is to bring the stop to entry at 86,460, so the trade cannot turn into a loss, and to take most of what is left by TP4. TP5 at 78,670 and TP6 at 76,076 stay as a small runner, and they only matter if the long fails. A 5-minute close under 80,521.7 kills the long idea and turns the runner into the main trade.
The long plan is entry at 81,139.1, stop at 80,521.7 and target at 86,146.9, which is the base of the supply area where the breaker block sits. That is a 0.76% risk against a 6.17% reward, about 8.1 to 1. I am not catching a falling knife, though. I want to see price sweep into the zone and then close back above 81,139.1 on the 5-minute, or print a change of character inside the box. That costs a little reward but raises the hit rate a lot.
Now the part most people skip, which is risk. At 40x every 1% move against me costs 40% of my margin, and my liquidation sits only about 2.5% above entry, roughly 88,200 to 88,600 depending on fees. That is well below the 93,000 stop I published, so at my leverage the real stop is liquidation, and the 87,383.6 high came within about 1,000 points of it. That is exactly why moving the stop to entry matters so much. If you follow the signal, use 10x or lower and size from the stop distance, not from the leverage button. The 93,000 stop is 7.56% above 86,460, so risking 1% of your account means a position of about 13.2% of the account, which is only 1.3% of the account as margin at 10x. For the long, a 1% risk with a 0.76% stop means a position around 1.3 times your account, which is not a high-leverage trade at all.
What would prove me wrong: a clean hourly close above 87,383.6. US spot ETFs took in about $6.34B in Q3, including $2.65B in September, so there is a real bid underneath, and ETF markets are closed until Monday. October has also historically been a strong month for BTC. I respect all of that, and if the structure breaks I would rather take the stop than argue with the chart.
Where do you think BTC goes first this week: one more push toward 85,400, or straight to the 82,468 sweep?
Not financial advice. Always do your own research before making any trading or investment decision. Leveraged trading can lose more than you expect.
#ShareWeekly #OneGateWitnessProgram #HYPETreasuryHoldingsTop$3.2B