Square
Following
Hot
News
Notifications
Profile
Share your thoughts
placeholder
Article
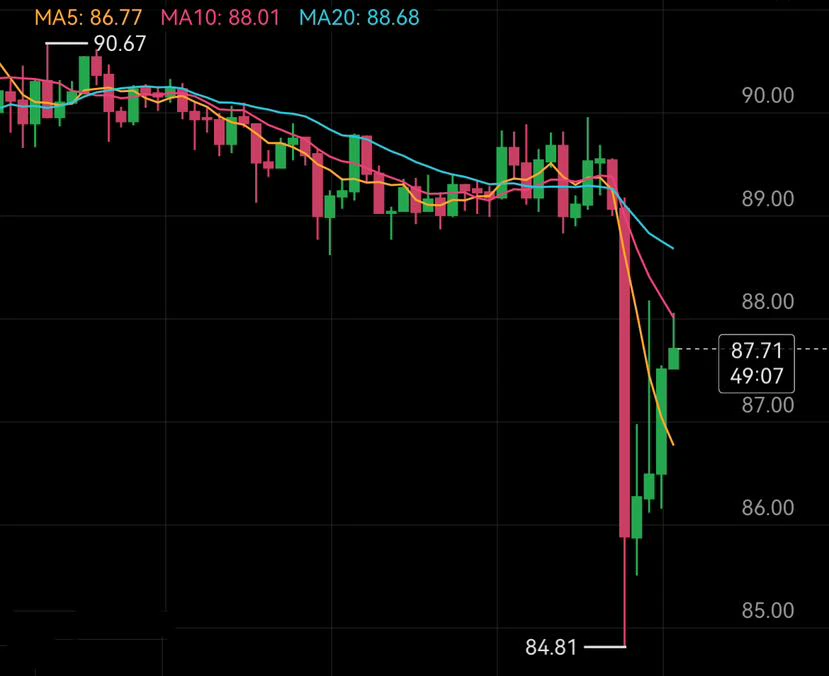
11.9 SOL Analysis

Analysis: Short near 88.8–89.8, stop at 90.3, first target 87, second target 85.5

On the 1H chart, price quickly dropped to a low of 85.02 before recovering. This is an oversold rebound after a sharp decline. Volume increased during the decline, but rebound volume has failed to keep up. The overall bearish structure remains unchanged, so a rejection and pullback from the resistance zone is the preferred scenario. Do not switch to a bullish outlook unless price holds above resistance. #美股AI板块遭遇重挫 $SOL
post-image
SOL-0.77%
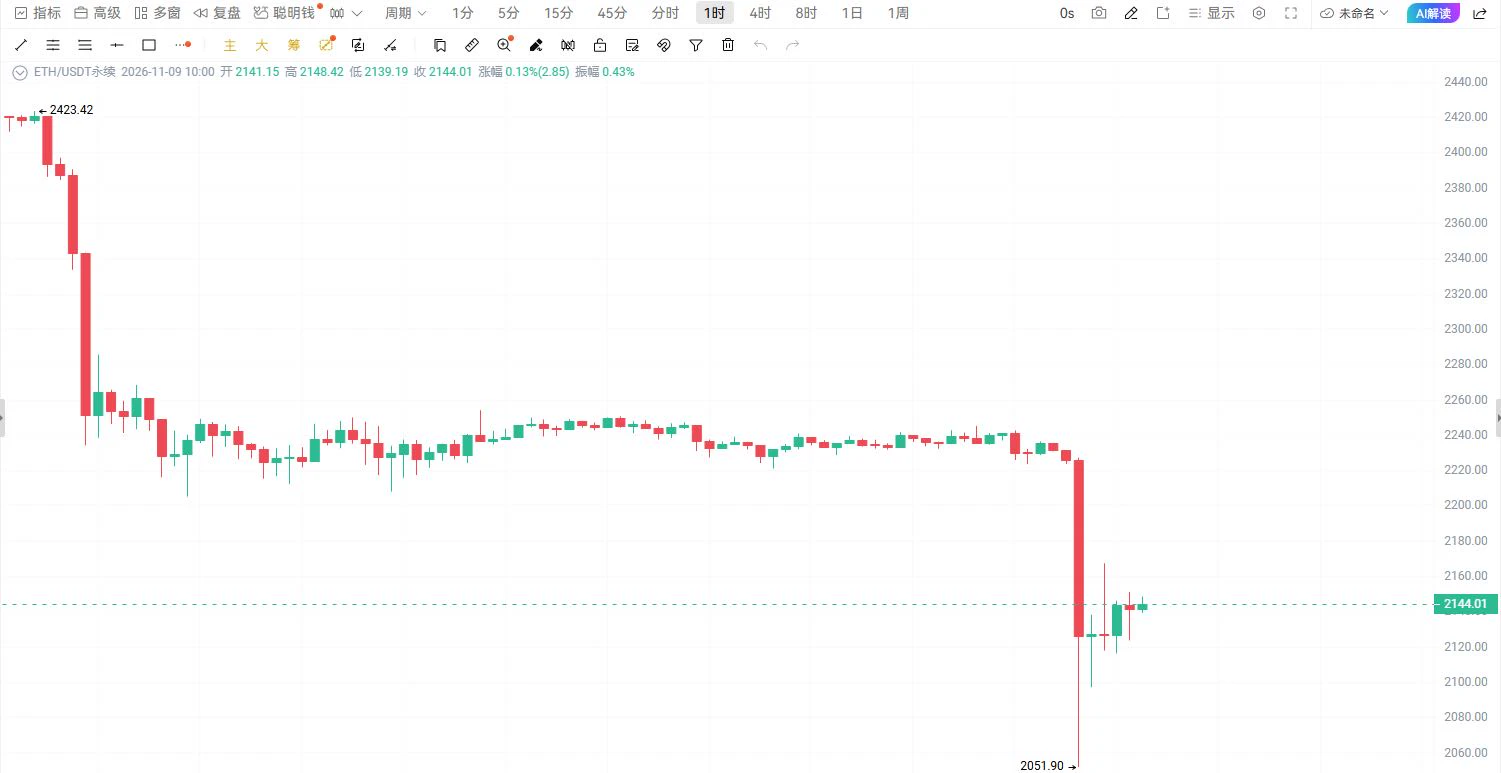
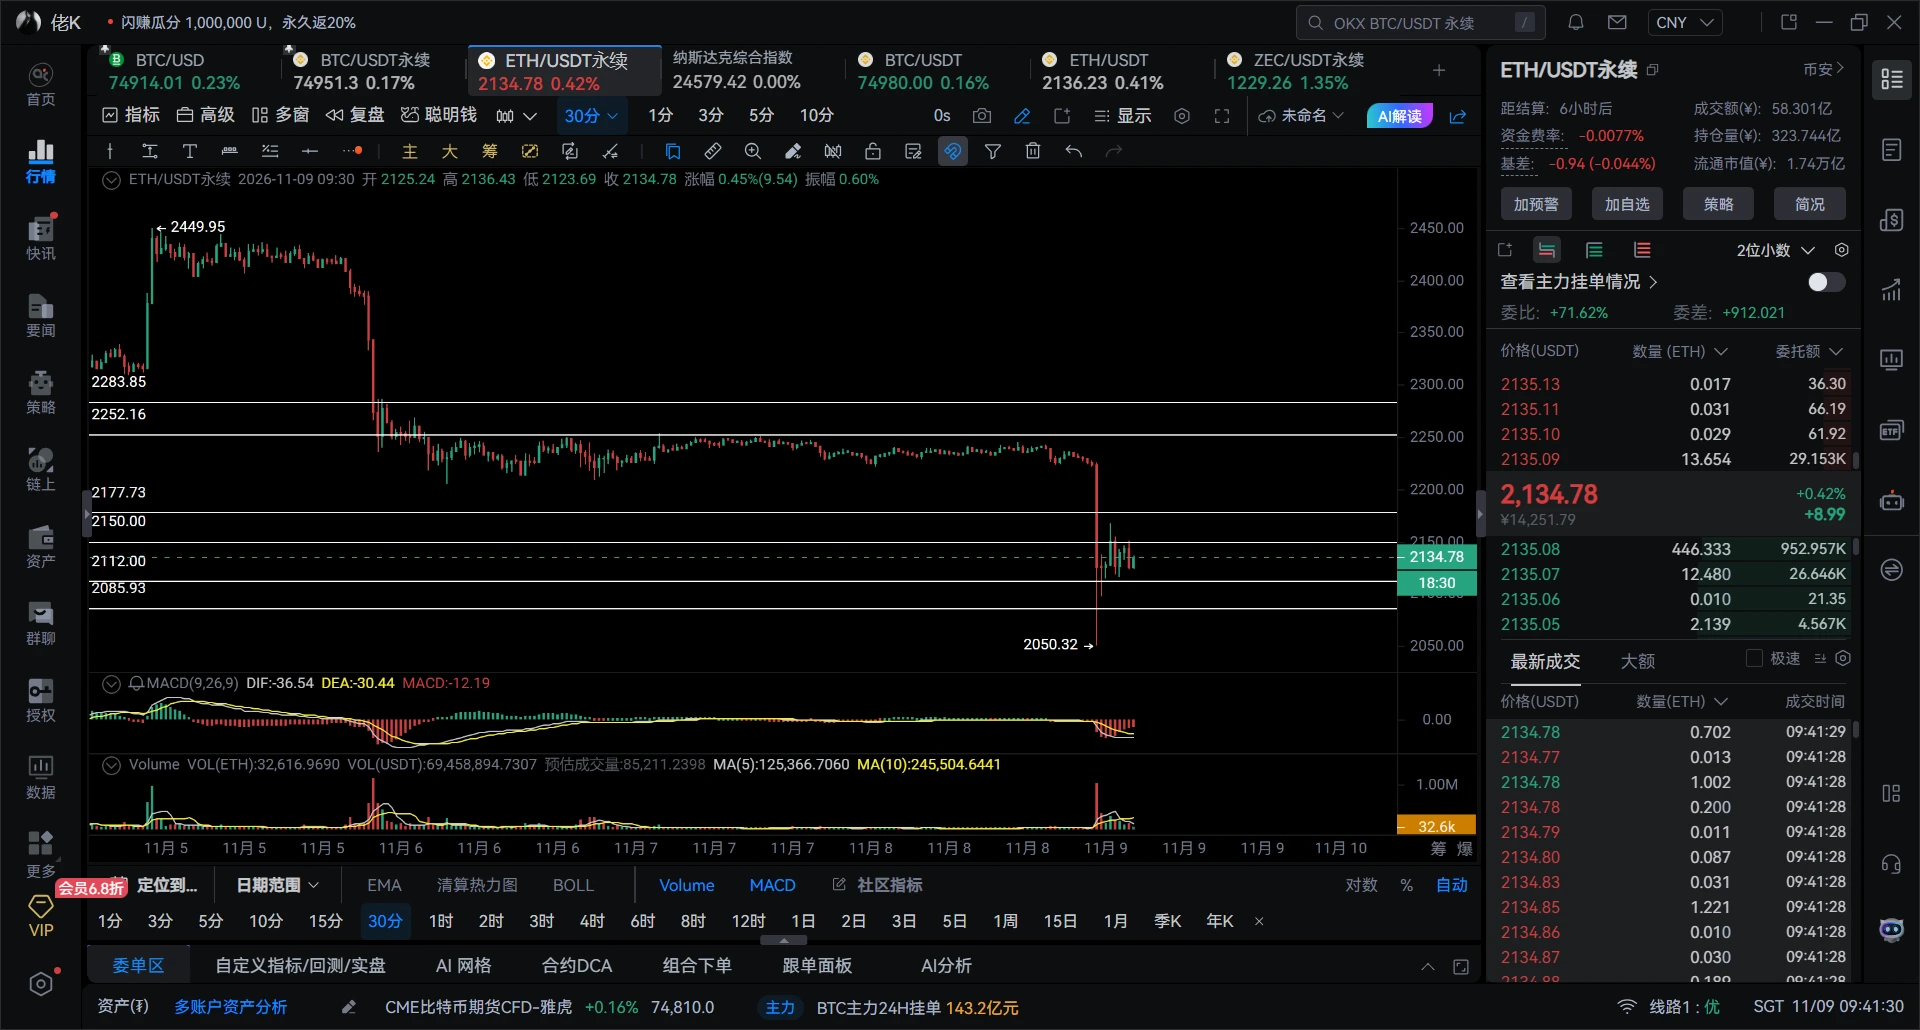
November 9 $ETH Focus on shorting rallies; enter and exit quickly.

【Today's Strategy】
Short entry zone: Set up on a rebound to 2150—2180
Stop-loss: Above 2195
Take-profit: Target 2080—2055

【Core Logic】
The 1-hour chart has seen two rounds of high-volume declines, followed by sideways consolidation and then another breakdown to a new low. The overall downtrend is clear, with bears fully in control. The 2150—2180 zone is where support from the previous trading range has turned into resistance, with selling pressure concentrated from trapped holders and profit-takers. A rebound to this area off
post-image
Trenches
ZIG
Z
bade
b
ZIG
0x8c...1145
Market Cap
$.
Change
.
24h Vol
$.
Holders
.
BTC
B
bade
b
BTC
C5xp...pump
Market Cap
$.
Change
.
24h Vol
$.
Holders
.
STONK
S
bade
b
STONK
6GmA...UNgx
Market Cap
$.
Change
.
24h Vol
$.
Holders
.
ANSEM
A
bade
b
ANSEM
9cRC...pump
Market Cap
$.
Change
.
24h Vol
$.
Holders
.
MAGGIE
M
bade
b
MAGGIE
8rHo...PmZV
Market Cap
$.
Change
.
24h Vol
$.
Holders
.
How to Build a Trading Cost Tracking Sheet and See Your True Profits

Many traders review their trades every day, but may overlook one key question:

Your account looks profitable, but how much is left after all costs are deducted?

Without complete trading records, you may know which trades made money, but not what is continually eroding your profits.

Today, we’re sharing a trading cost tracking method you can put into practice right away.

I. Record Every Trade

We recommend creating an Excel spreadsheet that records at least the following information:

* Trade date and trading pair
* Openi
post-image
The market has really entered a waterfall decline, and this drop has been brutal. I regret keeping my position a bit light, but I don’t regret it. I’d rather earn less than get carried away; a gambler’s mentality is no good. Put the win rate first and take it slowly, one trade at a time. The market is highly volatile right now, and maintaining a steady pace is the key to surviving longer. $BTC $SKHYNIX
Risk warning: The above is only a personal record of trades and reflections, and does not constitute investment advice. Contract trading carries extremely high risks, so carefully assess your ow
post-image
BTC-0.65%
SKHYNIX+1.41%
This image proves:
If a wife wants to run off with someone, no lock can keep her in...
Try buying $UNI . Entry range: 6.833 - 6.878 Target levels: 7.181, 7.441 Stop-loss: 6.628 UNI is setting up for a V-shaped rebound; bulls are reclaiming the moving averages, and it's time to catch this rebound. Caution: the 1-hour trend is still bearish; if 6.88 cannot hold, the long strategy is invalidated. Don't go all in, friends. Size your position according to your account.
post-image
UNI+3.05%
11.09 SOL Market Analysis

Short: around 88.30-88.80, stop loss at 89.50, targets 86.50/85.00.

SOL is currently at 88.16. After bottoming near 85.00, the market staged a technical recovery with a series of consecutive bullish candles. The price has now rebounded to around 88.16, entering the secondary resistance zone left by the previous sharp drop.

The 88.30-88.80 area overhead is the first significant resistance zone for this rebound. It is under pressure from both the EMA20 and trapped supply from earlier. The price may face selling pressure here, with the defensive stop-loss level set ab
post-image
SOL-0.74%
this is almost worse than callouts
post-image
#美股AI板块遭遇重挫 #作手分析
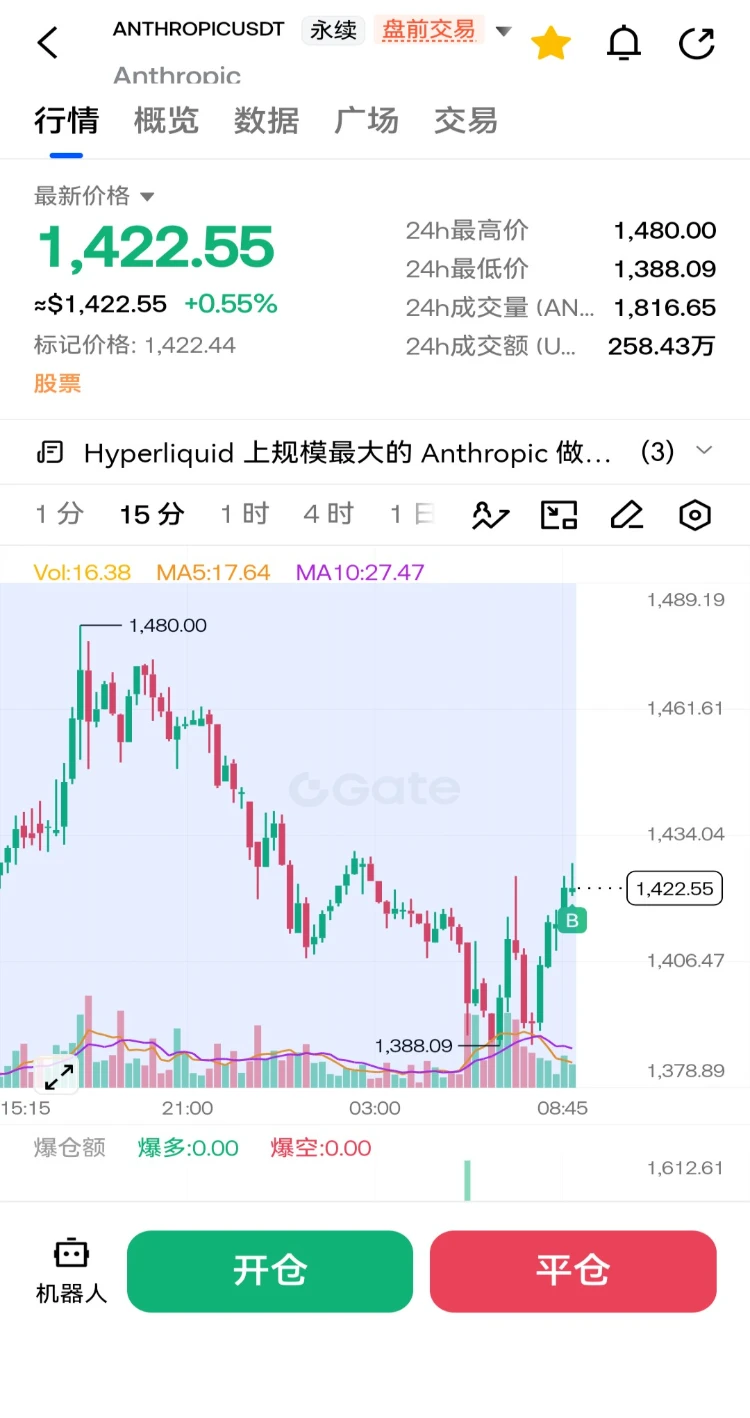
$ANTHROPIC A long signal appeared for a right-side entry. I decided this morning to add to my position once more. The project will begin its IPO roadshow this week and will most likely list on Nasdaq by the end of this month. Taking a shot.
post-image
ANTHROPIC+0.63%
  • 4
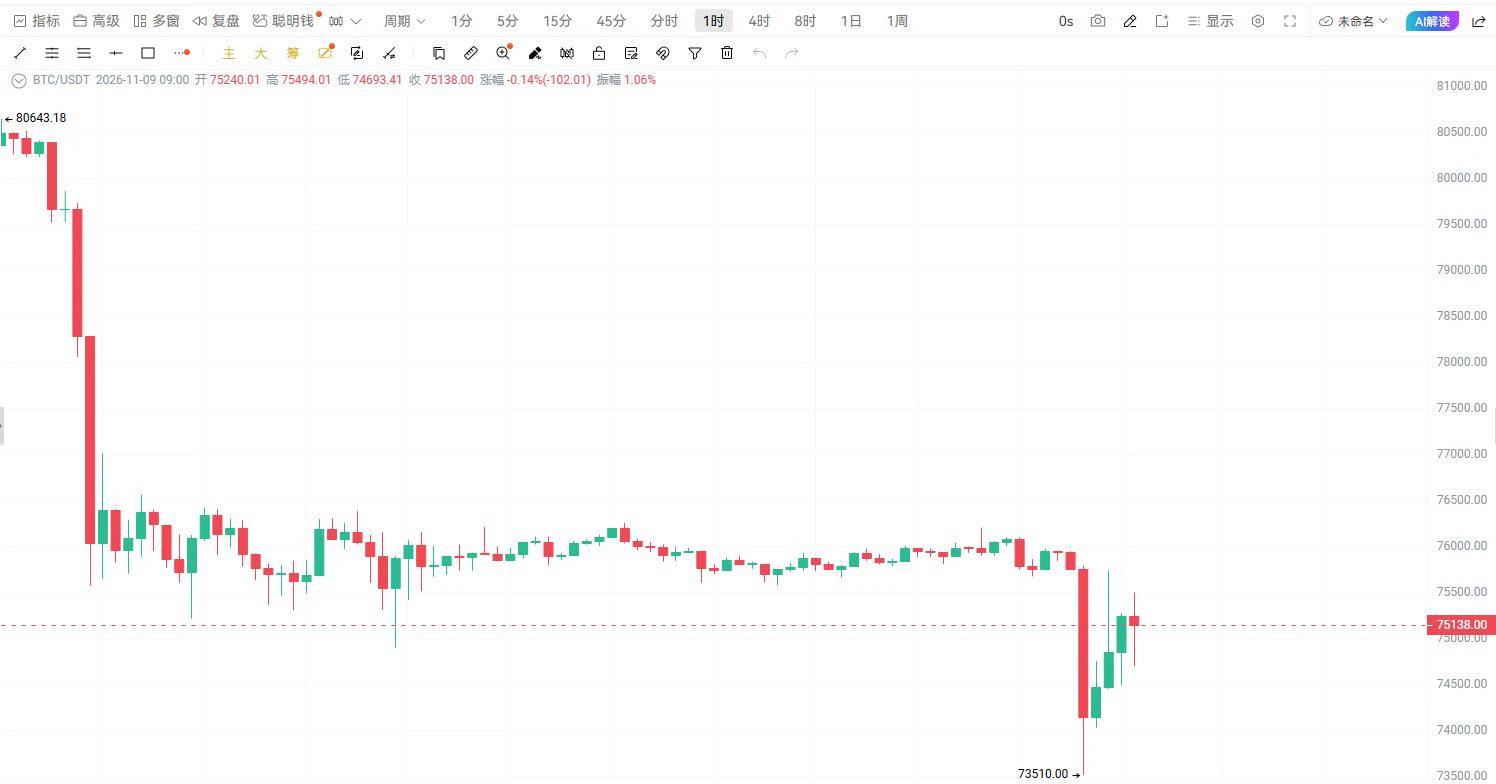
November 9 $BTC Focus on shorting rebounds, entering and exiting quickly.

【Today's Strategy】
Short entry range: Set up on a rebound to 75000—75700
Stop-loss: Above 76300
Take-profit: Target 73800—73400

【Core Rationale】
The 1-hour chart has seen two rounds of high-volume declines, followed by sideways consolidation and another breakdown to a new low. The overall downtrend is clear, with bears fully in control. The 75000—75700 range is a former consolidation platform that has shifted from support to resistance, where trapped holders and profit-taking create concentrated selling pressure. A reb
post-image
BTC-0.65%
Sudden flash crash before BTC’s weekly close! A wick down to $73,510, with $715 million in long
live-cover
LIVE1,926
Nasdaq plunges 5.5%, and BTC can’t sit still either! AI bubble bursts—how long will crypto have to follow suit?

U.S. stocks took a real hit this time! The Nasdaq plunged 5.5% in a single day, wiping out around $2.5 trillion in market value, as AI tech stocks faced a broad sell-off. The once red-hot artificial intelligence sector suddenly went from darling to hot potato. More interestingly, when AI stocks sneeze, the crypto market catches a cold—and BTC naturally couldn’t escape unscathed.
Why does a decline in the AI sector affect Bitcoin? Because BTC is no longer the asset it once was, playi
AMD+11.55%
In BTC trading, how do you choose the right position size? Don't let one mistake destroy your entire account!
In BTC trading, many people devote a lot of effort to predicting market direction, but overlook a question that directly affects their account’s survival: how much capital should they actually commit? Even if they get the direction right, an oversized position could force them out early due to sharp volatility along the way.
So, how can you choose a position size scientifically?
First, don't confuse your account balance with your actual position size. The amount of money in your accoun
post-image
BTC-0.65%
Before the end of the year, I must make 300k U. Just wait and see, you big shots. I must make it big in crypto, and within three years, I must become the richest person in our village #山东济宁大壮哥
AI stocks plunge, but tech giants are insisting that demand hasn’t disappeared! Is this round of AI
live-cover
LIVE2,056
SHIB Falls Below $0.000005, Putting Bulls to a Severe Test

On November 9, Shiba Inu (SHIB) continued to face heavy selling pressure, falling below the important psychological level of $0.00000500 and further to around $0.00000447. This move reflects growing bearish sentiment in the market and means bulls may face an even tougher test in the near term.
Technically, SHIB is currently trading below the daily 200-day moving average, which is around $0.00000545, indicating that the overall trend remains weak. In addition, the Relative Strength Index (RSI) is gradually approaching oversold territor
NVDA+2.80%
SHIB-1.31%
  • 27
SHIB’s decline is not over yet, with $0.00000410 becoming a key line of defense

Shiba Inu (SHIB) faced further selling on November 9, weakening further after falling below the important psychological level of $0.00000500 and hitting a low near $0.00000447. As market buying gradually weakened, investors began turning their attention to lower support zones, especially the key price level of $0.00000410.
From the daily technical structure, SHIB is currently well below the 200-day moving average near $0.00000545. This indicates that the price remains in a relatively weak trend environment, and sh
SPCX+8.74%
  • 1
11.9 ETH Market Analysis
Ethereum has fallen sharply and has not recovered as quickly as Bitcoin
The monthly chart also shows hidden divergence; the weekly MACD has printed a death cross for 2 consecutive weeks
On the 3-day and 5-day timeframes, prices have continued to fall on low volume; the 2-day chart has broken lower
12/8-hour timeframe rebound + divergence (no pattern on the 2–6-hour timeframes; in the short term, wait for the 15/30-minute charts to bottom and form a pattern)
Intraday resistance: 2150 2177 2205
Intraday support: 2112 2085 2056
$ETH
post-image
ETH-1.23%
SHIB Key Price Levels: Rebound or Further Decline?

On November 9, Shiba Inu (SHIB) weakened further, falling below the psychological $0.00000500 threshold and sliding to around $0.00000447. The market is now at a stage where bullish and bearish forces are contending again, and price action in the coming days may determine SHIB’s short-term direction.
From a technical analysis perspective, SHIB is currently facing clear trend pressure. The daily 200-day moving average is around $0.00000545, well above the current trading price, indicating that the broader market remains bearish. Meanwhile, the
MU+4.71%
SHIB-1.31%
  • 15
Load More

Join 40 M users in our growing community

⚡️ Join 40 M users in the crypto craze discussion

💬 Engage with your favorite top creators

👍 See what interests you

Trending Topics

USCPIDataIncoming

21.09k Views1.72k Discussing

The U.S. October CPI report will be released on November 10 at 8:30 a.m. ET. September CPI came in at 3.7% year over year, and markets will be watching closely for signs that inflation is cooling, especially in core CPI. A softer-than-expected reading could strengthen rate-cut expectations, while hotter inflation may pressure risk assets through higher Treasury yields and a stronger dollar. How do you think this CPI print will move $BTC, U.S. stocks and gold?

BTCFlashCrash

11.44k Views65.99k Discussing

USAIStocksHitHard

31.15k Views3.75k Discussing

View More