MikeLei

vip
Peak Tier 10
On-chain Analyst
Market Analyst
Talented horses are everywhere, but good judges of talent are rare. A five-year contract player—my way of self-redemption. Give me one chance, and I’ll return you a future.
Bitcoin weekly trend has not yet shown a clear reversal signal, and the overall long-term cycle remains in a relatively weak correction phase; support below: around $59,000 (a key defensive area on the weekly level), resistance above: around $66,000 (the previous breakdown of an important neckline, now turned into a strong resistance zone), MACD continues to stay weak, RSI is still in the correction phase, and bullish momentum has not yet recovered; the daily level is currently in a converging consolidation zone, with $59,000 being the most important bullish defense level at present, and $65,0
BTC1.38%
View Original
  • Reward
  • Comment
  • Repost
  • Share
Figure 1: The previous low has been taken out, and here are the conditions for a rebound. The most critical resistance above is the pre-quarter VAL.
Figure 2: This week's sharp decline, ongoing control selling, weekly developing VAL shows very obvious resistance. Once it recovers here, it indicates the first signal that a rebound has begun. #分享美股交易赢英伟达股票
NVDA1.86%
View Original
post-image
post-image
  • Reward
  • 1
  • Repost
  • Share
TheCatAtFourInTheMorning:
Community Growth Points Lottery Carnival
Invite friends to join the growth points lottery and win generous prizes!
https://www.gate.com/activities/pointprize/?now_period=19&refUid=53394464 Community Growth Points Lottery Carnival
Invite friends to join the growth points lottery and win generous prizes!
https://www.gate.com/activities/pointprize/?now_period=19&refUid=53394464
The main trend today is still bearish, only showing some rebound after testing the February lows. Now we need to pay attention to the strength of the rebound, as this is a strong support level. So while remaining bearish, if the rebound breaks through a key level, we should shift our mindset. Until the breakthrough occurs, maintain a high short position, forever and ever.
#分享美股交易赢英伟达股票
Bitcoin still hasn't stabilized above the previous high yesterday. The studio suggested shorting around 63,800 during the rebound, which once dropped below 60,000 and touched around 59,100, perfectly aligni
NVDA1.86%
BTC1.38%
View Original
  • Reward
  • Comment
  • Repost
  • Share
BNB利好,VanEck推出美国首只现货BNBETF;币安正式布局传统金融衍生品市场;日线出现放量倒锤线,短线存在获利回吐压力,688成为关键支撑位;支撑:680-650,可以逢低布局,高空关注上方短线压力,冲高回落压力:720-740;
mike雷
0/50
30D Return %
+12.33%
+772.69 USDT
30D P/L Ratio
2.18
AUM
$0
30D Win Rate
76.92%
  • Reward
  • Comment
  • Repost
  • Share
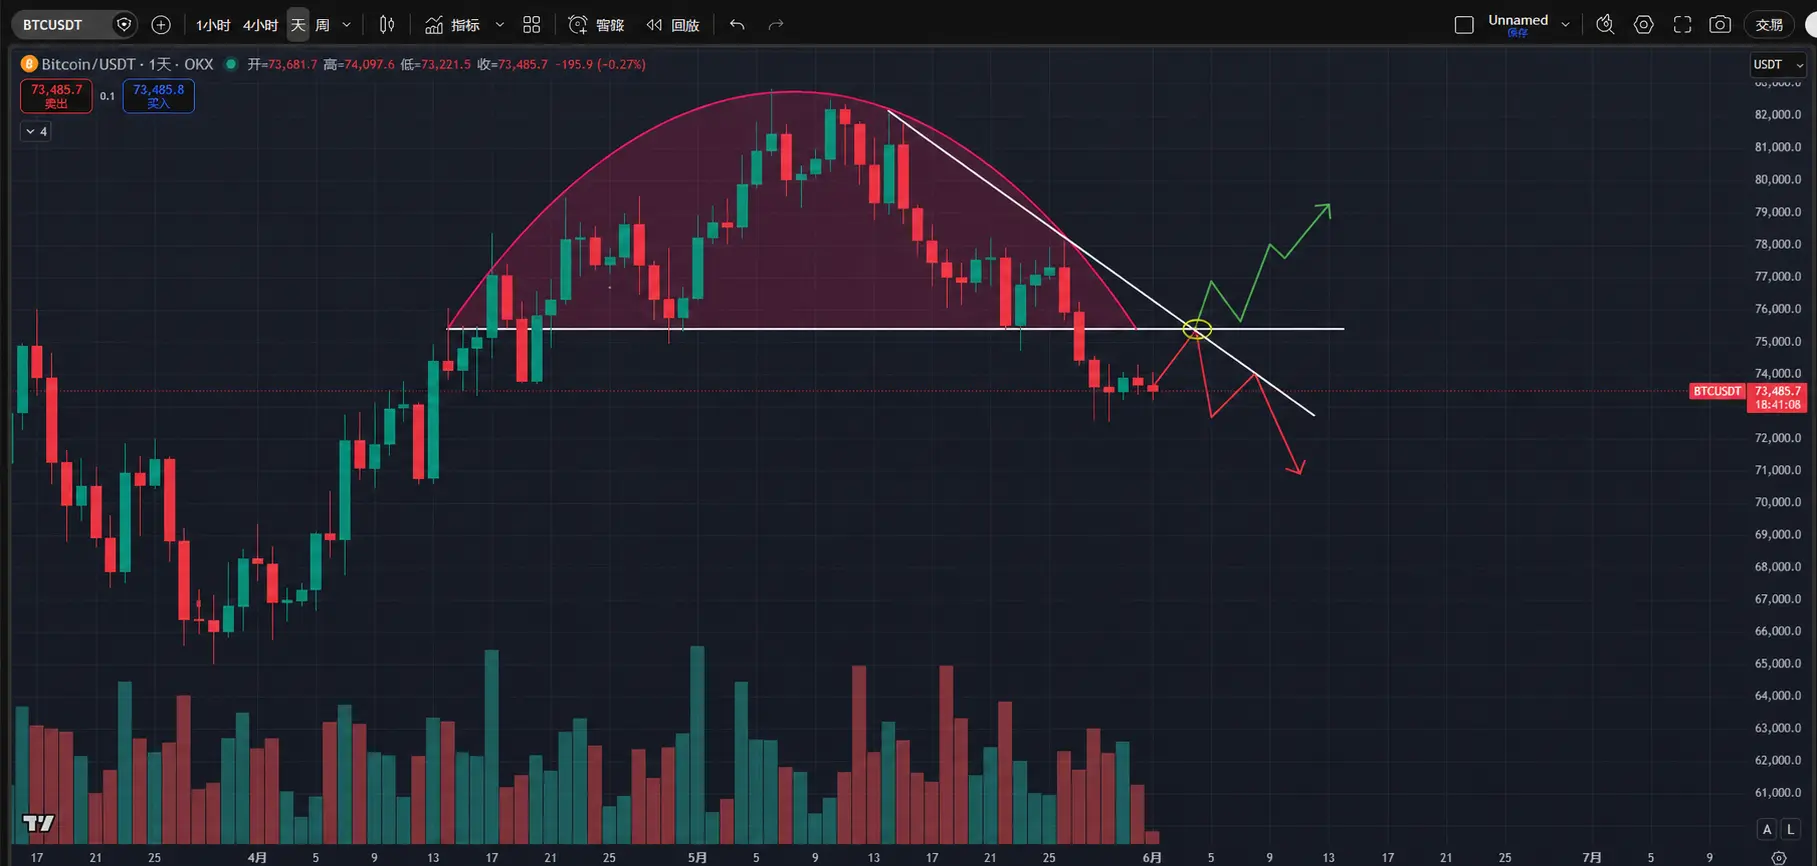
BTC Last week, the weekly chart closed with a large bearish candle, breaking below the key neckline support of 76,000.
The current key resistance zone is between 75,300 and 76,300 (FVG gap), and between 77,300 and 78,300 (concentrated chip area).
If a breakout and stabilization occur, the weekly trend may turn bullish again.
The core support below is around 72,000 (uptrend line + 0.618 retracement).
Currently, focus on the 72,000 trend line support.
This week, the market remains weak and consolidating, with a bearish weekly structure.
MACD and RSI show signs of weakening momentum t
BTC1.38%
View Original
post-image
mike雷
0/50
30D Return %
+12.33%
+772.69 USDT
30D P/L Ratio
2.18
AUM
$0
30D Win Rate
76.92%
  • Reward
  • Comment
  • Repost
  • Share
In the evening, the market generally maintains the same view as during the day. Don’t assume a reversal just because it was pulled back from 72,400. What we’re seeing now is a tug-of-war: a weak rebound after a drop. The current issue is that after the weak rebound, 74,200 has not been able to hold. After selling down from 78,000 to 72,400, there was indeed a rebound—but multiple attempts to push up to around 74,200 were pushed back down. This indicates that sell pressure is still present here.
Neither trading volume nor open interest has provided a volume-price confirmation. After the rebound
4-1.77%
View Original
mike雷
0/50
30D Return %
+24.28%
+1,521.33 USDT
30D P/L Ratio
2.18
AUM
$0
30D Win Rate
77.77%
  • Reward
  • Comment
  • Repost
  • Share
Precise point location #成长值抽奖赢金条
View Original
post-image
mike雷
0/50
30D Return %
+24.28%
+1,521.33 USDT
30D P/L Ratio
2.18
AUM
$0
30D Win Rate
77.77%
MikeLei
Btc
Direction: Short
Open Position: 74,000-75,300
Stop Loss: 76,000
Take Profit: 73,300-72,600-71,900
Entry is flexible, no need to hit the exact point. #成长值抽奖赢金条
  • Reward
  • Comment
  • Repost
  • Share
Btc
Direction: Short
Open Position: 74,000-75,300
Stop Loss: 76,000
Take Profit: 73,300-72,600-71,900
Entry is flexible, no need to hit the exact point. #成长值抽奖赢金条
BTC1.38%
View Original
mike雷
0/50
30D Return %
+24.28%
+1,521.33 USDT
30D P/L Ratio
2.18
AUM
$0
30D Win Rate
77.77%
  • Reward
  • Comment
  • 1
  • Share
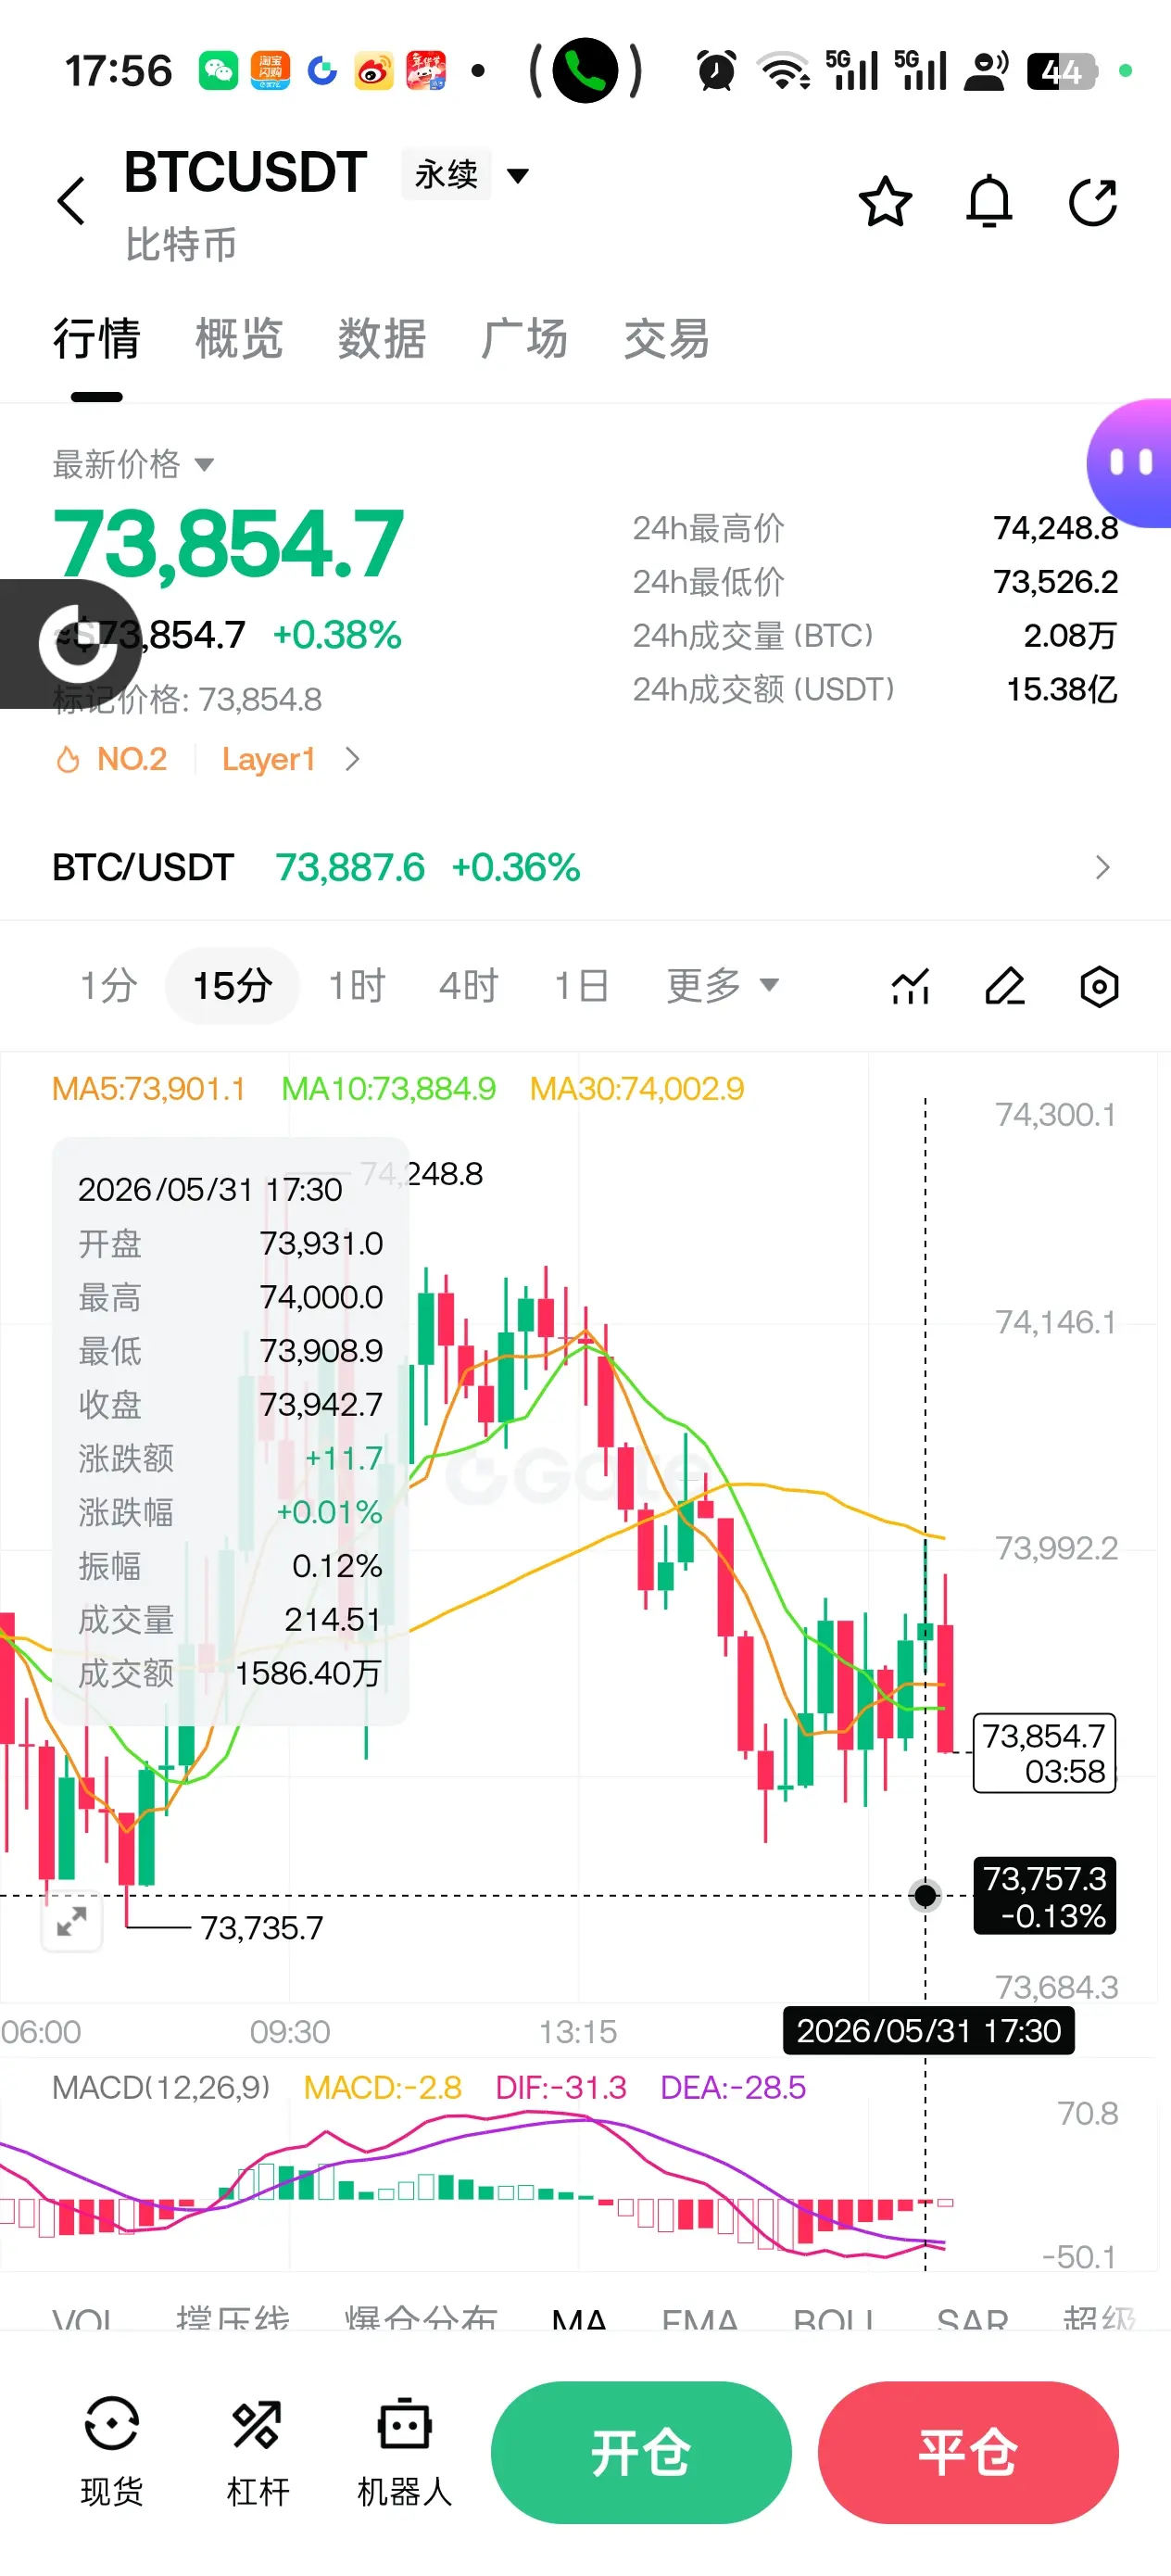
Today is the weekend, and from a technical perspective, the market is showing a weak rebound after a decline, with tug-of-war. The real contradiction is that the price bounced from 72,400, but the 4-hour and daily charts have not yet recovered.
74,200 is the first threshold. If it cannot break above, the short-term rebound is likely to continue to be suppressed. If it breaks above, it doesn't mean a reversal is confirmed; we still need to watch 74,600.
73,900 is the daily support line. Holding this level can keep BTC in a low-range tug-of-war; if it breaks below, the market will be pushed ba
BTC1.38%
View Original
mike雷
0/50
30D Return %
+24.28%
+1,521.33 USDT
30D P/L Ratio
2.18
AUM
$0
30D Win Rate
77.77%
  • Reward
  • Comment
  • Repost
  • Share
Today is Saturday, with low liquidity, and the market shows low-level support, but the rebound has not yet upgraded.
So don't rush to see support as a reversal, and also don't say it's broken just because it touched around 72400 last night.
Right now, BTC looks more like a tug-of-war at the low end, with the main direction still leaning towards defense, and the key is whether 73500 can hold steady.
The levels given yesterday at 72500, 73500, 73900, and 74300 are completely in line with the market trend.
Last night, it bounced from 72400 to 74300, seeming to have a rebound, but the prob
BTC1.38%
View Original
mike雷
0/50
30D Return %
+24.55%
+1,521.33 USDT
30D P/L Ratio
2.18
AUM
$0
30D Win Rate
77.77%
  • Reward
  • Comment
  • Repost
  • Share
BTC’s weekly candlestick last week closed with a long lower shadow and relatively low volume. This week, BTC continues to hold a large bearish candle structure, having already fallen below the previous low of 74,200. The current key resistance area is 75,300-76,300 (FVG gap), and 77,300-78,300 (position/chip concentration zone). Only if it breaks through and holds above these levels can the weekly trend potentially turn stronger again. The core support below is around 72,000 (uptrend line + 0.618 retracement). At present, the key focus is on whether the 72,000 uptrend line support holds. If it
BTC1.38%
View Original
mike雷
0/50
30D Return %
+24.31%
+1,506.64 USDT
30D P/L Ratio
2.06
AUM
$0
30D Win Rate
75%
MikeLei
SOL’s ETF is still maintaining net inflows, and SOL’s funding conditions are relatively more stable; the highly leveraged longs have been largely cleared out, and the liquidation pressure on the longs below has noticeably decreased; the daily chart shows a volume increase with a long lower wick. Currently, SOL is severely oversold. If it can break through the resistance near the downward trendline around 83.5, there may be a follow-through rebound; the 4-hour MACD and RSI are forming a golden cross, suggesting a short-term range-bound and upward correction repair is needed. Resistance above: around 83.5; key support below: the prior low around 81.
  • Reward
  • Comment
  • Repost
  • Share
SOL’s ETF is still maintaining net inflows, and SOL’s funding conditions are relatively more stable; the highly leveraged longs have been largely cleared out, and the liquidation pressure on the longs below has noticeably decreased; the daily chart shows a volume increase with a long lower wick. Currently, SOL is severely oversold. If it can break through the resistance near the downward trendline around 83.5, there may be a follow-through rebound; the 4-hour MACD and RSI are forming a golden cross, suggesting a short-term range-bound and upward correction repair is needed. Resistance above: a
SOL-0.02%
View Original
mike雷
0/50
30D Return %
+24.31%
+1,506.64 USDT
30D P/L Ratio
2.06
AUM
$0
30D Win Rate
75%
  • Reward
  • Comment
  • 1
  • Share
May 28, 2026, evening (point reference valid only for that day)
BTC core key level: 74,000
BTC daily long-short dividing line: 74,200
Upper resistance levels: 73,600, 74,000, 74,700
Lower support levels: 72,800, 72,200, 71,400
BTC1.38%
View Original
mike雷
0/50
30D Return %
+20.94%
+1,289.77 USDT
30D P/L Ratio
2.06
AUM
$0
30D Win Rate
73.07%
  • Reward
  • 1
  • Repost
  • Share
There are many talented horses, but good judges are rare. Give me a chance to lead you to the pinnacle of life.
View Original
mike雷
0/50
30D Return %
+56.92%
+1,036.48 USDT
30D P/L Ratio
3.28
AUM
$0
30D Win Rate
80%
  • Reward
  • 1
  • Repost
  • Share
Analyst—Mark
1. Weekly Level:
Regarding the candlestick chart, last week’s candlestick was quite strong, still a large bullish candle, and has already consecutively closed four bullish days. The bulls show no signs of weakening and are still pushing strongly, but the trading volume has decreased somewhat. Last week’s bullish candle’s upper shadow tip reached the 79,500 resistance (Fibonacci 0.5 zone resistance). This week, focus on whether this resistance can be broken further; if broken, it will reach the 83,500 resistance zone (Fibonacci 0.619 + FVG gap). If the 79,500 resistance fails to br
View Original
mike雷
0/50
30D Return %
-9.44%
-499.98 USDT
30D P/L Ratio
1.27
AUM
$0
30D Win Rate
30%
  • Reward
  • Comment
  • Repost
  • Share
BTC weekly four consecutive bullish candles pattern. This week’s bullish candle is expected to continue, trading above the middle band of the rising channel, with the overall weekly chart forming an oscillating upward structure. Currently, resistance is around 79,500 in the previous high area (channel upper band pressure). If price breaks and holds above 79,500, it may rise to the 82,000–84,000 range (FVG gap + double-line reversal target). The weekly indicators MACD show a golden cross; RSI and CCI show a bullish crossover that has turned stronger, maintaining a long bias.
On the daily chart,
BTC1.38%
View Original
  • Reward
  • Comment
  • Repost
  • Share
BTC, a new week, focusing on the monthly timeframe framework. Currently, the price is trading within the pmVAH - pmVWAP range, with the upper and lower boundaries being our key levels for trading.
Over the weekend, the decline left a gap on CME, and the 30-minute level also shows an unfilled nPOC, which leans more towards a continuation of the decline after filling the gap.
The quick drop in the early session reached the 8-week CVAH, where the price is building a consolidation. We can see this as a parallel bottom; if the price consolidates below this level, forming a high point of a consolida
BTC1.38%
View Original
post-image
post-image
mike雷
0/50
30D Return %
+22.08%
+425.21 USDT
30D P/L Ratio
0
AUM
$0
30D Win Rate
100%
  • Reward
  • Comment
  • Repost
  • Share
All the key points about the trend line revolve around 【consensus】— how many people believe in it, and whether they go long or short near the line. The fact that so many people are discussing this line indicates 【consensus】, which means it will have an effect. The effects include: support, resistance, genuine breakouts, and false breakouts.
It seems that recently there has been quite a bit of discussion in the community about this trend line. I discussed it with AI and summarized a few opinions:
Two points connected are just “subjective guesses”: On the chart, you can randomly find two high po
View Original
post-image
post-image
mike雷
0/50
30D Return %
+22.08%
+425.21 USDT
30D P/L Ratio
0
AUM
$0
30D Win Rate
100%
  • Reward
  • Comment
  • Repost
  • Share
  • Pinned