Square
Following
Hot
News
Profile
Share your thoughts
placeholder
Article
Lumen's wealth-growth price has reached 759.29. Figure 2 shares the monitoring point for deciding when to stop wealth growth; if the monitoring point holds, wealth growth will continue. $LITE ‌
LITE-3.00%
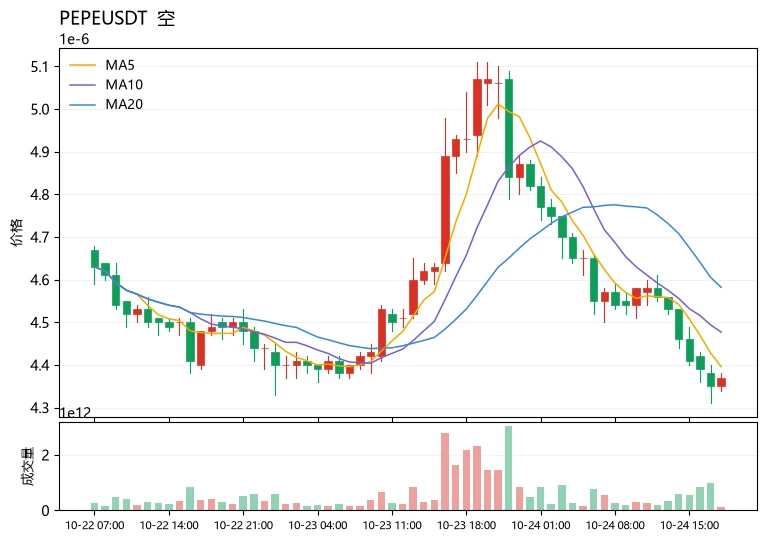
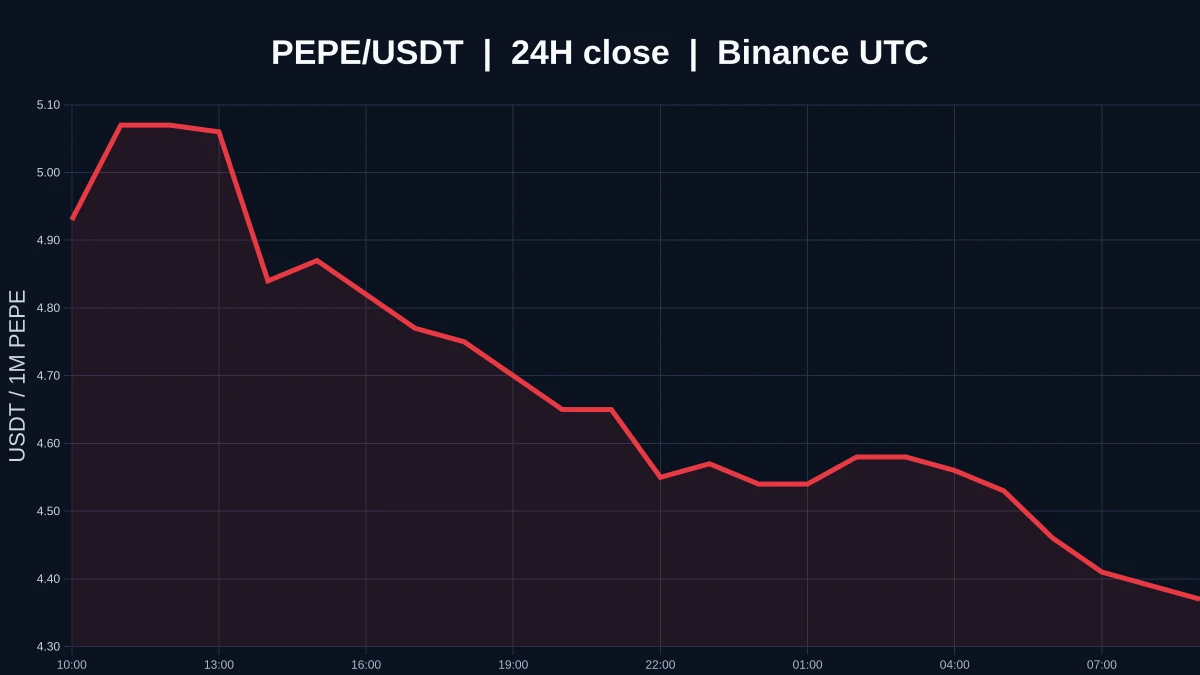
$PEPE Current price: 4.37e-06. The first resistance above is at 4.396e-06, where MA5 sits. Key support below is the lower Bollinger Band at 4.294e-06, with a deeper line of defense around 4.20e-06. Price is currently trading near the lower Bollinger Band. MA5 is below MA20, and the moving averages remain bearishly aligned, indicating that this decline has yet to complete its recovery.
Technical breakdown: MA5=4.396e-06, MA20=4.582e-06. The short-term moving average is below the medium-term one, and the gap has not narrowed, making a weak rebound more likely; the MACD histogram at -3.294e-08 r
post-image
PEPE-10.49%
DOGE-2.80%
TREE+41.49%
  • 1
Trenches
ZIG
Z
bade
b
ZIG
0x8c...1145
Market Cap
$.
Change
.
24h Vol
$.
Holders
.
YMB
Y
bade
b
YMB
2TKD...pump
Market Cap
$.
Change
.
24h Vol
$.
Holders
.
AGT
A
bade
b
AGT
0x5d...e274
Market Cap
$.
Change
.
24h Vol
$.
Holders
.
CNPY
C
bade
b
CNPY
0xc6...ddd2
Market Cap
$.
Change
.
24h Vol
$.
Holders
.
BIRB
B
bade
b
BIRB
G7vQ...KNwG
Market Cap
$.
Change
.
24h Vol
$.
Holders
.
🔹 Bitwise: Bitcoin implied volatility falls to a three-year low as long-term holders continue to di
live-cover
LIVE2,663
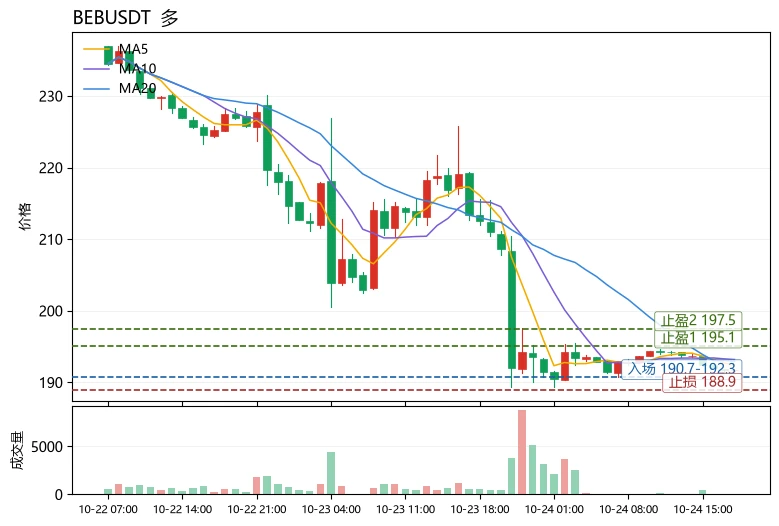
$BEB The current price is 191.8, down 10.47% over 24h, with a trading volume of 6.2M USDT; MA5=192.32 has crossed below MA20=192.93, and RSI=33.8 is approaching oversold territory. However, the MACD histogram remains positive at 0.7421. The price is trading along the lower Bollinger Band at 190.713, and the 30-candle range has reached 19.06%, indicating elevated wick risk. The Fear & Greed Index is neutral at 51, suggesting this is not panic selling but an orderly flushing out of leveraged longs.
The key signal in the funding data lies elsewhere: $GT the funding rate is -0.1392%, down 16.66%
post-image
GT-1.92%
ERA+7.35%
The subscription order posted around 8 this morning has absolutely crushed it again!!!!
post-image
  • 1
Guys, I’m still holding an ETH long. I don’t know everyone’s position sizes or leverage, but let me analyze the current market for you.
Gold, U.S. stocks, and crypto are all falling, causing many people to panic. The reason is simple: oil keeps rising, driving up the costs of production and daily life and fueling inflation, which is draining liquidity from the crypto, gold, and U.S. stock markets. Brent crude is currently at 117, close to this year’s previous high of 120. But looking back, extremely high oil prices can’t be sustained for long. I can write a separate article explaining why when
post-image
ETH-1.10%
GLDX+0.88%
PAXG-0.94%
As of October, the U.S. consumer confidence index has fallen to 48.0—its lowest level since the historic low of 44.8 recorded in May 2026. This marks the third consecutive monthly decline and represents a 10.4% drop compared to a year ago. The primary sources of pressure on households are rising prices and diminishing purchasing power.
How should we, as individual investors, interpret this data?
While this weakness in consumer confidence may not appear directly related to cryptocurrencies, it is a crucial component of the macroeconomic equation that shapes risk appetite. A slowdown in consumer
post-image
BTC-1.20%
  • 1
⏳ WCTC S9 starts in 72 hours!
A total prize pool of up to 6,000,000 USDT, with team, individual, and PK competitions about to begin. Have you set your goal?
👥 Assemble your team and compete with your teammates for up to 3,200,000 USDT
📈 Get ready for the individual competition too, and vie for the rankings based on valid trading volume
🎁 Haven't registered yet? Log in to the event page and claim 1 free Lucky Launch chance
Cross asset boundaries and reach the pinnacle of trading.
⏰ Official start: 2026/10/26 16:00 (UTC+8)
Registration remains open after the start; the actual registration dea
post-image
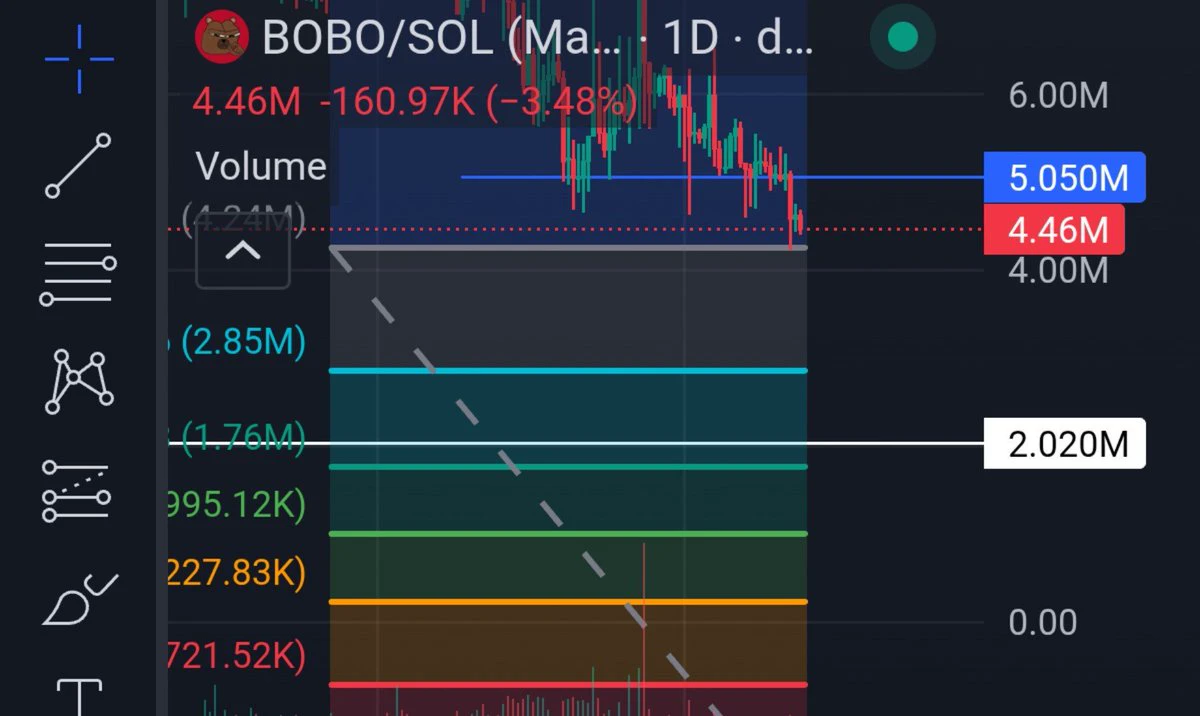
U won't want to believe me and that's fine
$BOBO
post-image
People on the street in this weather be like:
post-image
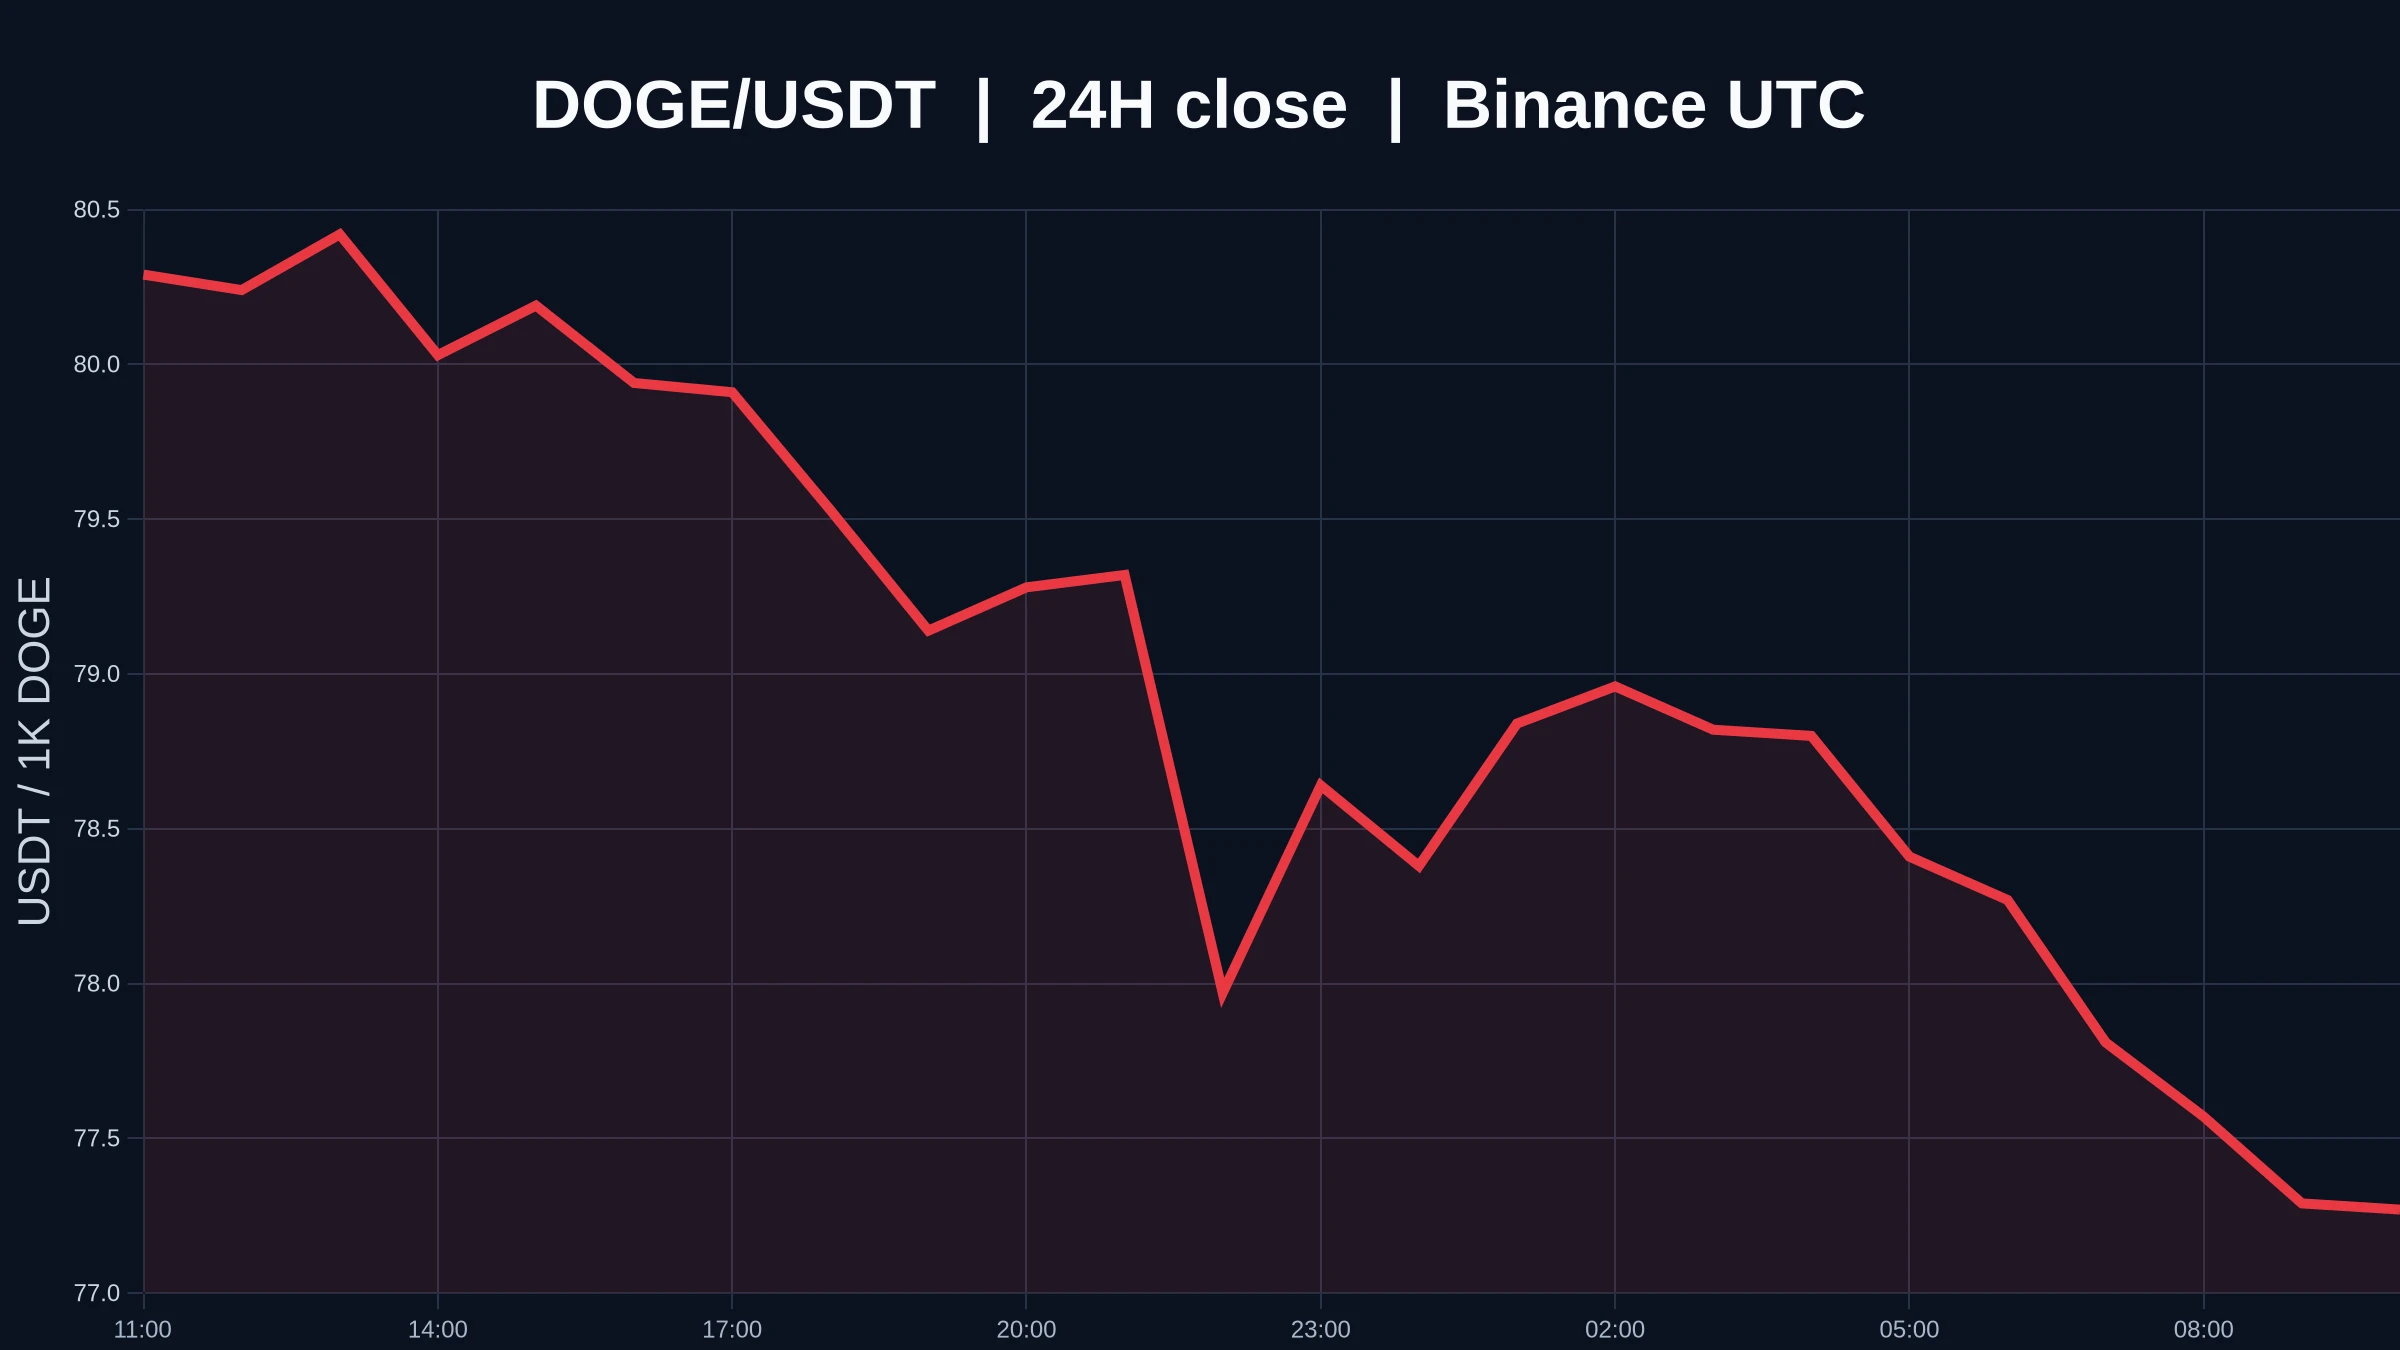
$DOGE fell 3.77% in 24 hours and is currently priced at 0.0773 USDT, but both the 1-hour and 4-hour trends are marked weak. This oversold divergence raises a question: the price has fallen a lot, but where are the signs of a bottom? Perhaps rebound demand has emerged, but it’s too soon to simply call a bottom before the structure stops weakening. The 1-hour support is at 0.07688, with resistance at 0.08053. The current price is near support, but the weak trend suggests bulls have yet to mount an effective counterattack, and downward momentum may not have fully played out. Trading participation
post-image
DOGE-2.80%
good morning, fellow bullrun enjoyers
post-image
$PEPE is currently trading at 0.00000437, down 11.00% over 24H (range: 0.00000434–0.00000511). The 1H trend is weak, with an RSI of 13; the 4H trend is weak, with an RSI of 45. If it breaks above 0.00000511 decisively, watch for further upside. If it falls below the 0.00000434 support, the short-term structure may weaken. The market is volatile; for observation only.
post-image
PEPE-10.49%
$LINK went from $7 to almost $16 between June and September.
Now it's cooling off above $10. That's the level to watch 👀
They actually fired their top salesperson? 🤣
post-image
International Oil Price rose significantly on October 23
live-cover
LIVE2,214
🔥 Guys, $WET has officially taken off, with the price surging sharply from the bottom on strong buying pressure and extremely high momentum. The breakout from the consolidation range was clean, and buyers are now fully in control.
After such a strong rally, a slight pullback or brief consolidation is normal; as long as the price holds above the previous breakout area, the trend remains bullish. Key support: $0.070 – $0.067. Resistance / next targets: $0.077 - $0.080 – $0.085. If momentum continues, the outlook is bullish. The trend favors further upside. Avoid chasing a big green candle; wai
post-image
WET+6.02%
🚨 $490,000,000+ IN CRYPTO LIQUIDATIONS IN 24 HOURS
Longs: $350,000,000+
Shorts: $141,000,000+
Longs accounted for roughly 71% of total liquidations
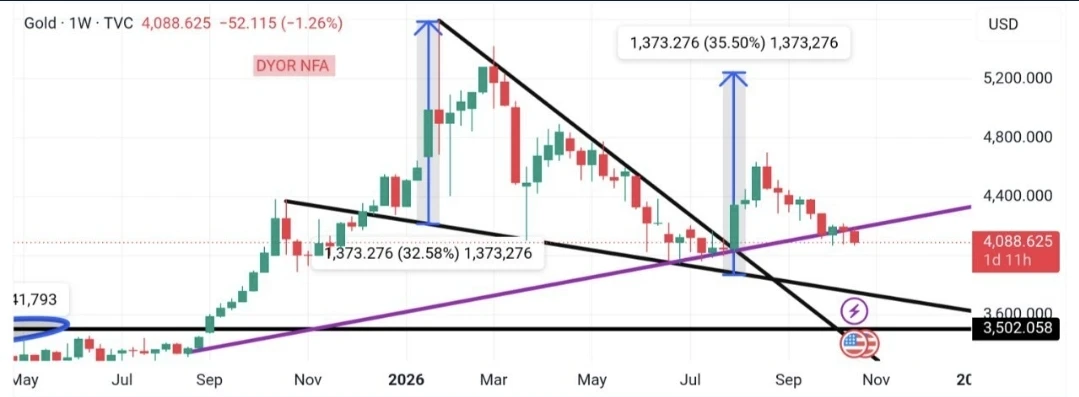
💥💥 Wedge Breakout: Gold Retests Ascending Trendline Support
Analyzing the Gold weekly chart structure, price action recently broke out above the black descending wedge resistance pattern.
Following the breakout, price action initiated a strong expansion move toward higher technical levels before undergoing a corrective pull-back to retest the multi-year purple ascending trendline support. Currently, price action is consolidating along this key purple trendline support zone.
A sustained hold above the purple ascending trendline support could potentially allow price action to regain upward mom
post-image
BTC-1.20%
  • 3
Gold Prices Retreat in Stages: How Should Positions Entered at Higher Levels Be Adjusted?
After surging this week, gold prices began a sustained pullback, breaking through key support levels one after another and testing the 3968 area at the lows. Many traders who entered above 4070 are now trapped. The market is seeing a slight rebound and consolidation, creating a window to adjust these positions.
A possible approach to managing trapped positions: The bearish trend on the two-hour timeframe has not reversed, and this rebound is merely a corrective move during the decline. For positions enter
post-image
XAU-0.93%
Load More

Join 40 M users in our growing community

⚡️ Join 40 M users in the crypto craze discussion

💬 Engage with your favorite top creators

👍 See what interests you

Trending Topics

USEarningsSeason

42.04k Views3.19k Discussing

The U.S. Q3 earnings season is in full swing, with major tech companies including Tesla and Meta reporting results. Market focus is shifting beyond revenue and profit toward AI spending, capital expenditure, margins and forward guidance. Which company’s earnings are you watching most closely?

GateWCTCS9GlobalTradingCompetition

529.89k Views7.8k Discussing

USConsumerSentimentNearRecordLow

1.48k Views160 Discussing

View More