Square
Following
Hot
News
Notifications
Profile
Share your thoughts
placeholder
Article
$LYN A long opportunity is taking shape.
Entry range: 0.02011 – 0.02056 Target: 0.02148 – 0.02240 Defense level: 0.01931
Technically, the RSI has fallen into deeply oversold territory, while the Delta indicator is showing positive divergence. Together, these two signals usually point to a decent chance of a short-term rebound.
But let’s be clear: the broader trend is still dominated by bears. The 0.02039 support level is critical—a break below it could trigger a cascade of liquidations.
Don’t get carried away. Position sizing always comes first; trade according to what your account can handle
post-image
LYN-0.44%
What does this mean???? What does it actually mean? Did anyone understand it?
Trenches
牛逼
牛
bade
b
牛逼
0x96...7777
Market Cap
$.
Change
.
24h Vol
$.
Holders
.
ZIG
Z
bade
b
ZIG
0x8c...1145
Market Cap
$.
Change
.
24h Vol
$.
Holders
.
BTC
B
bade
b
BTC
C5xp...pump
Market Cap
$.
Change
.
24h Vol
$.
Holders
.
STONK
S
bade
b
STONK
6GmA...UNgx
Market Cap
$.
Change
.
24h Vol
$.
Holders
.
fxUSD
f
bade
b
fxUSD
0x08...d8f6
Market Cap
$.
Change
.
24h Vol
$.
Holders
.
🔹Apple Steps Up Its AI Race! The CEO Pushes Software Teams to Move Faster, with Siri No Longer the
live-cover
LIVE1,837
$PEPE Currently trading at 0.00000506, up 3.48% over 24H (range: 0.0000048–0.00000519). The 1H trend is strong, with RSI at 54; the 4H trend is strong, with RSI at 56. If the price breaks above 0.00000519 decisively, watch for further upside. If it falls below the 0.0000048 support level, the short-term structure may weaken. Market volatility is high; for observation only.
post-image
PEPE+0.97%
Today's ETH outlook🎊$ETH
The rebound amid profit-taking was merely a corrective move after the sharp drop, not a reversal, and the overall bearish structure remains intact. Selling pressure continued to emerge after the rebound, pushing prices lower again and confirming the previous trend assessment.
#美股AI板块遭遇重挫
ETH-1.26%
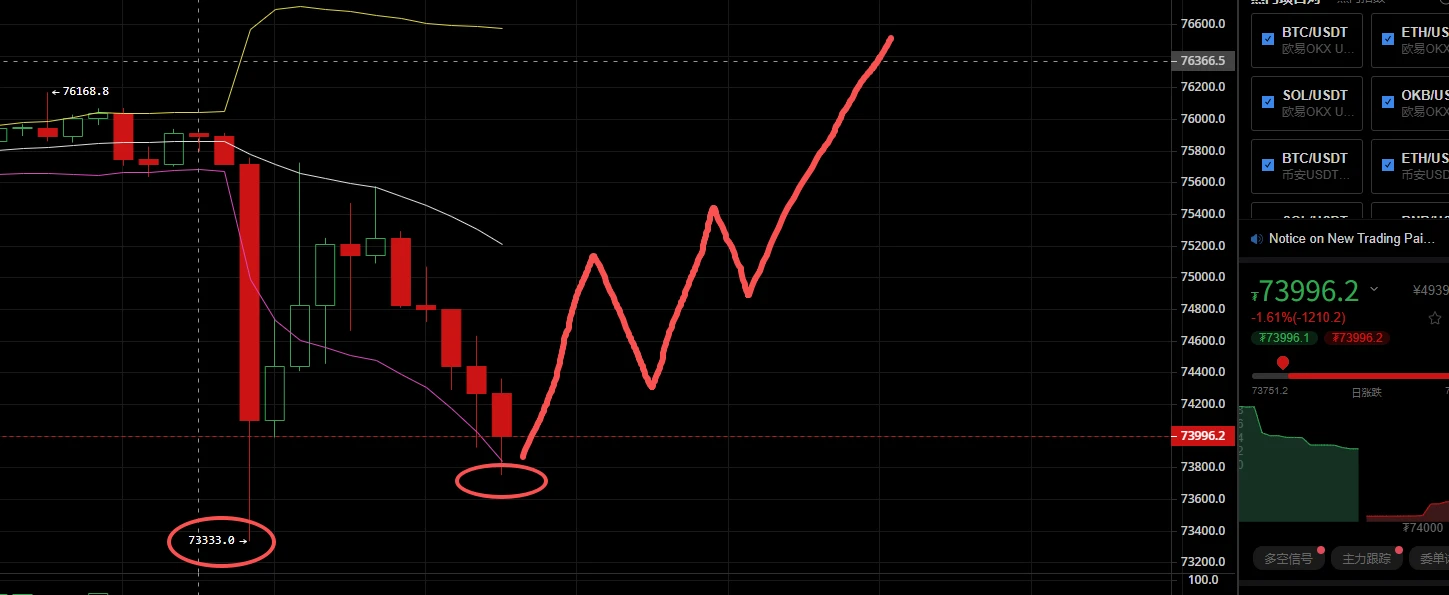
I've seen this Bitcoin price action before: after every accelerated drop comes a second bottom, and once that second bottom is in, a strong rebound begins. It's currently in the second retest, which is also a bear-trap pattern. Once confirmed, it'll take off!$BTC ‌
post-image
BTC-0.65%
🇺🇸🏛️ DEMOCRATS PLAN PROBES INTO ELON MUSK, STEPHEN MILLER & MAJOR COMPANIES!
Democrats plan congressional investigations after taking control of Congress in January. 🔍
↳ 🚀 Elon Musk over his role in DOGE.
↳ 🏛️ Stephen Miller over Trump’s immigration policies.
↳ 🏢 Major companies over alleged misconduct and business practices.
⚖️ A potential wave of congressional investigations lies ahead!
DOGE-0.22%
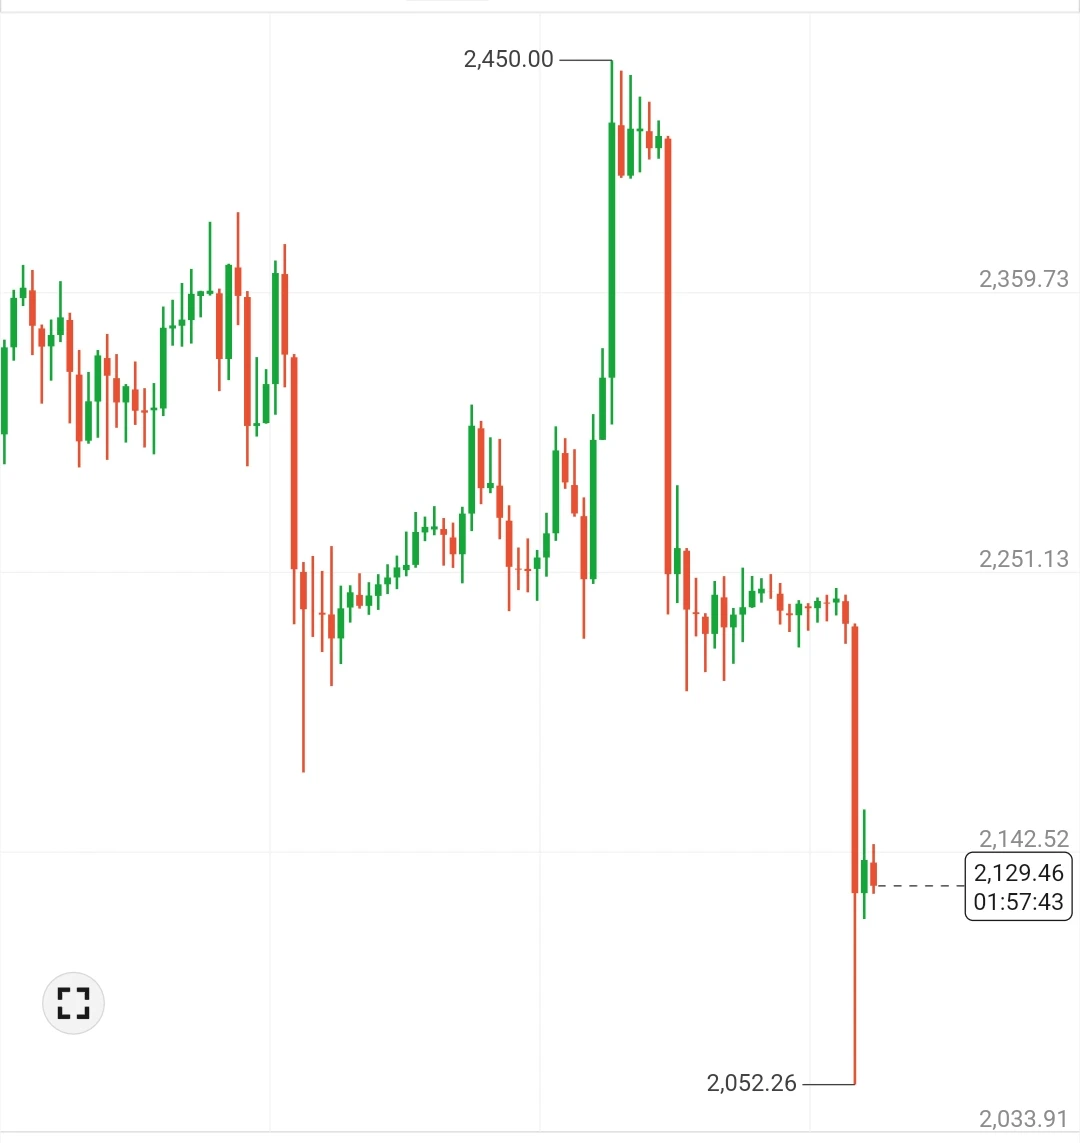
11.9 ETH Midday Market Analysis$BTC $GT $ETH

Ether has pulled back from its high of 2450, with four consecutive bearish 4-hour candles, breaking through the 2280 and 2200 support levels in succession and dipping to around 2050 at its lowest. The short-term structure has clearly weakened. However, after the sharp drop, signs of a low-level recovery have emerged on the 15-minute timeframe, and bearish momentum has been released quickly. The key now is not whether support has been broken, but whether the price can reclaim that level afterward—if it gets back above 2200, this sell-off can be con
post-image
BTC-0.65%
GT-2.24%
ETH-1.23%
A calm environment helps you perform better than one that is hyped-up, restless, and noisy, just as athletes need relaxed muscles to achieve outstanding results.
post-image
#BTCFlashCrash $BTC #ShareWeekly
Short answer first. I think this was a leverage flush, but a flush that landed on a weak spot, and that is why I’m not calling it finished.

What happened

Late Sunday, BTC fell about 2.8% in roughly 15 minutes, from near 75,600 to a low around 73,510, then recovered most of it. About $745 million was liquidated in one hour, and $715 million of that was longs. That is about 96% longs, and it works out to roughly $255 million of long liquidations for every 1% of price drop, by my math. Over the full 24 hours, different trackers show anywhere from $850 million t
BTC-0.65%
  • 6
Amniotic fluid is the biggest dividing line in life.
Getting reincarnated into the right family is a skill, too.
post-image
#USAIStocksHitHard
#美股史诗级抛售 #美股史诗级抛售 #ShareWeekly $NVDA $AMD $SPX
Thursday’s selloff is being called either “the end of the AI trade” or “just profit taking”. The numbers say neither. The cleanest way I can read it is to split the AI trade into three layers and look at what each one did.

What happened

The Nasdaq fell 5.5% into correction territory, the S&P 500 fell 4.4%, and the Dow dropped about 1,833 points. The semiconductor index fell about 12%, one of its largest one day drops on record. Nvidia lost 9%, which wiped out around $447 billion of value. AMD and Micron each fell about 17
NVDA+3.04%
AMD-0.02%
SPX+0.33%
  • 1
Good morning future crypto millionaires 🩵
New week. Plenty of opportunities.
Rise and shine.
post-image
  • 7
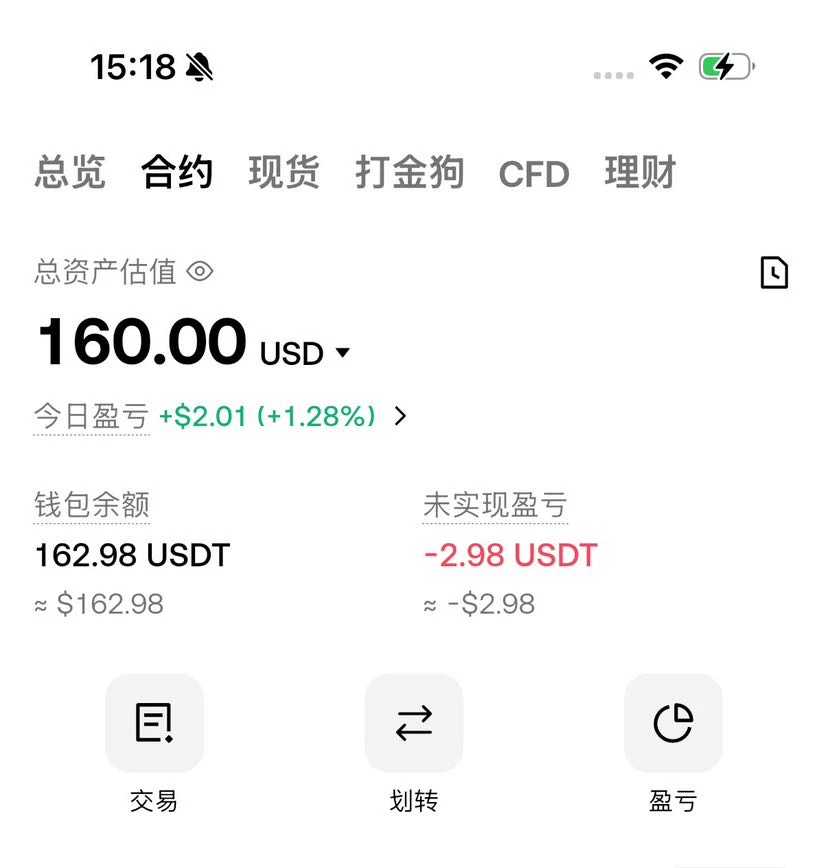
Everyone, today is day 88 of making a living through trading. My futures assets are currently 160U
Today is a nice round number
Learned a lesson: learn to forget some things
Keep building positions
post-image
Does anyone else like bouncy wings? I sure do.
The BTC short position paid off as expected: entered at 75364, exited at 74132
Over 200 points in the bag, with 4449.81U banked
No need to trade back and forth frequently; get the direction right and you’ll profit#红牛双车登上巴西领奖台 $BTC ‌
BTC-0.67%
A 73% bloodbath still isn’t enough! $SOXL This “fake short squeeze” is setting up the slaughter—retail traders, don’t catch a bloodied falling knife

A rebound during a plunge is just the big players handing you a rag to wipe their knives.

My take: Don’t be fooled—this is a classic fake short squeeze and real long liquidation. Look at the chart: 7D fund flows show net outflows of over 80 million; whales hold 141 million in short positions, with over 20 million in unrealized profits, while longs hold just 27 million. Retail traders are frantically buying the dip as the price falls 73%, while
SOXL-1.16%
The index surged 2,647 points intraday, breaking 42,000, but closed up just 1,960 points—was this long upper shadow on Taiwan stocks today a sign of strength or weakness? #Gate上线台股交易

Closing data (November 9, source: CNA / Economic Daily News / Commercial Times): The TAIEX closed at 41661.70 points, up 1960.06 points or 4.94%, marking the second-largest point gain at close in history; it hit an intraday high of 42349.36 points, at one point up 2647.72 points; trading volume was NT$837.929 billion.
Blue-chip stocks led the charge: TSMC closed at NT$2,235, up NT$100 (+4.68%), after hitting an
post-image
TSM+6.60%
Sudden flash crash before BTC’s weekly close! A wick down to $73,510, with $715 million in long posi
live-cover
LIVE4,343
Load More

Join 40 M users in our growing community

⚡️ Join 40 M users in the crypto craze discussion

💬 Engage with your favorite top creators

👍 See what interests you

Trending Topics

USCPIDataIncoming

28.2k Views1.84k Discussing

The U.S. October CPI report will be released on November 10 at 8:30 a.m. ET. September CPI came in at 3.7% year over year, and markets will be watching closely for signs that inflation is cooling, especially in core CPI. A softer-than-expected reading could strengthen rate-cut expectations, while hotter inflation may pressure risk assets through higher Treasury yields and a stronger dollar. How do you think this CPI print will move $BTC, U.S. stocks and gold?

RedBullDoublePodiumInBrazil

1.76k Views30.52k Discussing

BTCFlashCrash

72.71k Views66.22k Discussing
View More