




Square
Following
Hot
News
Notifications
Profile
Share your thoughts
placeholder
Article
It's time for a late-night meal, everyone 😋🍚
What is everyone up to this Saturday night? 😁
Time for late-night snacks, everyone. What is everyone busy doing on Saturday night? 😆
post-image
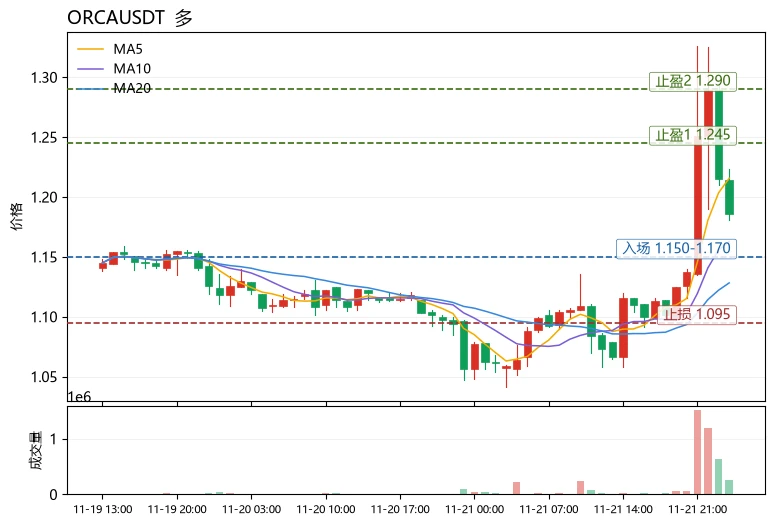
$ORCA Current price 1.184, 24h +11.17%, trading volume 5.5M USDT. MA5=1.2156 remains above MA20=1.1282, so the medium-term structure is intact, but the price has fallen below MA5, entering a short-term moving-average retest confirmation phase; the MACD histogram at +0.01431 remains bullish, with momentum still present but the histogram may contract; RSI at 57.6 is in the neutral-to-strong zone and has not reached overbought levels, leaving pullback room manageable; the upper Bollinger Band at 1.24503 is the main resistance, while the middle band provides dynamic support. The funding rate of -
post-image
ORCA-5.19%
HYPE+0.24%
PENGU+0.40%
Trenches
FIONA
F
bade
b
FIONA
B34n...pump
Market Cap
$.
Change
.
24h Vol
$.
Holders
.
IDOL
I
bade
b
IDOL
0x3b...ab07
Market Cap
$.
Change
.
24h Vol
$.
Holders
.
PIEVERSE
P
bade
b
PIEVERSE
0x0e...25a9
Market Cap
$.
Change
.
24h Vol
$.
Holders
.
CLAUDIA
C
bade
b
CLAUDIA
2j5S...W2ZM
Market Cap
$.
Change
.
24h Vol
$.
Holders
.
mihao
m
bade
b
mihao
4Cxj...pump
Market Cap
$.
Change
.
24h Vol
$.
Holders
.
#USNOVJoblessClaimsBeatExpectations
My view: This report modestly strengthens the case for future Fed rate cuts, but it is not strong enough to justify a change in monetary policy expectations on its own.

The key distinction is between a labor market that is gradually cooling and one that is deteriorating rapidly. The latest figures point more toward the first scenario.

1. What the jobless claims data tells us

Initial claims: 203,000 vs. 197,000 expected. A modest negative surprise, suggesting slightly weaker labor-market conditions.

Previous reading: revised from 200,000 to 202,000. This
BTC-0.67%
MRVL-11.63%
SMCI-9.01%
NVDA-13.84%
MU-13.88%
$SOXS Look at the candlesticks from the past few days in reverse and it becomes crystal clear: the tails along the bottom get shorter with each candle, and the wicks along the top do too. A shorter lower wick means the people testing lower prices have called it a day; a shorter upper wick means the people pushing up are only willing to stick out half a hand.

Both ends are shrinking, leaving only the body rising. This is called an upward Bollinger Band squeeze, the most typical pattern: nobody is dumping, nobody is running, volume is like a rising tide, and the price climbs on its own momentum
SOXS+1.46%
$H Wish me luck shorting the highs! I'll make back my spot losses with futures
post-image
H-2.00%
market update anyalsis btc and xrp
live-cover
LIVE2,368
BTC-0.67%
SOL-0.77%
XRP-1.15%
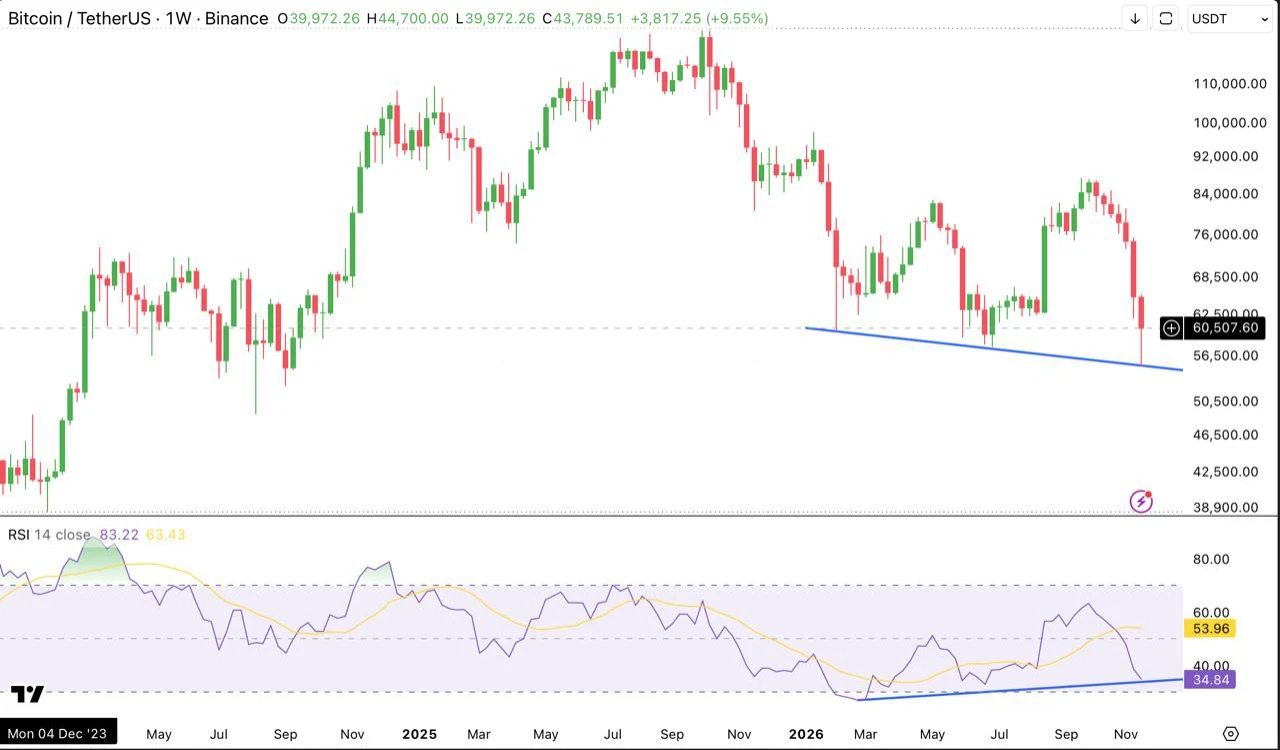
$BTC | A Bullish Divergence Worth Watching 👀

Bitcoin is showing a potentially powerful shift in weekly momentum.

Despite printing three consecutive lower lows since February, the weekly RSI continues to form higher lows, recovering from deeply oversold territory near 28 to around 35.

This bullish divergence suggests that selling pressure may be weakening, even as price struggles to find a solid bottom.

Key levels to watch:

- $62,500: Critical resistance and bullish confirmation.
- $68,500: First major upside target.
- $76,000: Next potential resistance.
- $56,500: Crucial support to pro
post-image
BTC-0.67%
  • 1
  • 1
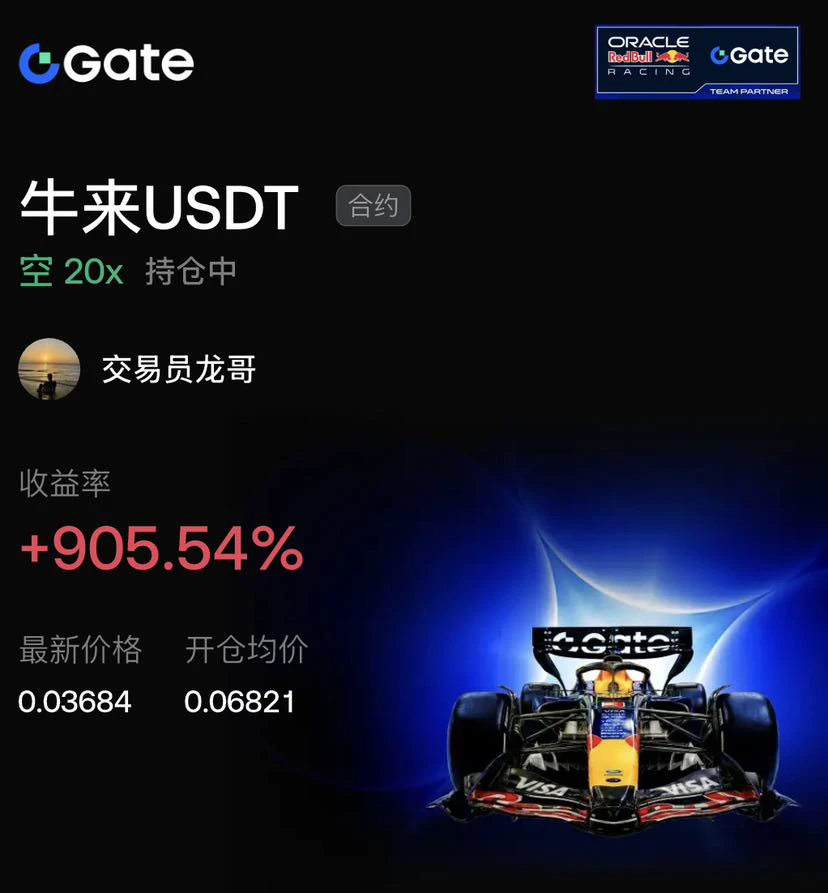
+905.54% floating profit came from precisely positioning against resistance at the top. This asset turned sharply after meeting resistance at 0.06821, with a bearish moving average crossover and rising volume. I entered a 20x short, and then bears drove the price down to 0.03684, completing the main downward wave in one sweep. Bears are completely in control of the market.

The current profit cushion is substantial, but prices at low levels are prone to a technical rebound. Bearish sentiment is highly unanimous. At 20x leverage, a sudden wick can happen at any time, leaving no safety cushion w
post-image
BTC-0.65%
ETH-1.23%
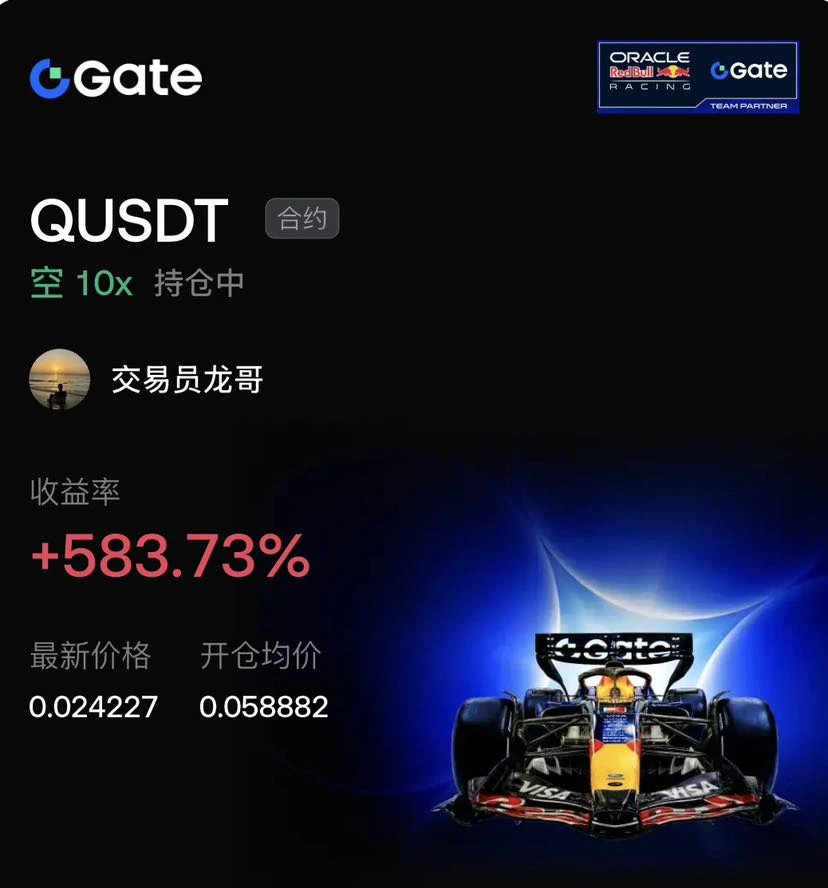
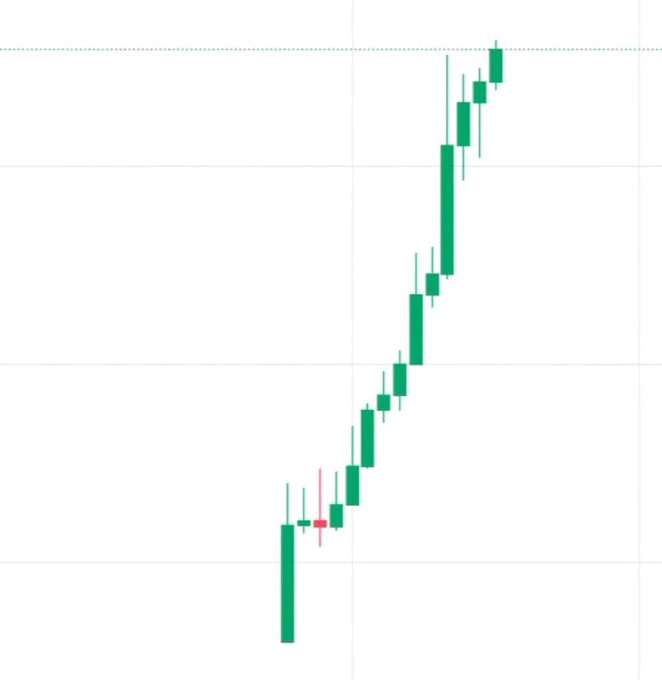
$Q This sell-off had very clear drivers. I opened a 10x leveraged short at 0.058882, and the price plunged all the way to 0.024227, with unrealized gains exceeding 583%. Reviewing the chart: volume contracted as the price moved sideways at the highs, and bulls lacked the strength to push it higher. Seeing strong resistance form at the moving averages, I followed through decisively when the price touched them and turned downward. The subsequent decline continued steadily, and I captured the full main downtrend. 10x leverage amplified the gains, but also put my ability to stay composed while hol
post-image
Q-27.77%
BTC-0.65%
ETH-1.23%
9 Ways to Trade Anthropic ($ANT) on Gate: A Complete Guide for Modern Traders

Anthropic ($ANT) is now available with a range of flexible trading options on Gate. Whether you are a beginner or experienced trader, the platform offers a variety of instruments to suit your style and risk tolerance. Here are 9 ways to trade ANT:

1. Spot Trading – XStock (ANTX/USDT)
Anthropic shares tokenized through xStocks. No leverage, making it suitable for investors seeking direct exposure to ANT shares, with high liquidity and 24/7 trading.

2. Spot Trading – GStock (ANTG/USDT)
Gate’s own tokenized version o
post-image
ANT-8.68%
GSTOCKBSC-12.80%
ONDO-0.29%
  • 2
  • 2
People my age are building families.
Me? Still chasing green candles and avoiding liquidation. 😂
post-image
👀 Which #Memecoin are you betting on for the NEXT MASSIVE PUMP? 🚀🔥
I'm looking for the next hidden gem with HUGE potential!
Drop your strongest ticker below and tell us WHY it's your top pick. 👇
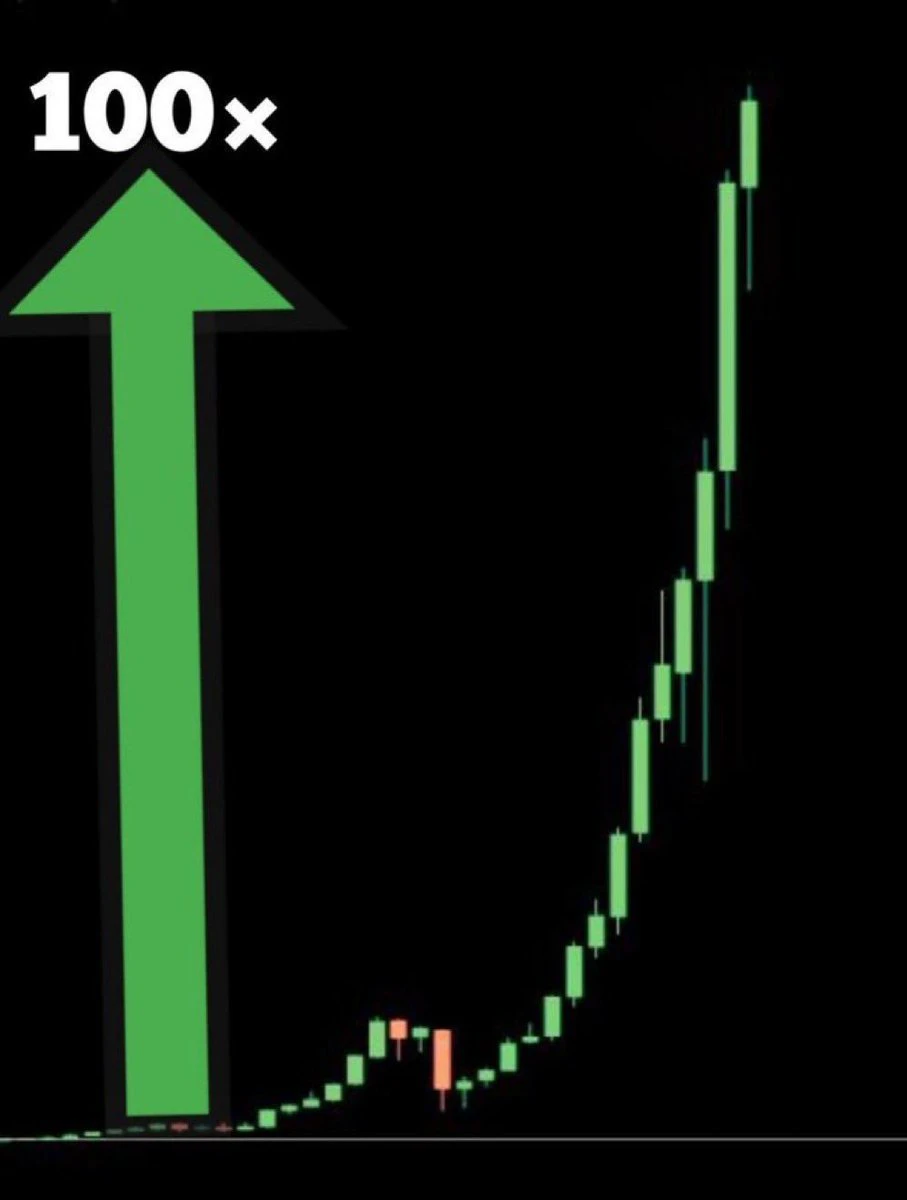
Let's find the next 100X GEM! 💎🚀
#Memecoins #Crypto
post-image
MEME-0.94%
Name a #memecoin that you think can do #100x in just one year: ⁉️
post-image
MEME-0.94%
El Salvador bought another BTC for its Strategic Bitcoin Reserve today 🇸🇻

They now own 7,841 BTC! 👏

$BTC ‌#BTCBreaksBelow60K #ShareWeekly
post-image
BTC-0.67%
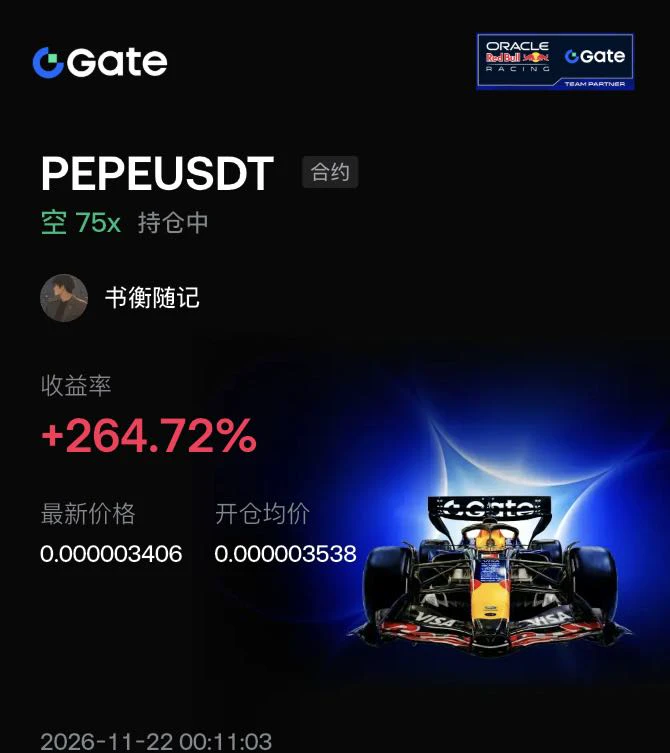
$PEPE The key in this downturn is not to get baited by the small rebounds along the way.

I opened a short position around 0.000003538, and it is now up more than 2x.

At the time, the 4-hour chart was already weakening consistently, and the price was unable to break above the moving averages. Each rebound was followed by a fresh decline.

In this kind of market, I’d rather wait for a rebound to near resistance to look for short opportunities than casually go long while prices are falling.

The market continued lower afterward, reaching a low around 0.000003167, and the overall trend also alig
post-image
PEPE+1.05%
BTC-0.65%
ETH-1.23%
  • 1
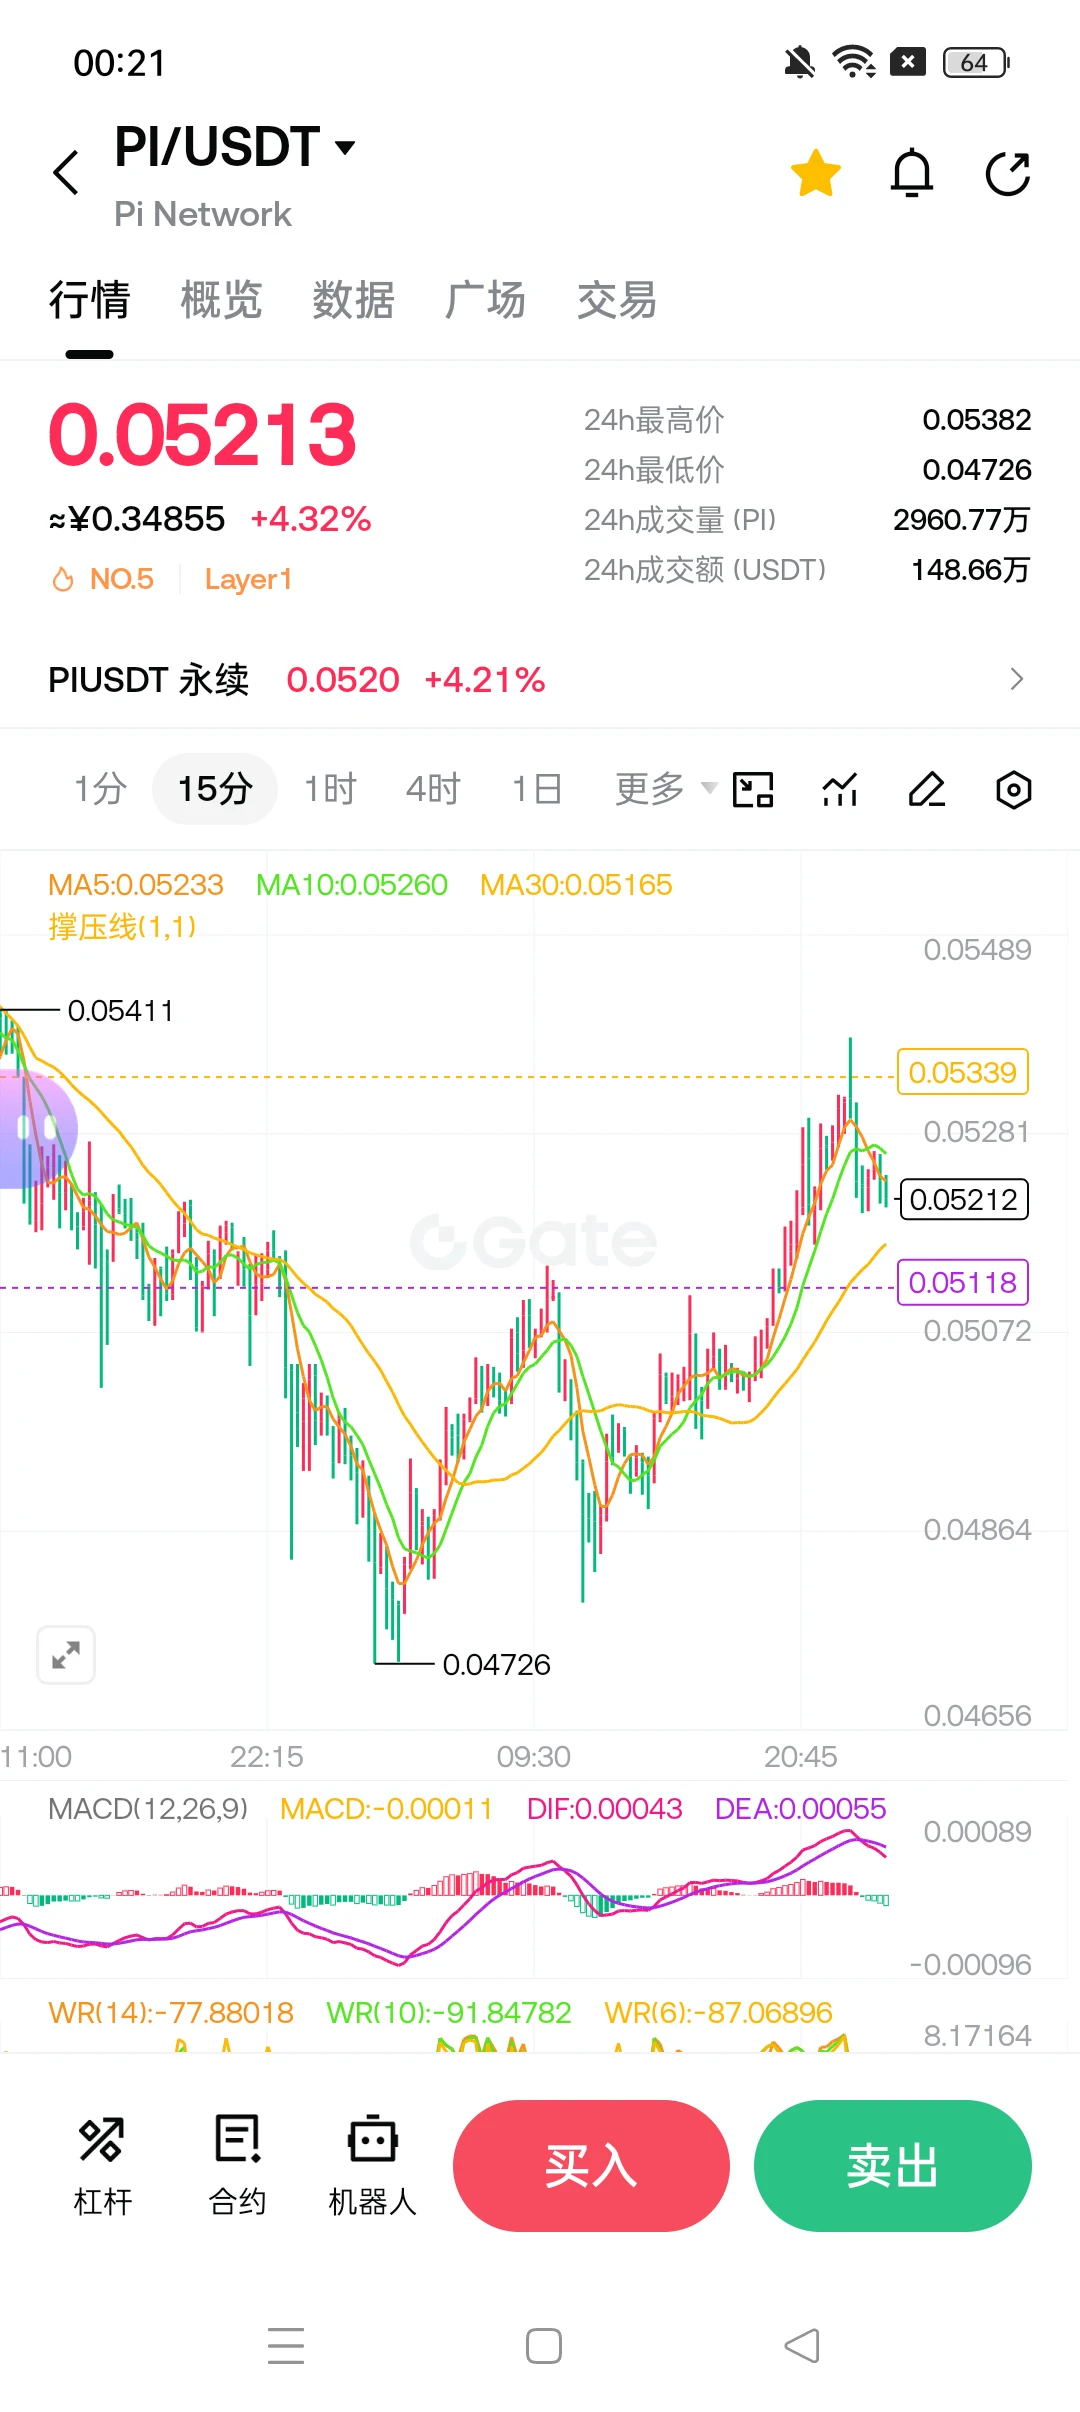
#pi
It’s the same setup as the July wick down to 0.07, then back to 0.1
It brutally wiped out a batch of gamblers afraid they’d miss the boat, only for the price to hit a new all-time low after the meeting about the grand narrative ended. In less than three months, it’ll be 0.02 per pi—I’m not surprised in the slightest. 🙀 Brothers who bought the dip and got on board, if you have the energy to flame me in the comments, you’d be better off going downstairs to buy a pack of cigarettes. The super-bubble hasn’t migrated yet. Good luck to you. The second round of slaughter is over. I’ll get on boa
post-image
PI-0.60%
  • 2
Anthropic ($ANT) direct IPO allocated shares have been credited to Gate stock accounts!
📊 This round's allocation results:
🔹 Total shares allocated: 92,100 ANT, with a total allocation value of 7,644,300 USDT
🔹 Overall allocation rate: approximately 5.03% (total value of shares allocated: 7,644,300 USDT / total subscription amount: 152 million USDT)
🔹 How to view: App home page - [Assets] - [TradFi] - [Stocks]

$ANT Gate stock trading is now live:
🔹 Stock ticker: $ANT
🔹 Earn boosted returns on idle funds, with 200% APR exclusively for new users; 5% APR on the 14-day plan

💬Share your go
GateSquare
Anthropic ($ANT) direct IPO allocated shares have been credited to Gate stock accounts!
📊 This round's allocation results:
🔹 Total shares allocated: 92,100 ANT, with a total allocation value of 7,644,300 USDT
🔹 Overall allocation rate: approximately 5.03% (total value of shares allocated: 7,644,300 USDT / total subscription amount: 152 million USDT)
🔹 How to view: App home page - [Assets] - [TradFi] - [Stocks]
$ANT Gate stock trading is now live:
🔹 Stock ticker: $ANT
🔹 Earn boosted returns on idle funds, with 200% APR exclusively for new users; 5% APR on the 14-day plan
💬Share your good news in the comments! Tell us about your allocation and subscription experience, or which company's IPO you're most looking forward to next.
Trade now: https://www.gate.com/stocks/ANT
Earn 5% APR: https://www.gate.com/zh/earn/simple-earn?asset=USDT&product_id=448&product_type_tag=3
View the official announcement: https://www.gate.com/zh/announcements/article/102884

repost-content-media
ANT-8.68%
  • 3
🔹 NVIDIA Interim CEO Colette Kress Faces a “Glass Cliff” as She Must Deal With Jensen Huang’s Legac
live-cover
LIVE1,980
BTC-0.67%
XAUUSD-2.40%
XAU+0.38%
ETH-1.23%
NVDA-0.35%
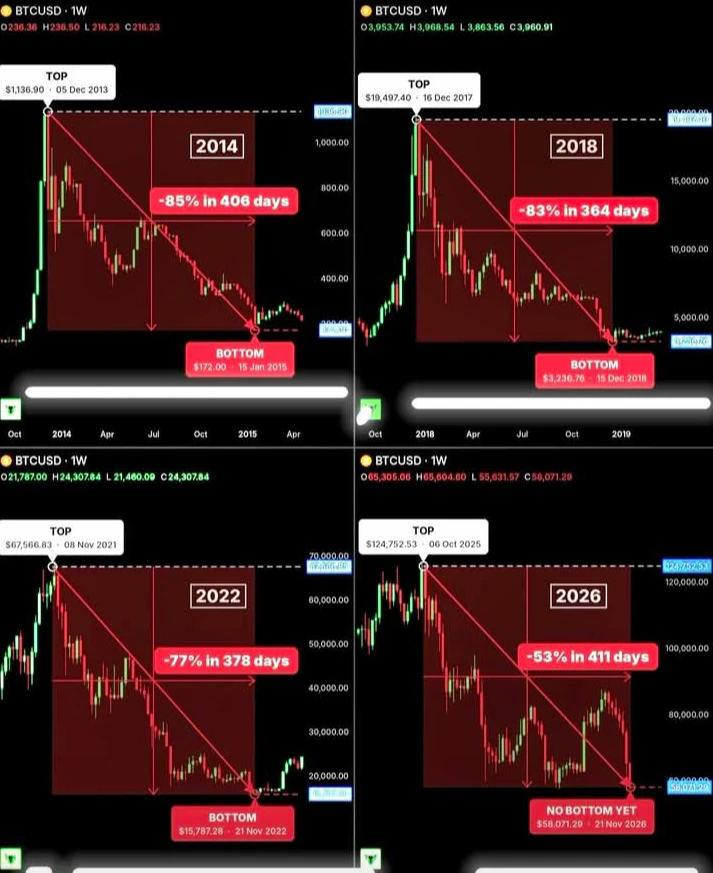
BITCOIN IS NOW IN THE LONGEST BEAR MARKET IN ITS HISTORY...

Every past bear market ended within 13 months of the top:

• 2014: -85% in 406 days 📈
• 2018: -83% in 364 days 📈
• 2022: -77% in 378 days 📈

Today, Bitcoin is on day 411, down 53% from its $124,753 peak.

That's already longer than every bear market before it.

If history repeats, the bottom could be very close.

#crypto #altcoins #ethereum #solana
post-image
BTC-0.67%
ETH-1.26%
SOL-0.77%
$BTC Fell below $58,000, then recovered to $60,000! That wick bottomed at $55,130. I’m starting to think the area around $55,000 could become this cycle’s bottom! One reason is that this pullback tested the four-year moving average. Now it comes down to whether buyers are willing to step in at higher levels! I’m watching the four-year moving average because during this cycle, buyers stepped in near this line during several sharp BTC pullbacks. This time, the price briefly fell below the average intraday, then rebounded from $55,130 to $60,530, up nearly 10% from the low. This rebound makes me
post-image
ZEC+1.16%
Load More

Join 40 M users in our growing community

⚡️ Join 40 M users in the crypto craze discussion

💬 Engage with your favorite top creators

👍 See what interests you

Trending Topics

BTCBreaksBelow60K

2.1M Views29.8K Discussing

BTC fell below $60,000 on November 20 for the first time since July, alongside a tech stock selloff and broader pressure on risk assets. Will $60K become resistance, or can BTC quickly reclaim it? What price or volume signals would convince you that selling pressure is easing?

GateDirectIPOPhase3ANTAllocates92100Shares

775.2K Views4.9K Discussing

NvidiaDropsNearly14Percent

325.2K Views7.6K Discussing

View More