Square
Following
Hot
News
Notifications
Profile

ZenobiaRox

vip
No content yet
Live TradingPeak Tier VIP 01.0 Year(s)
147
Following
61
Followers
211
Liked
🚨 $ANTFUN /USDT – Sellers Are Still in Control!

I'm watching $ANTFUN closely because the 15-minute chart is showing a clear bearish structure. Price has slipped to $0.011439, marking a fresh local low, while every recovery attempt is facing selling pressure.

The biggest concern is that price is trading below MA5, MA10, and MA30. MACD also remains negative, suggesting bearish momentum hasn't faded yet.

I'm not rushing into a long here. A breakdown continuation or a short-term relief bounce are both possible, but buyers need to prove their strength first. 👀

📍 Entry Level: $0.01148 – $0.01
post-image
ANTFUN+7.64%
$LIT /USDT – A Critical Moment for the Next Move!

I'm watching $LIT closely because the 15-minute chart is showing an interesting shift after the sharp drop toward $2.983. Buyers have stepped in, pushed price back up, and now LIT is consolidating around $3.086.

The moving averages are clustering near the current price, suggesting a potential breakout is approaching. But I want to see strong volume before trusting the next move. A clean push above $3.10 could bring fresh bullish momentum! 👀

📍 Entry Level: $3.075 – $3.090

🎯 TP1: $3.120
🎯 TP2: $3.160
🎯 TP3: $3.210

🛑 STOP LOSS: $3.045

post-image
LIT-4.56%
  • 2
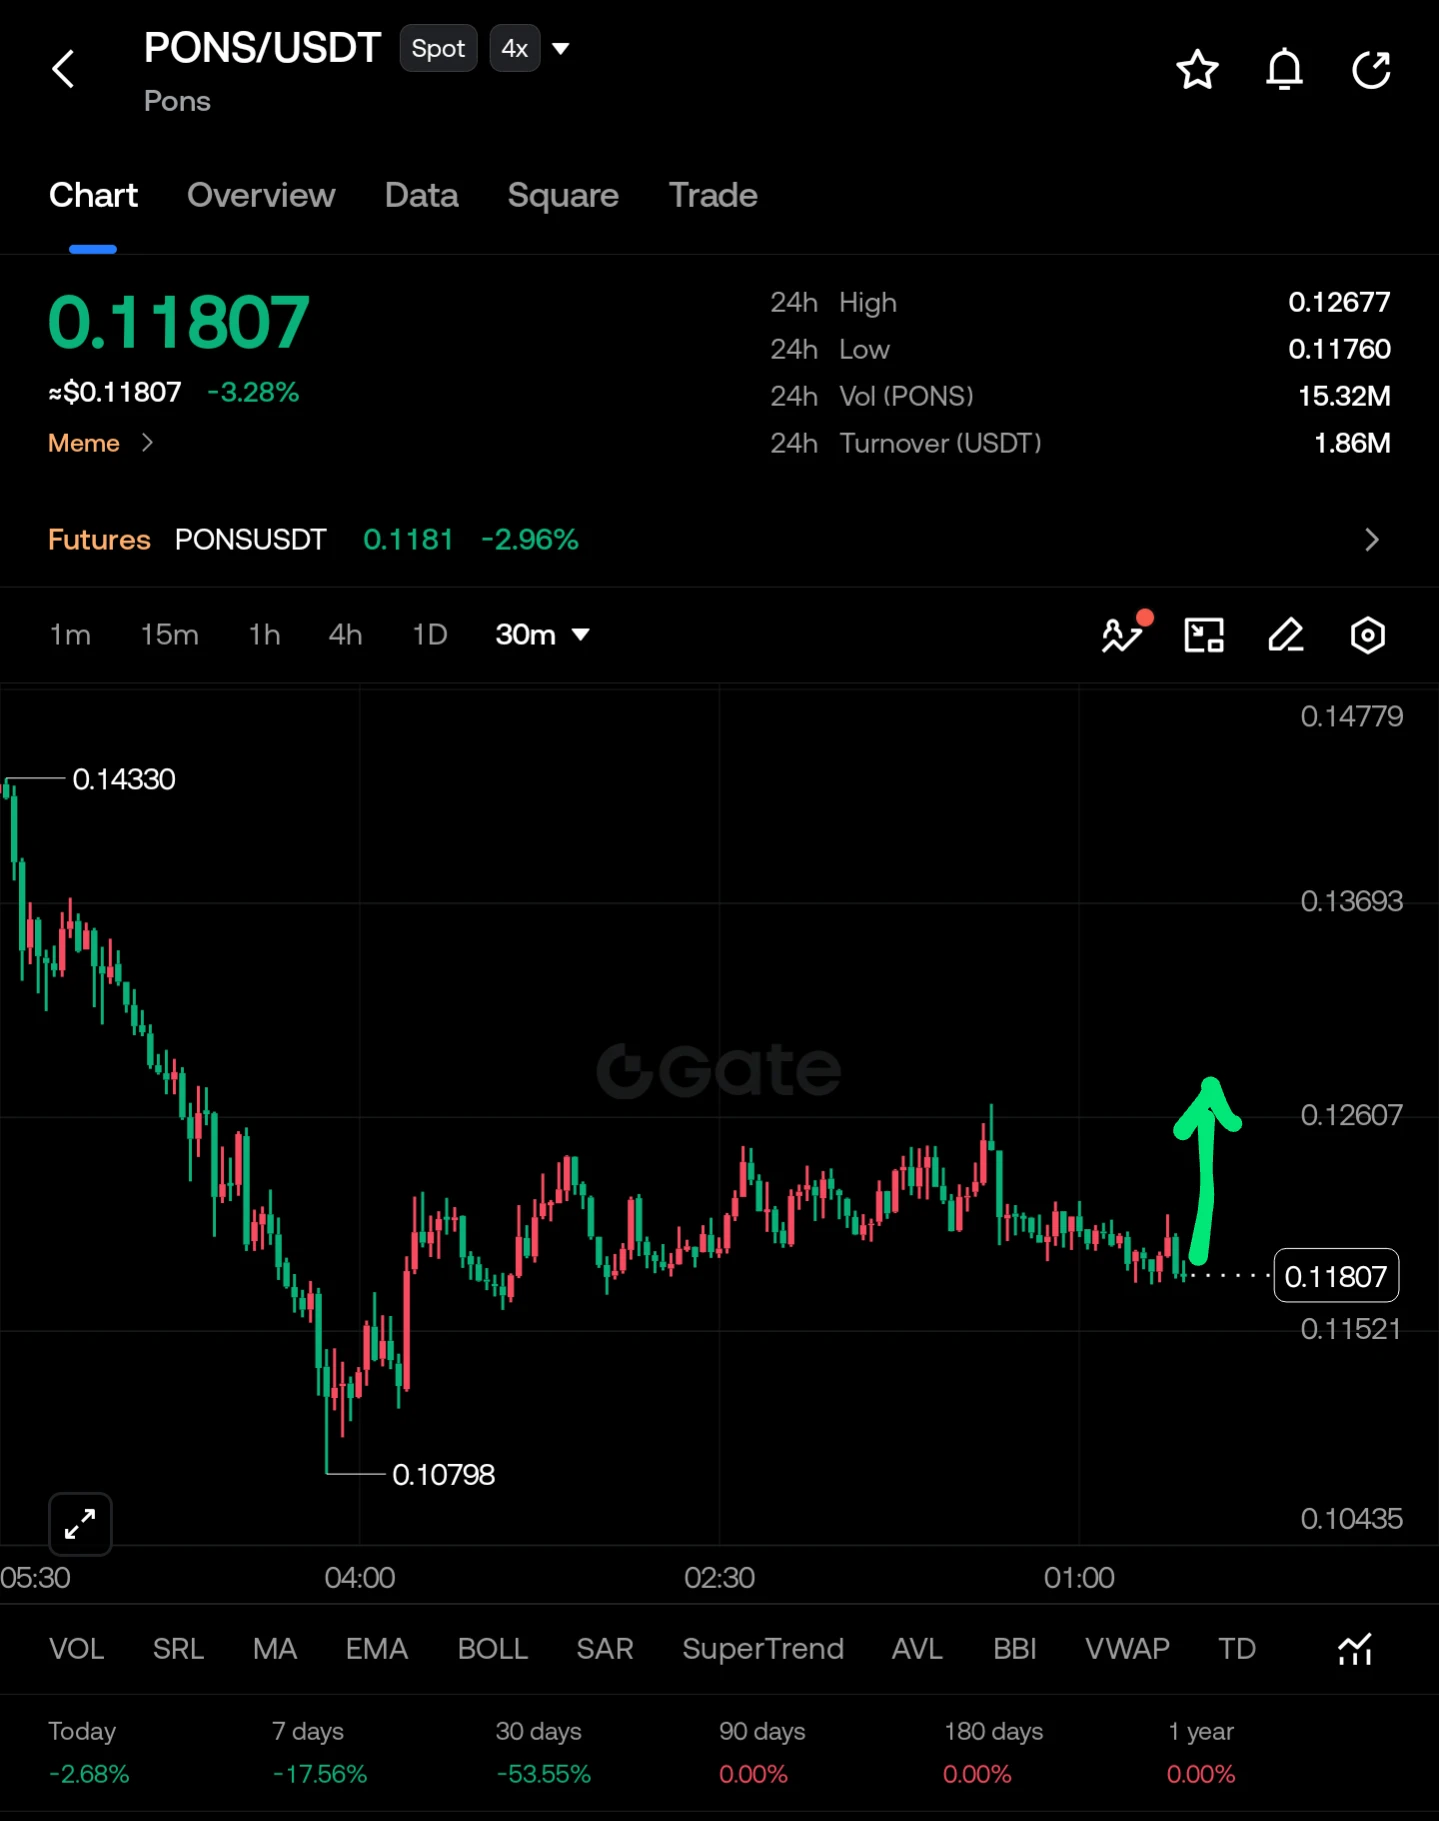
$PONS /USDT – Bulls Preparing for Another Move?

I'm watching $PONS closely because price is holding around the $0.1180 area after a significant decline. The chart is showing a consolidation phase, and buyers could be preparing for a push toward the $0.1260 resistance zone.

The key now is whether buyers can build enough momentum to break the recent range. A clean move above resistance could open the door for another upside leg. 👀

🎯 Entry Level: $0.1175 – $0.1190

🥇 TP1: $0.1215
🥈 TP2: $0.1240
🥉 TP3: $0.1260

🛑 STOP LOSS: $0.1148

⚡ What I'm Watching: A strong 30-minute candle close abo
post-image
PONS+4.32%
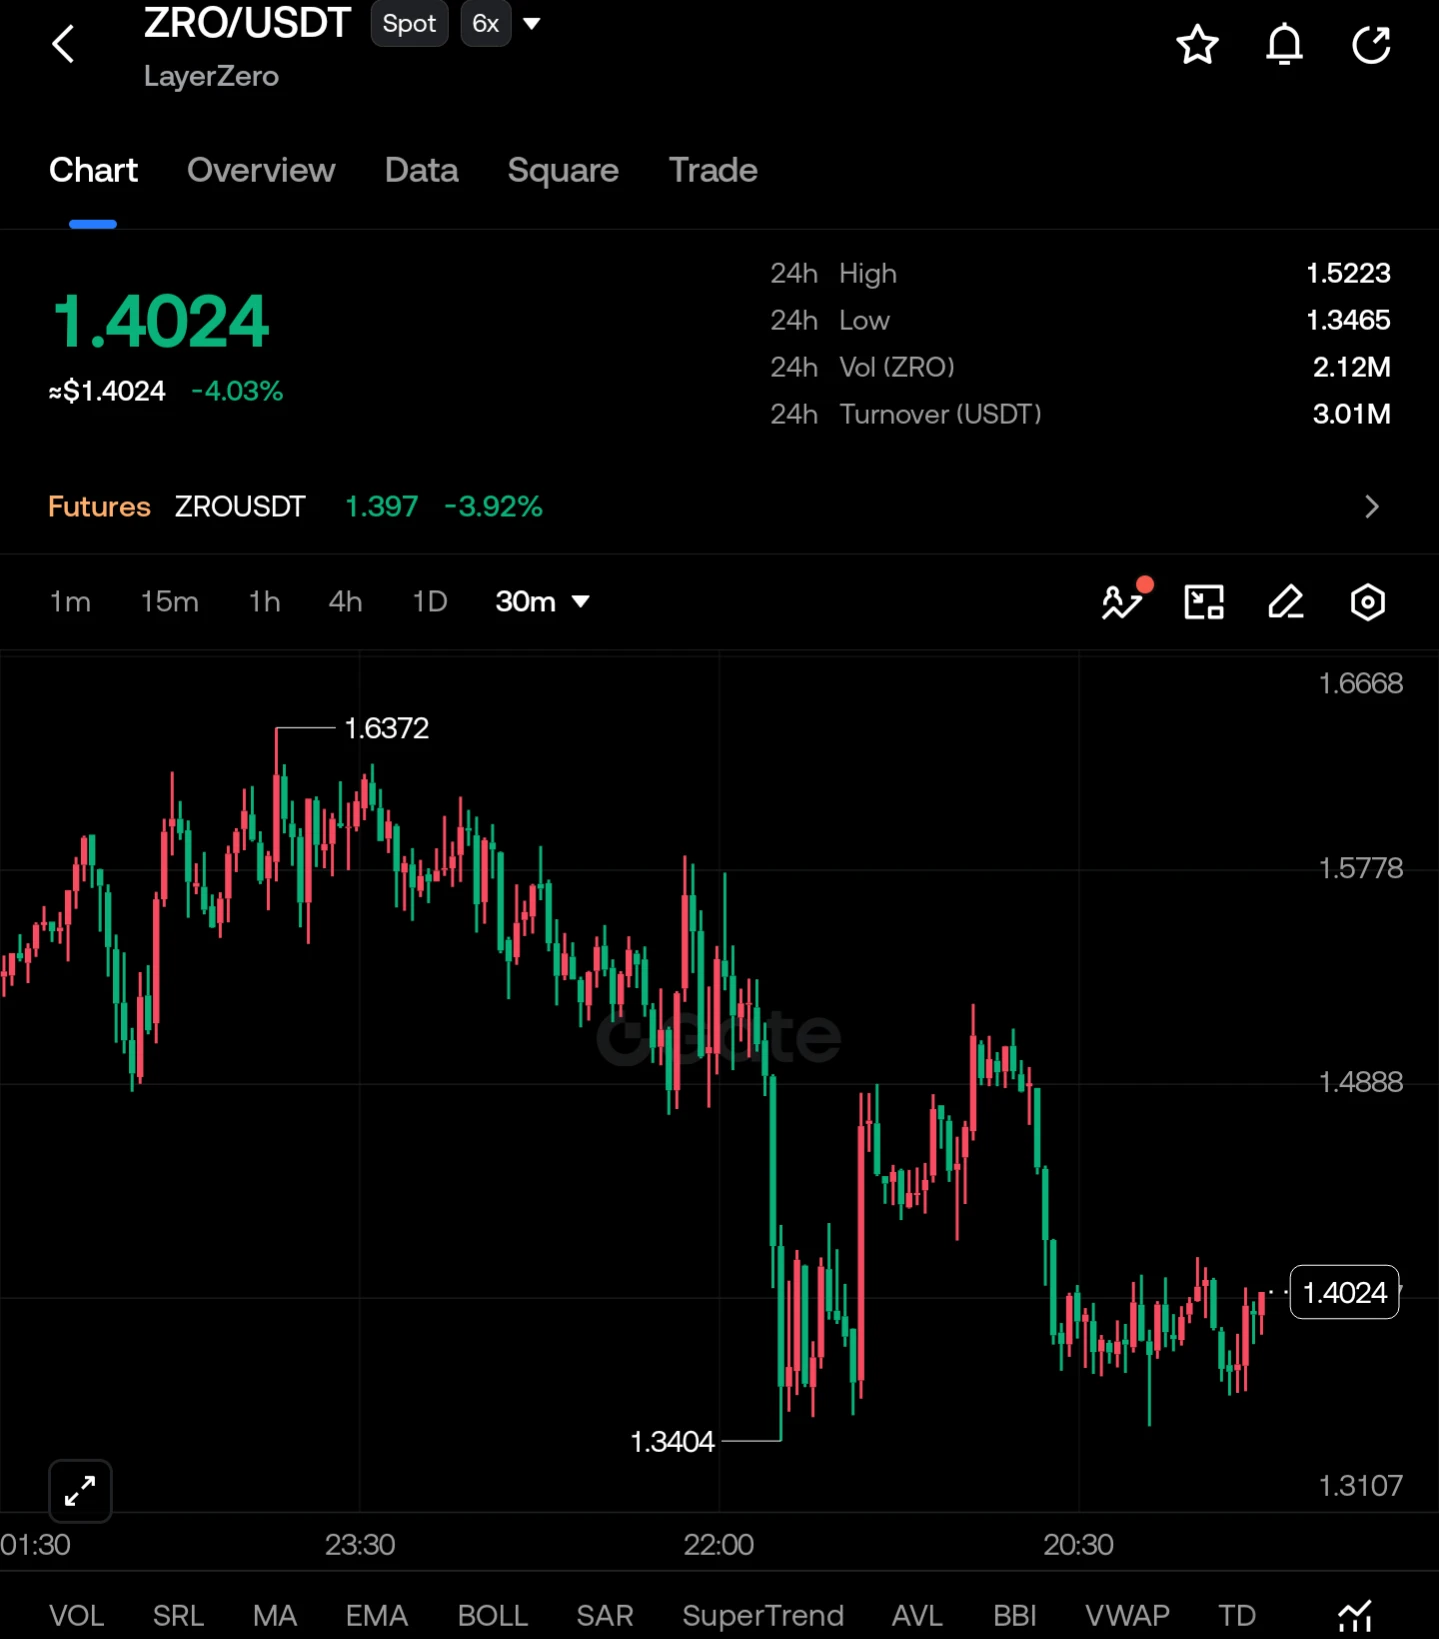
$ZRO – A Critical Support Battle Is Underway!

I'm watching $ZRO closely because price is showing an interesting reaction after a sharp sell-off. Bulls are trying to build a base around the $1.38–$1.40 area, but the overall 30-minute structure is still under pressure.

The key question now: Can buyers defend this support and push ZRO toward a meaningful recovery, or will sellers trigger another downside move?

I'm watching for a potential bounce, but confirmation is important. 👀

📊 Trade Setup – ZRO/USDT

🟢 Entry Level: $1.385 – $1.405

🎯 TP1: $1.445
🎯 TP2: $1.488
🎯 TP3: $1.525

🛑 STOP
post-image
ZRO-2.59%
  • 1
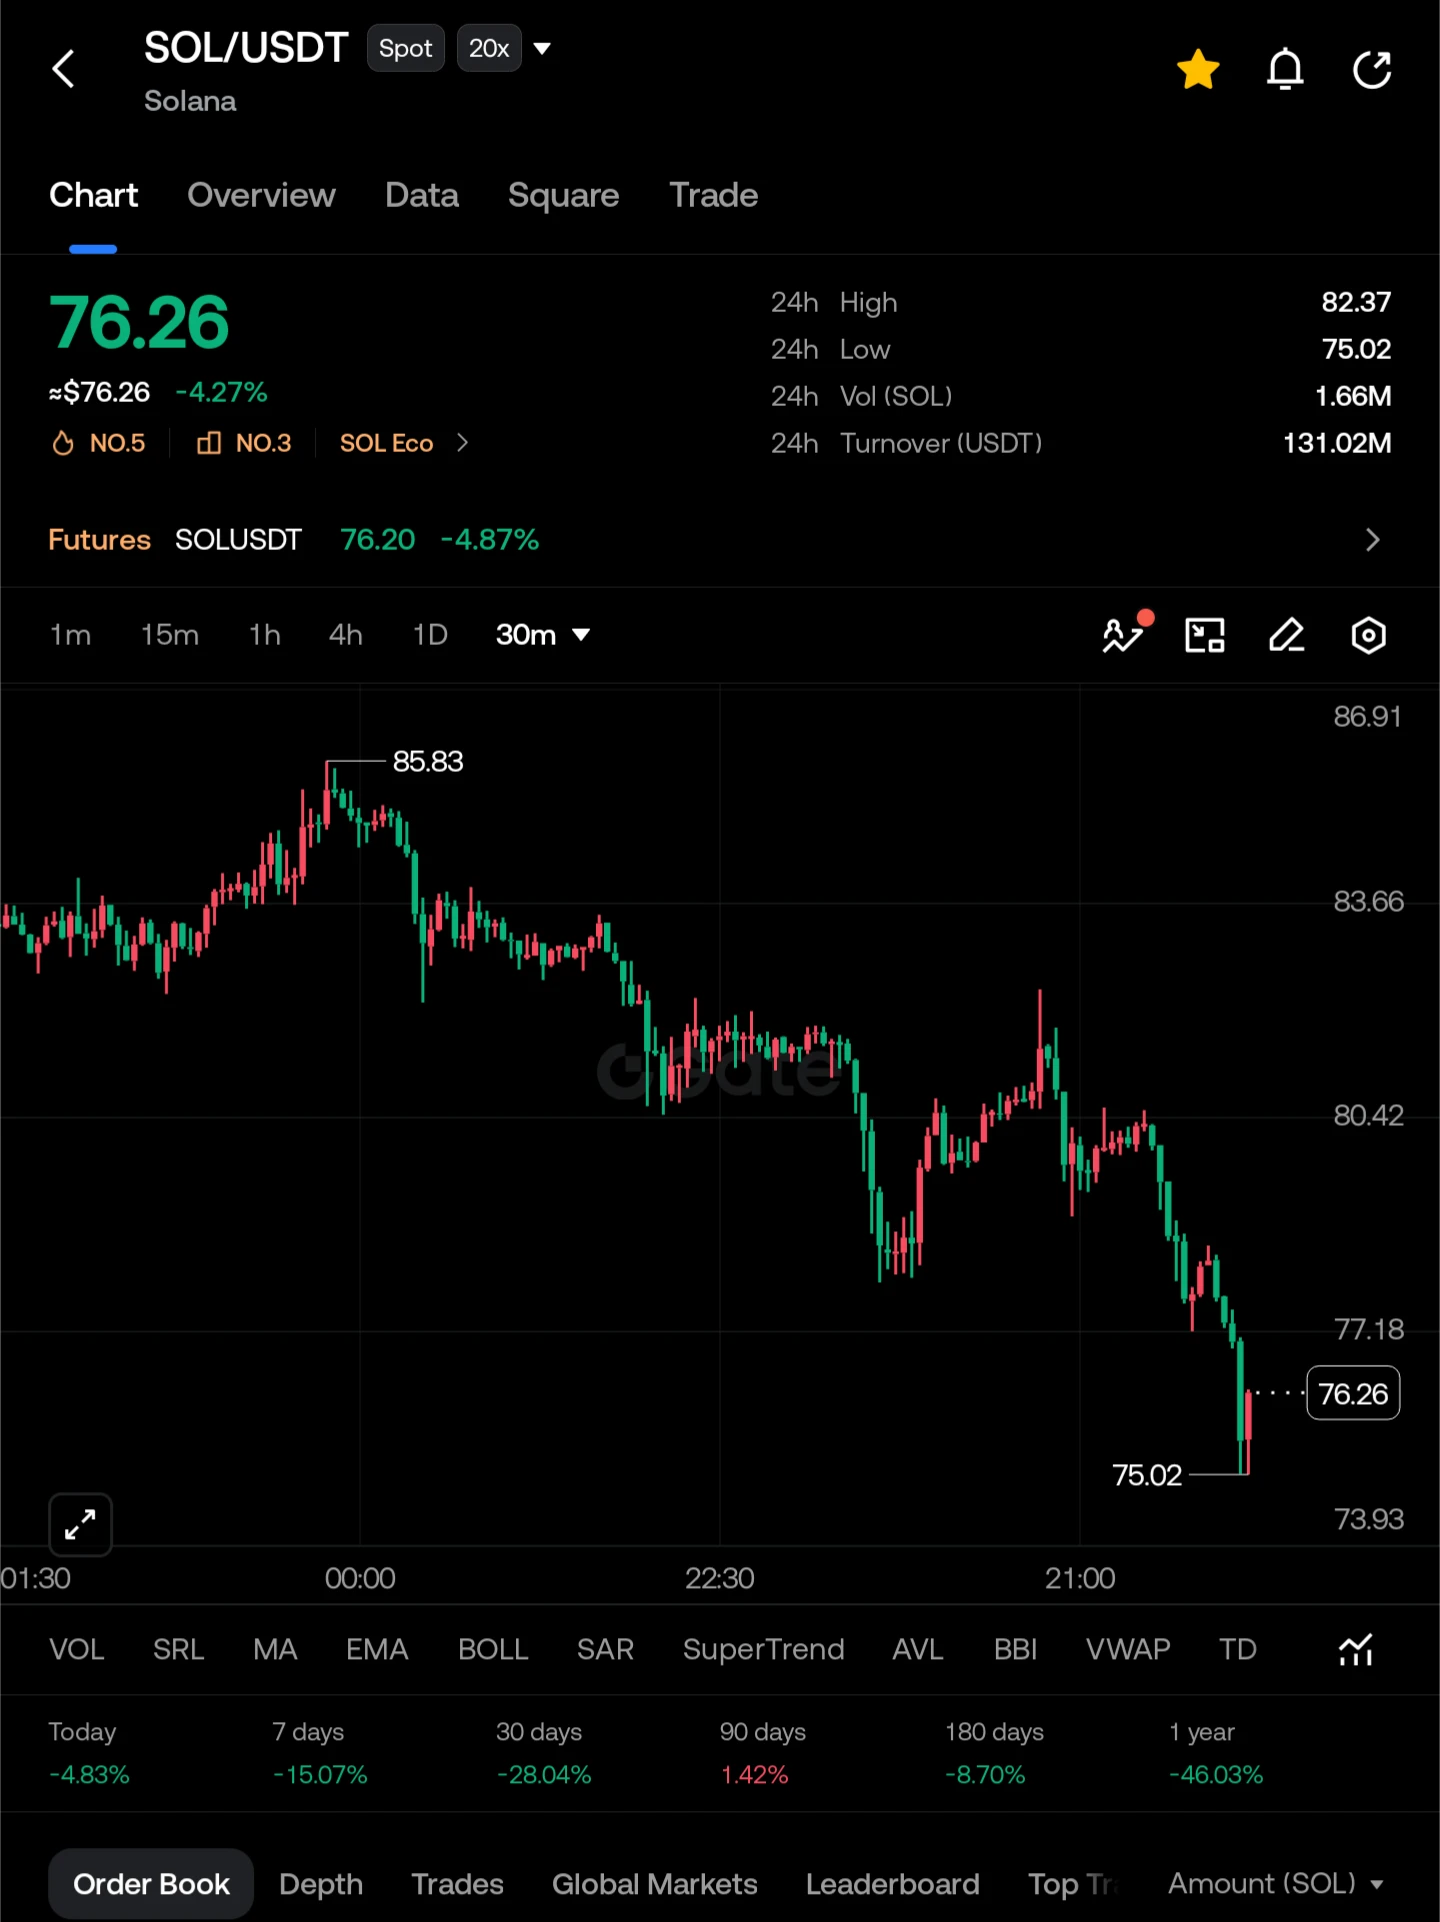
🚨 $SOL – BEARS ARE STILL IN CONTROL! ⚠️

I'm watching Solana closely because the 30-minute chart is showing serious selling pressure. SOL has dropped from the $85.83 region and recently swept down to $75.02 before attempting a small bounce.

What catches my attention is the weak recovery after such a sharp decline. Sellers still have the advantage unless bulls reclaim key resistance levels.

I'm looking for a possible SHORT opportunity on a relief bounce rather than chasing the current price.

🔴 Entry Level: $76.80 – $77.50

🎯 TP1: $75.20
🎯 TP2: $74.30
🎯 TP3: $73.50

🛑 STOP LOSS: $78.30
post-image
SOL-0.77%
  • 2
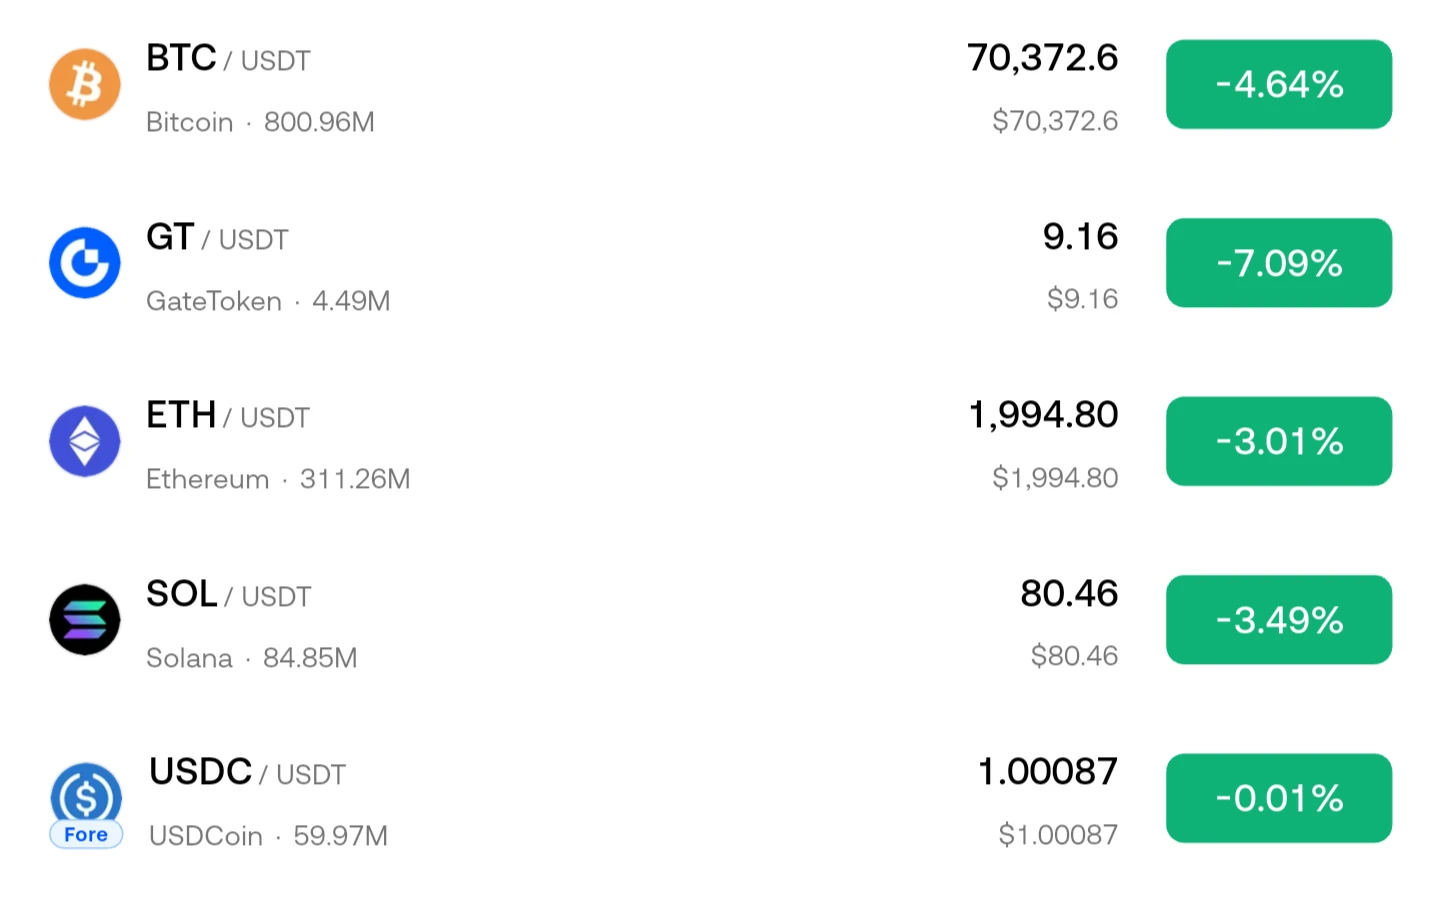
🚨 THE CRYPTO MARKET IS UNDER PRESSURE! BE READY!

I'm watching Bitcoin closely as the market takes another hit. BTC is trading around $70,372, down 4.64%, while ETH and SOL are also showing significant weakness.

📉 Market Snapshot:

- $BTC : $70,372 (-4.64%)
- $GT : $9.16 (-7.09%)
- $ETH : $1,994 (-3.01%)
- $SOL : $80.46 (-3.49%)
- $USDC : $1.00087 (-0.01%)

⚠️ Selling pressure is spreading across major assets. The next move could be important. I'm watching key support levels and waiting for confirmation before making any aggressive move.

Stay alert. Protect your capital. Don't let market v
post-image
BTC-0.67%
GT-2.41%
ETH-1.26%
SOL-0.77%
USDC+0.01%
  • 1
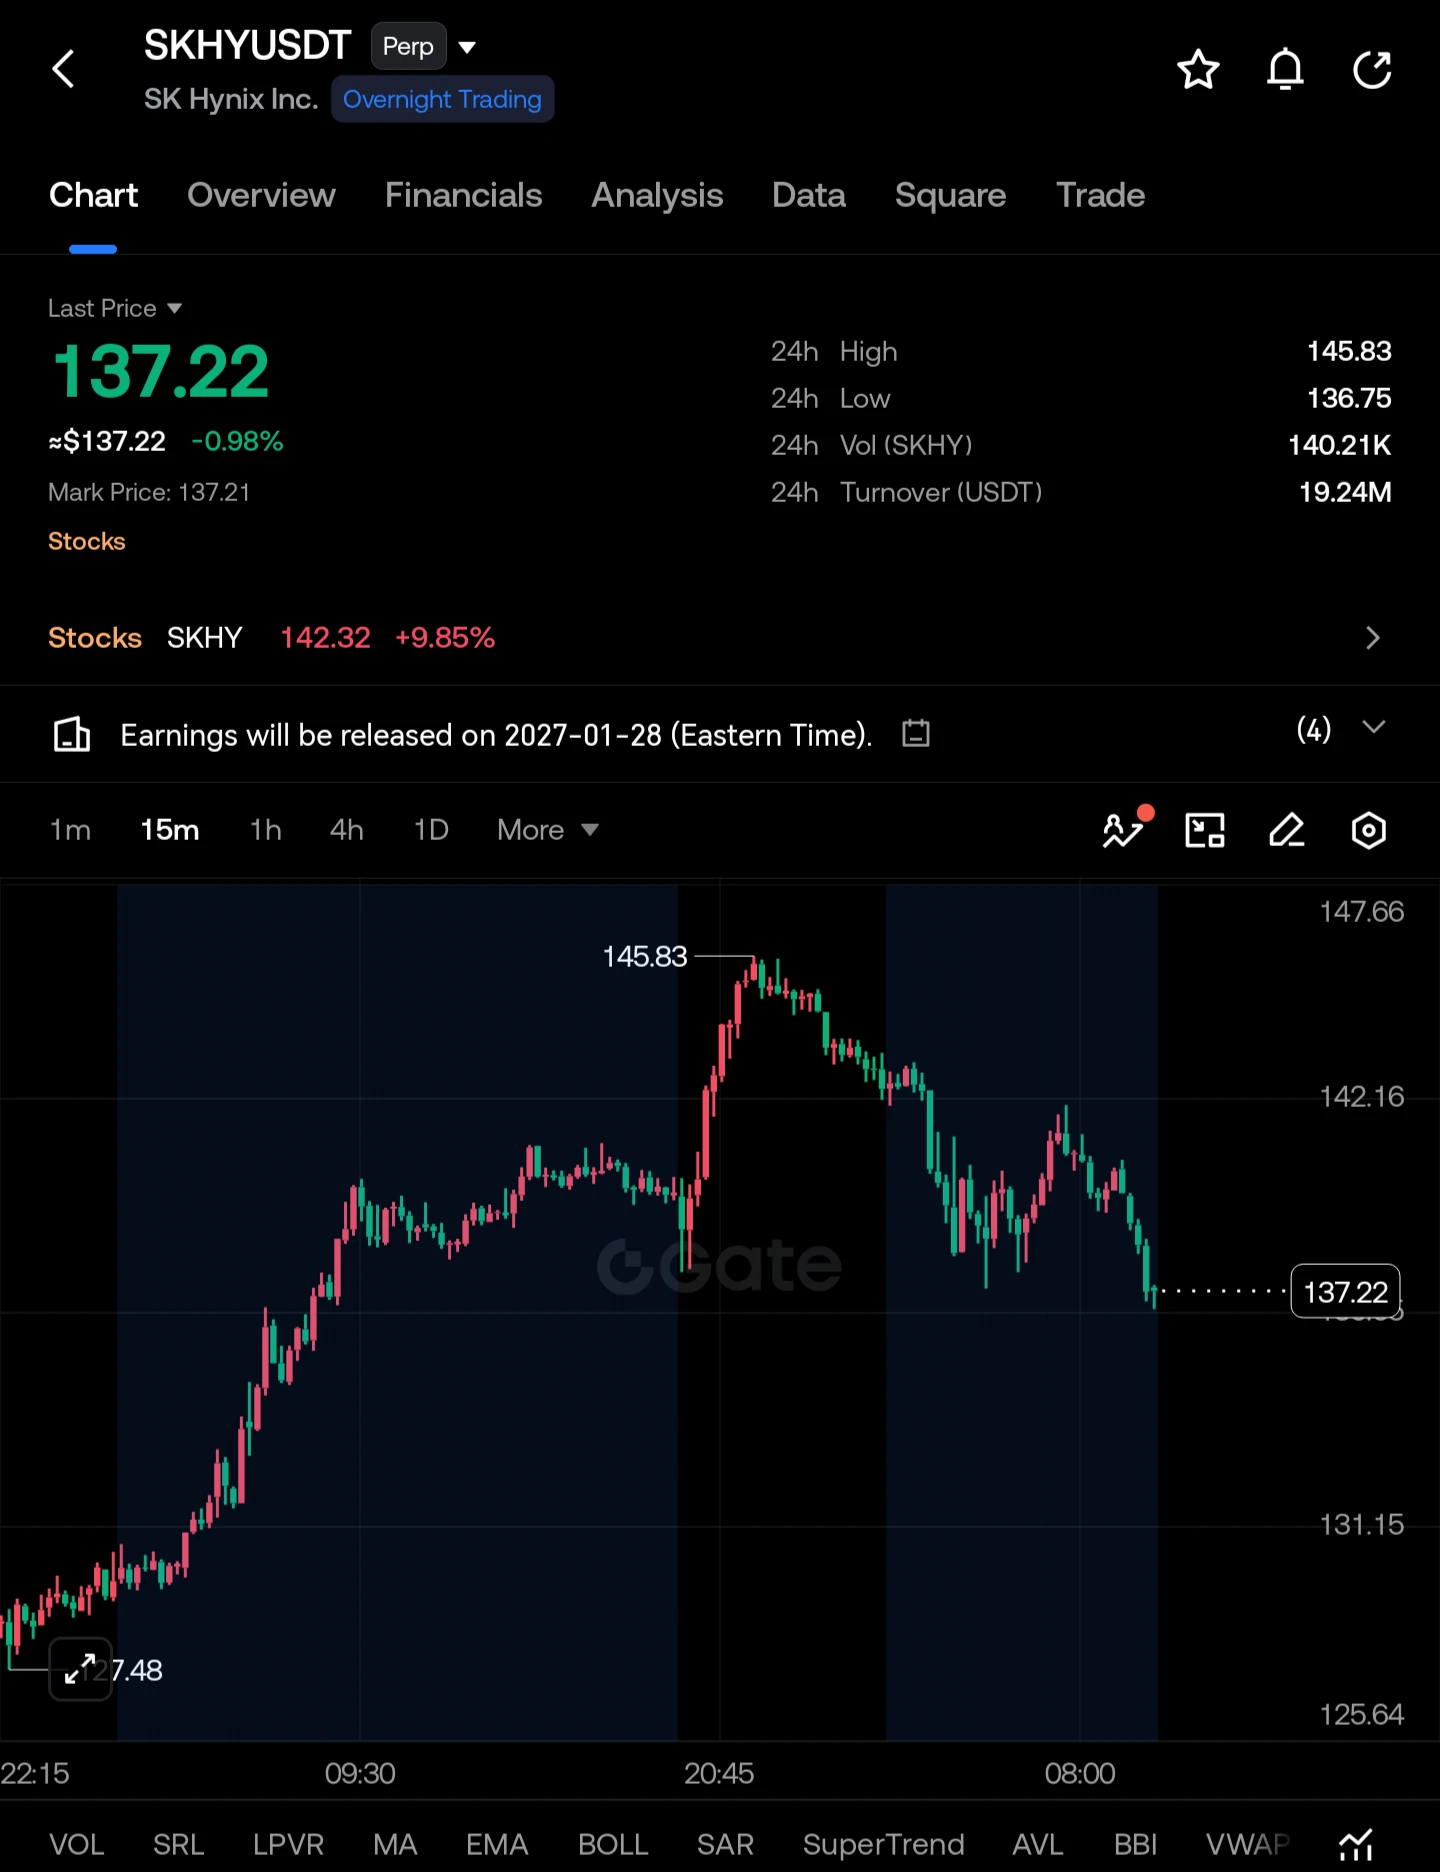
🚨 $SKHY USDT – Sellers Are Taking Control!

I'm watching SKHYUSDT closely because the 15-minute chart is showing a noticeable shift in momentum. After an impressive rally toward $145.83, buyers failed to maintain control, and price has started forming lower highs with increasing selling pressure.

Currently trading around $137.22, SKHY is testing an important support area near $136.75. If sellers break this level convincingly, we could see another downside leg. I'm keeping a SHORT setup on watch, but confirmation is key.

🔴 SHORT TRADE SETUP

Entry Level: $137.20 – $138.20

TP1: $136.00

TP2
post-image
SKHY+0.86%
  • 1
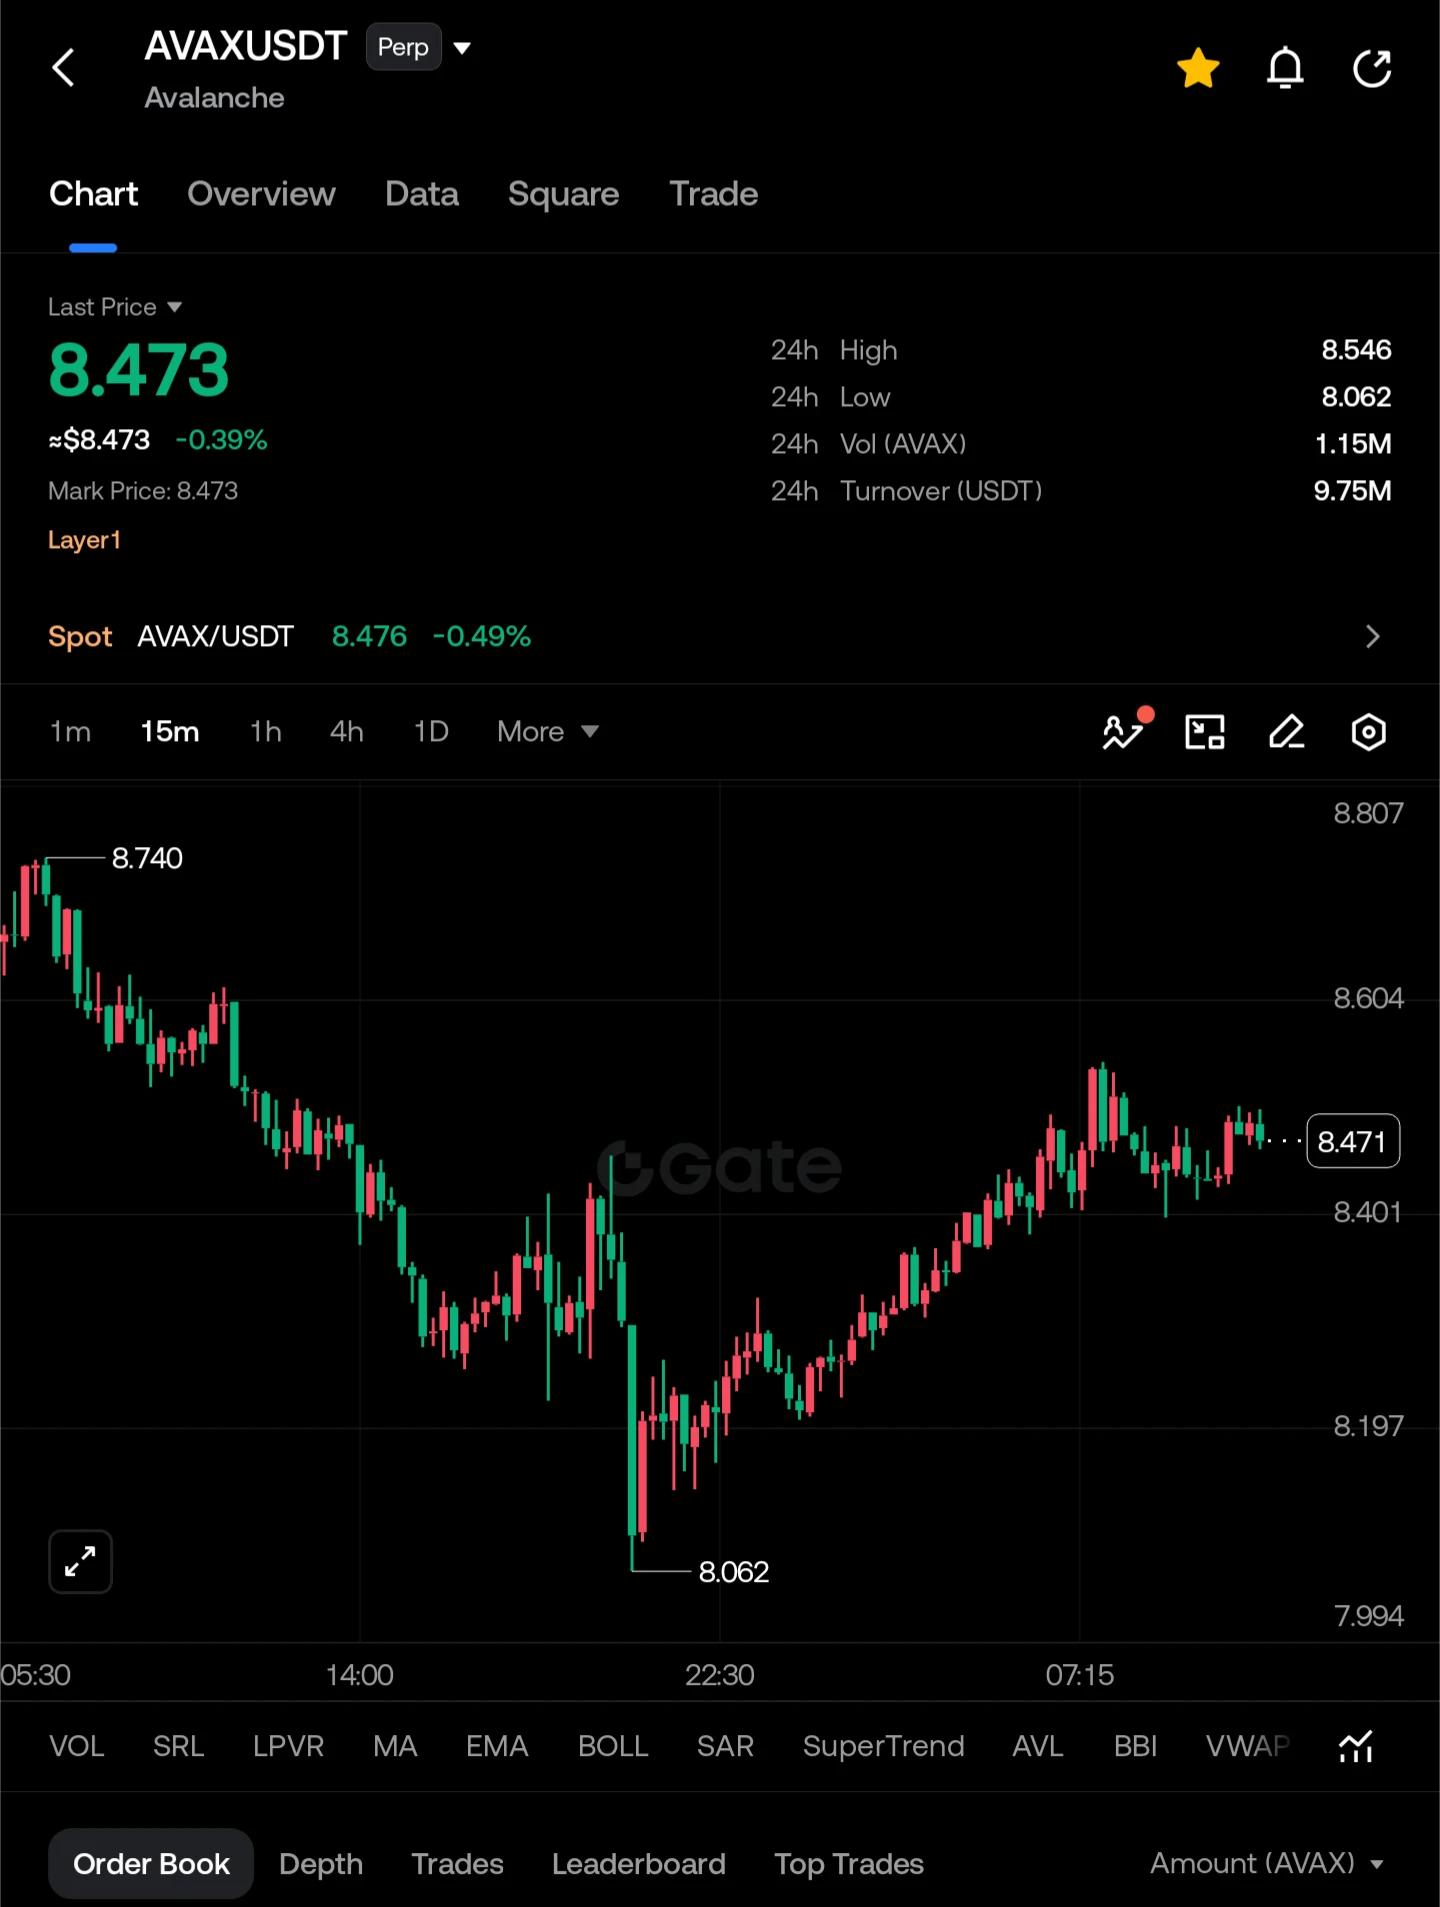
🚀 $AVAX – Buyers Are Quietly Taking Control!

I'm watching AVAXUSDT closely because the 15-minute chart is showing an interesting shift in momentum. After dropping from the $8.740 region and sweeping down to $8.062, buyers stepped in and pushed price back toward $8.47.

What catches my attention is the gradual formation of higher lows. The recovery is still facing resistance, but buyers appear to be defending the recent gains.

Now the key battle is around $8.50–$8.55. A clean breakout above this zone could open the door for another upward move. I'm keeping an eye on volume and price confirm
post-image
AVAX-0.10%
MU-1.11%
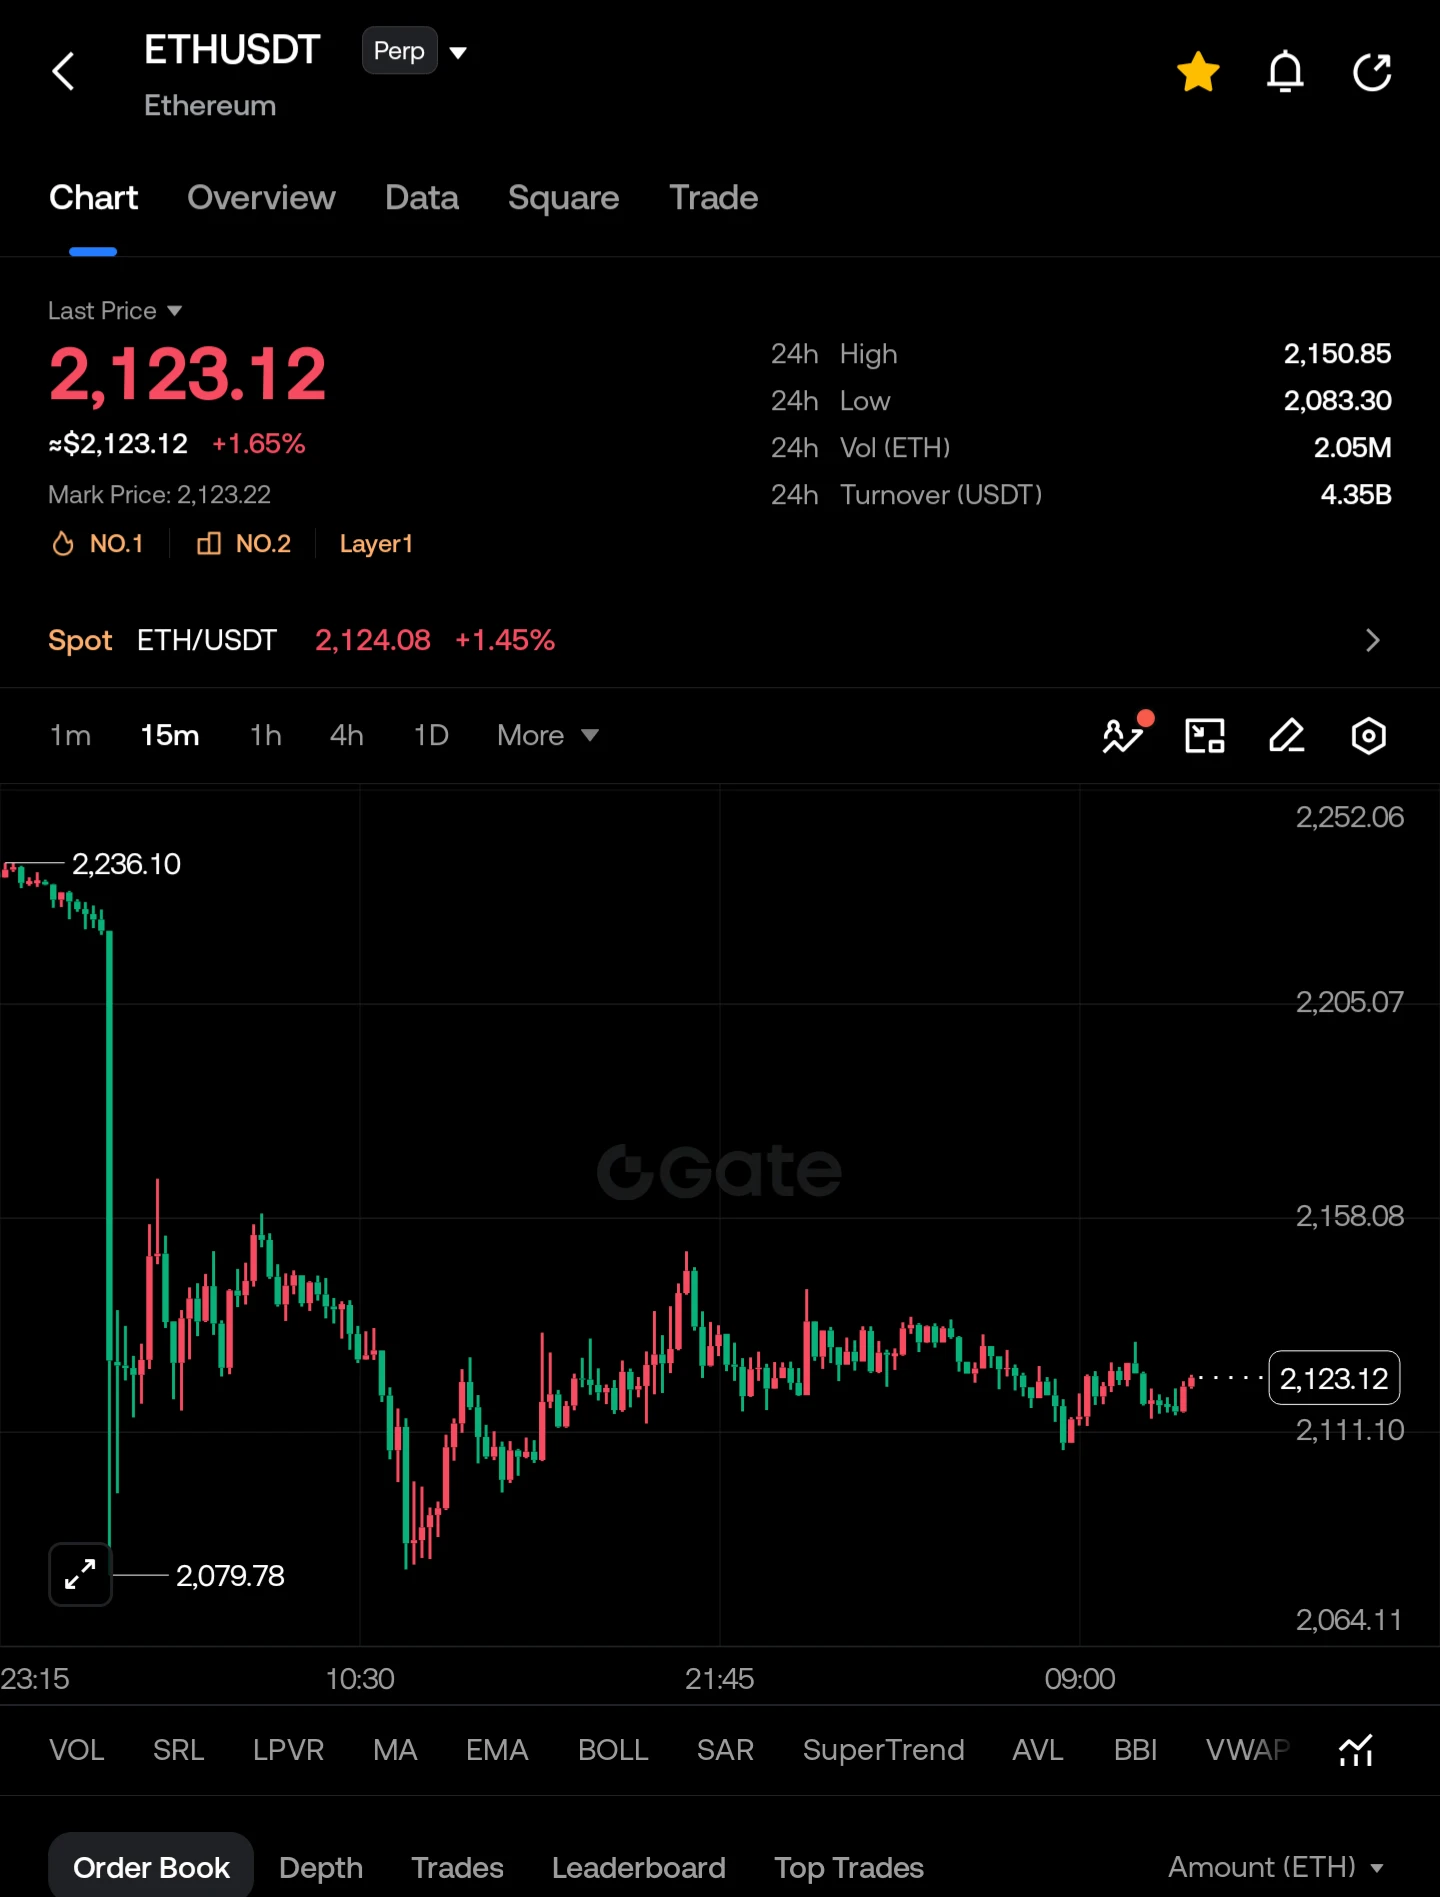
🚨 $ETH USDT – A BIG MOVE COULD BE BREWING!

I'm watching Ethereum ($ETH) closely because the 15-minute chart is showing an interesting battle between buyers and sellers. After a sharp sell-off from the $2,236 region, ETH recovered from the $2,079 low and is now holding around $2,123.

The market is trying to build a base, but bulls still need to reclaim nearby resistance. I'm watching the $2,110–$2,120 area for a potential bullish continuation. A strong move above $2,135 could open the door to higher targets. 👀

🎯 TRADE SETUP – LONG

Entry Level: $2,115 – $2,125

TP1: $2,140
TP2: $2,158
TP3
post-image
ETH-1.26%
🔥 $ZEC /USDT – Bears Are Losing Control or Is This Just a Trap?

I'm watching $ZEC closely because the 15-minute chart is showing an important battle around the $1,250–$1,265 zone.

After getting rejected from the $1,387 high, ZEC has experienced a clear downside move, forming lower highs and lower lows. However, buyers are now attempting to defend the $1,247 support area. A successful recovery could trigger a short-term bullish reaction, but confirmation is still needed.

🎯 Entry Level: $1,255 – $1,267

🥇 TP1: $1,280

🥈 TP2: $1,300

🥉 TP3: $1,325

🛑 STOP LOSS: $1,242

⚡ Key Level to Wat
ZEC+1.16%
  • 1
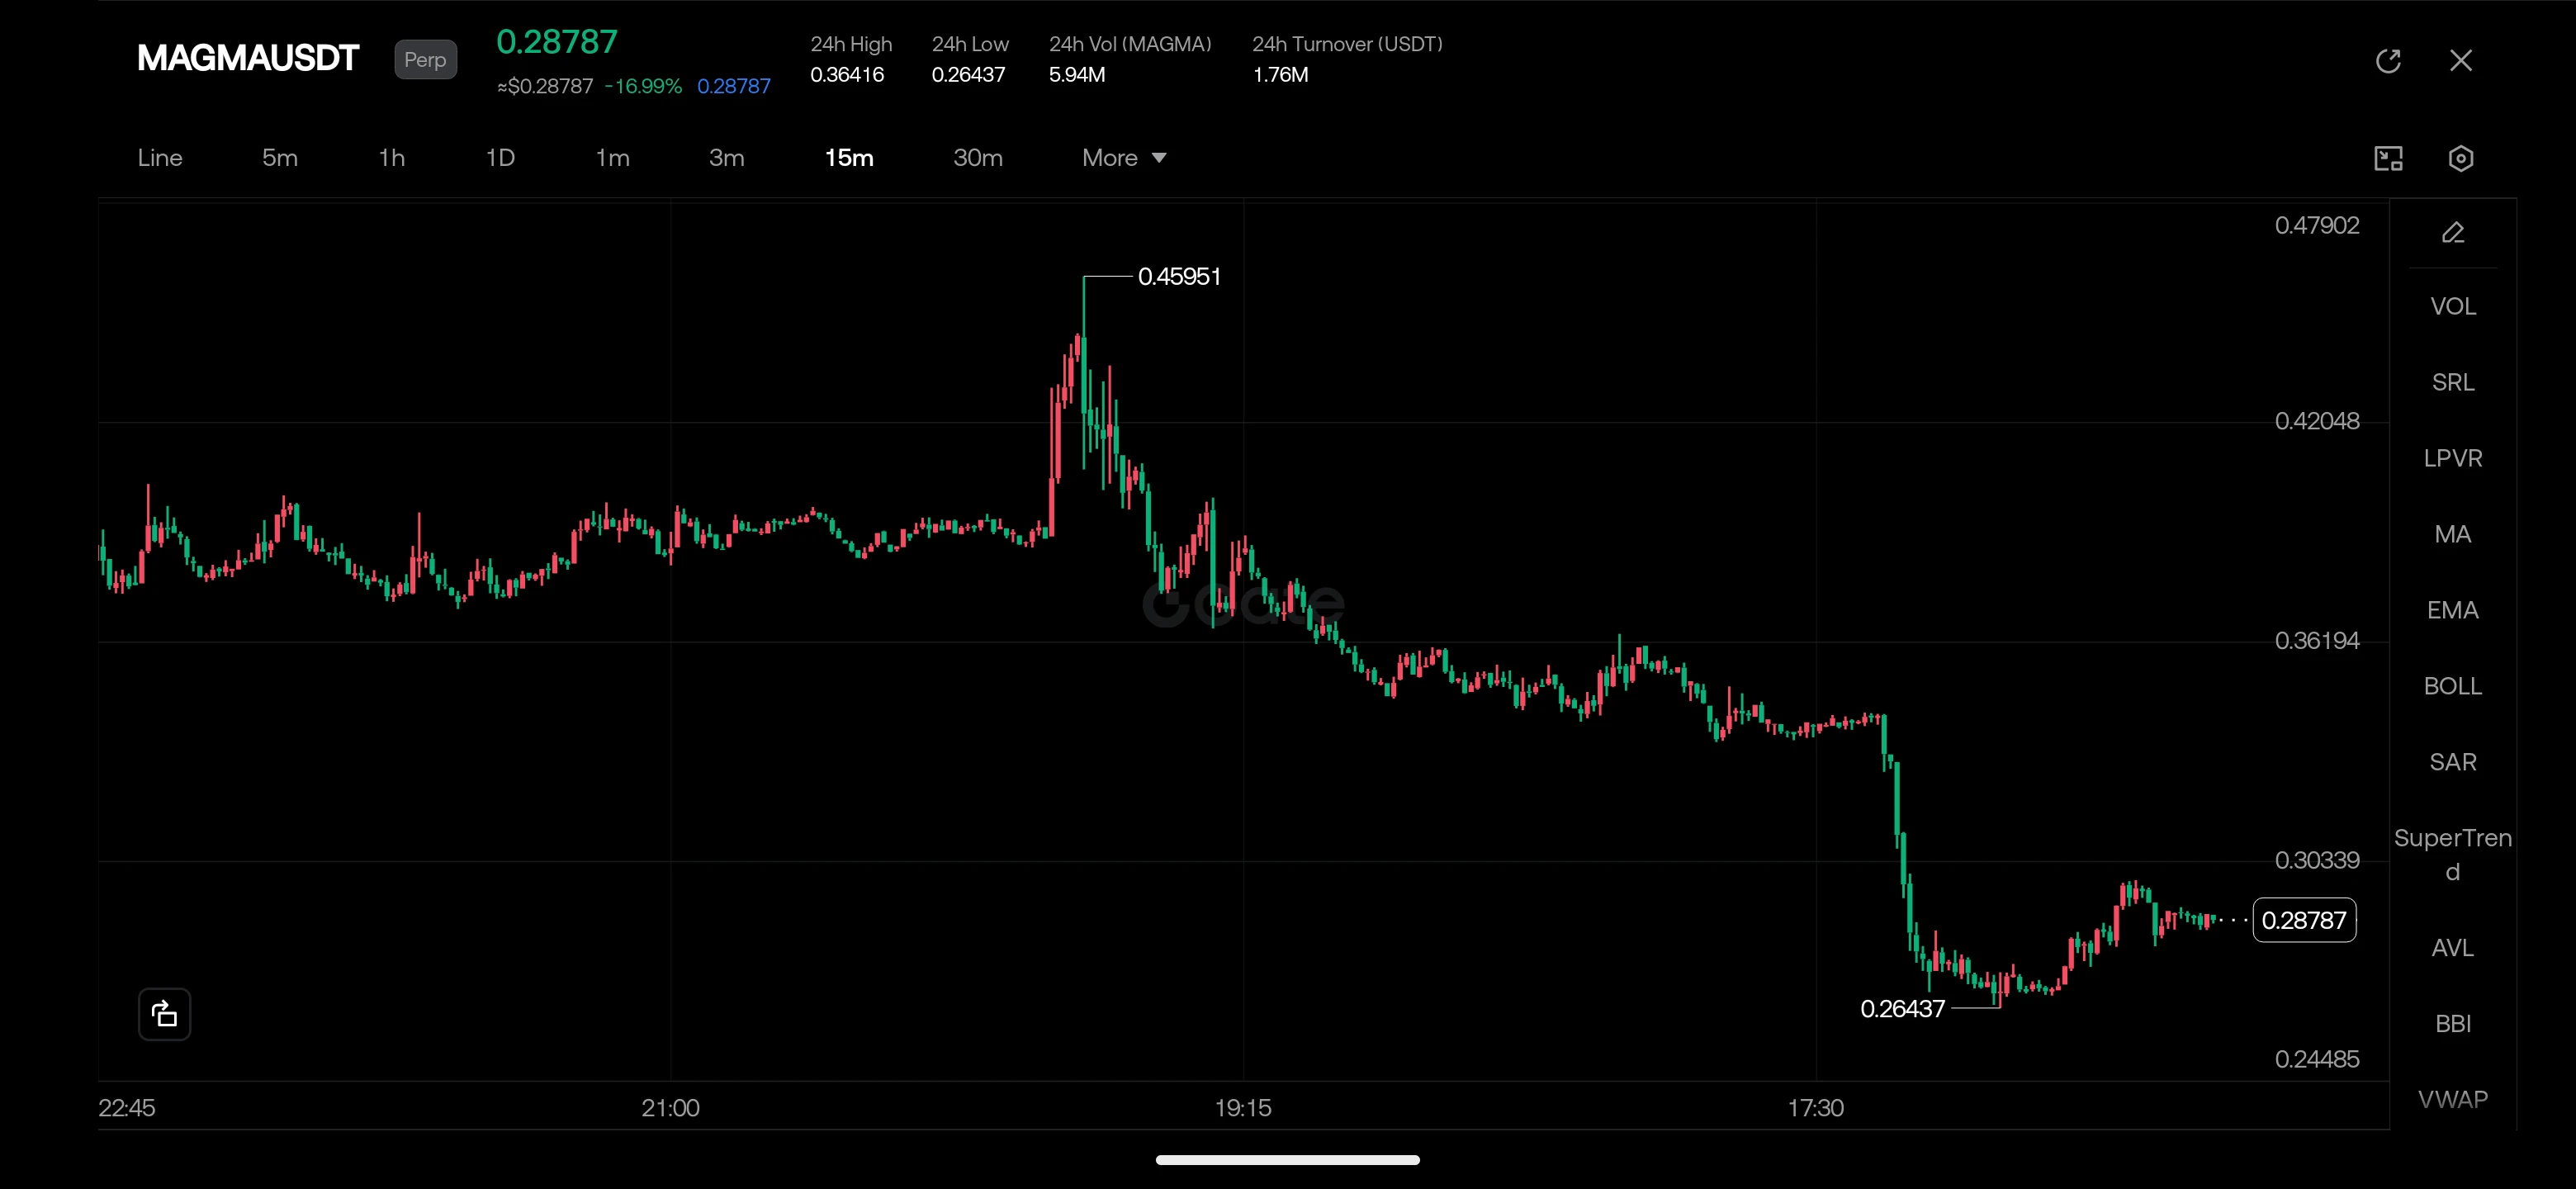
🚨 $MAGMA USDT – A Critical Moment for Bears and Bulls!

I'm watching $MAGMA closely because the 15-minute chart is showing serious selling pressure. After a sharp breakdown from the higher range, price dropped toward $0.26437 and attempted a recovery. However, the bounce is still looking weak, and sellers could regain control if resistance holds.

I'm watching for a rejection near the recovery zone rather than chasing the move blindly. 👀

📍 Entry Level: $0.2910 – $0.2980 (Short on confirmed rejection)

🎯 TP1: $0.2800

🎯 TP2: $0.2720

🎯 TP3: $0.2645

🛑 STOP LOSS: $0.3070

⚠️ DISCLAIMER:
post-image
MAGMA-0.57%
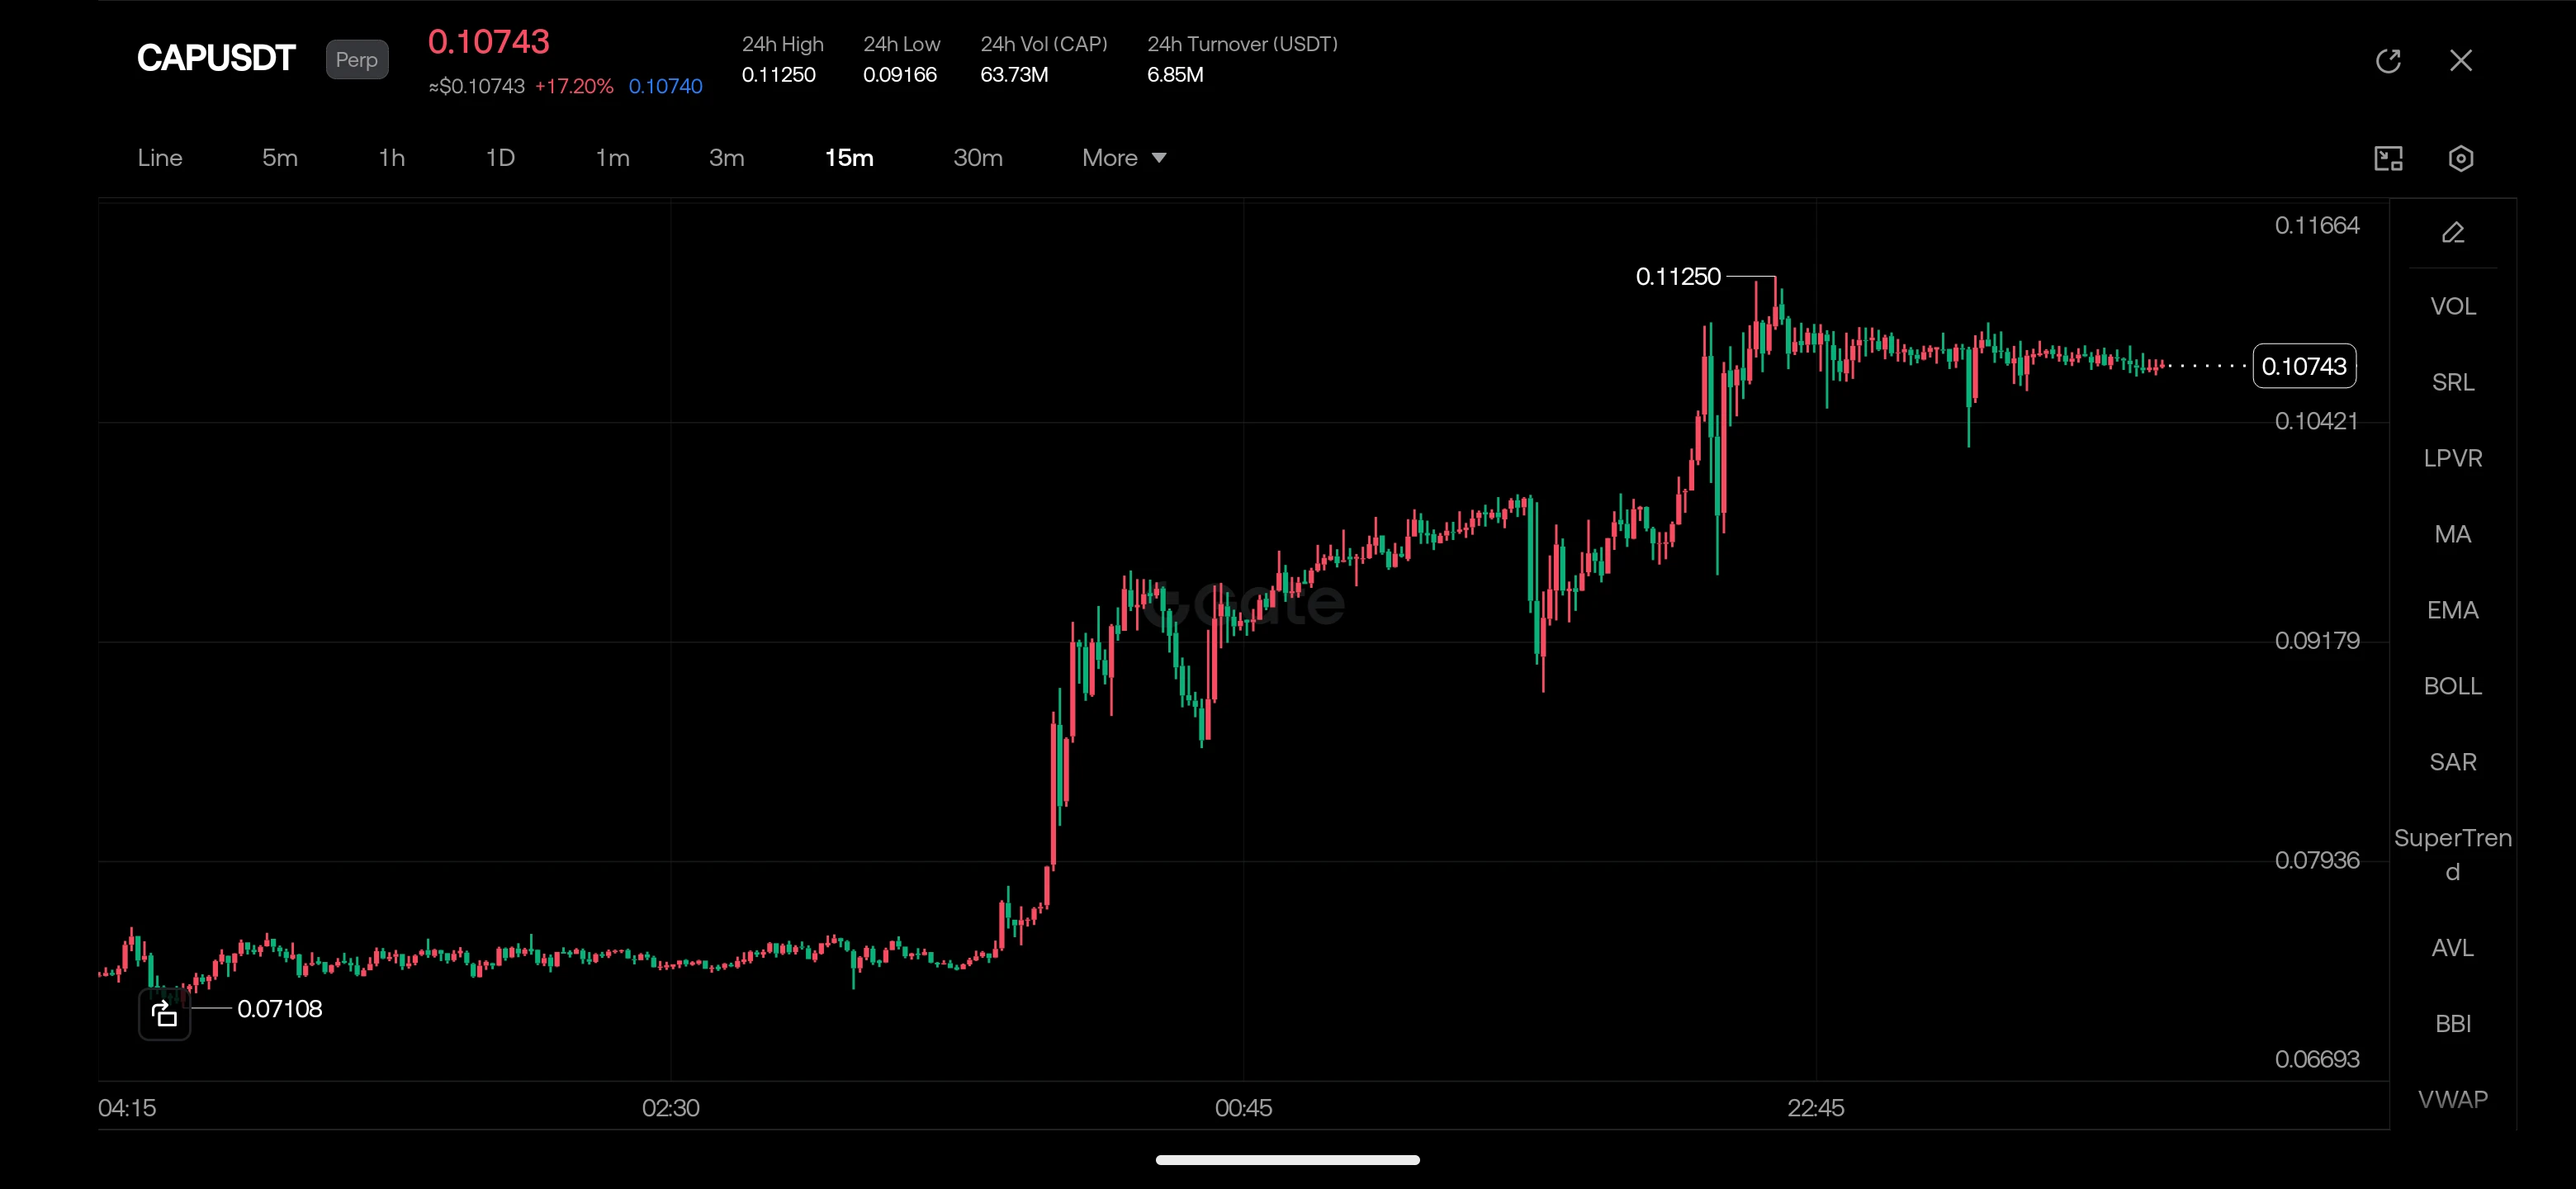
**I'm watching $CAP USDT (Perp) very closely right now. 👀🔥**

This coin went from sleepy, flat candles around 0.071 to a vertical rocket up to 0.1125. Now it's up 17%+ and just sitting there, tight and quiet, like a spring being pressed down. Moves like that either fade or fire again, and I want to be ready for the second.

📍 **Entry:** 0.1055 – 0.1075 (current zone, or a small dip toward it)

🎯 **TP1:** 0.1125 (the 24h high, where I'd take some profit)

🎯 **TP2:** 0.1180

🚀 **TP3:** 0.1250 (if the breakout really runs)

🛑 **Stop Loss:** 0.1010 (a close below this and the setup is dead,
post-image
CAP+8.34%
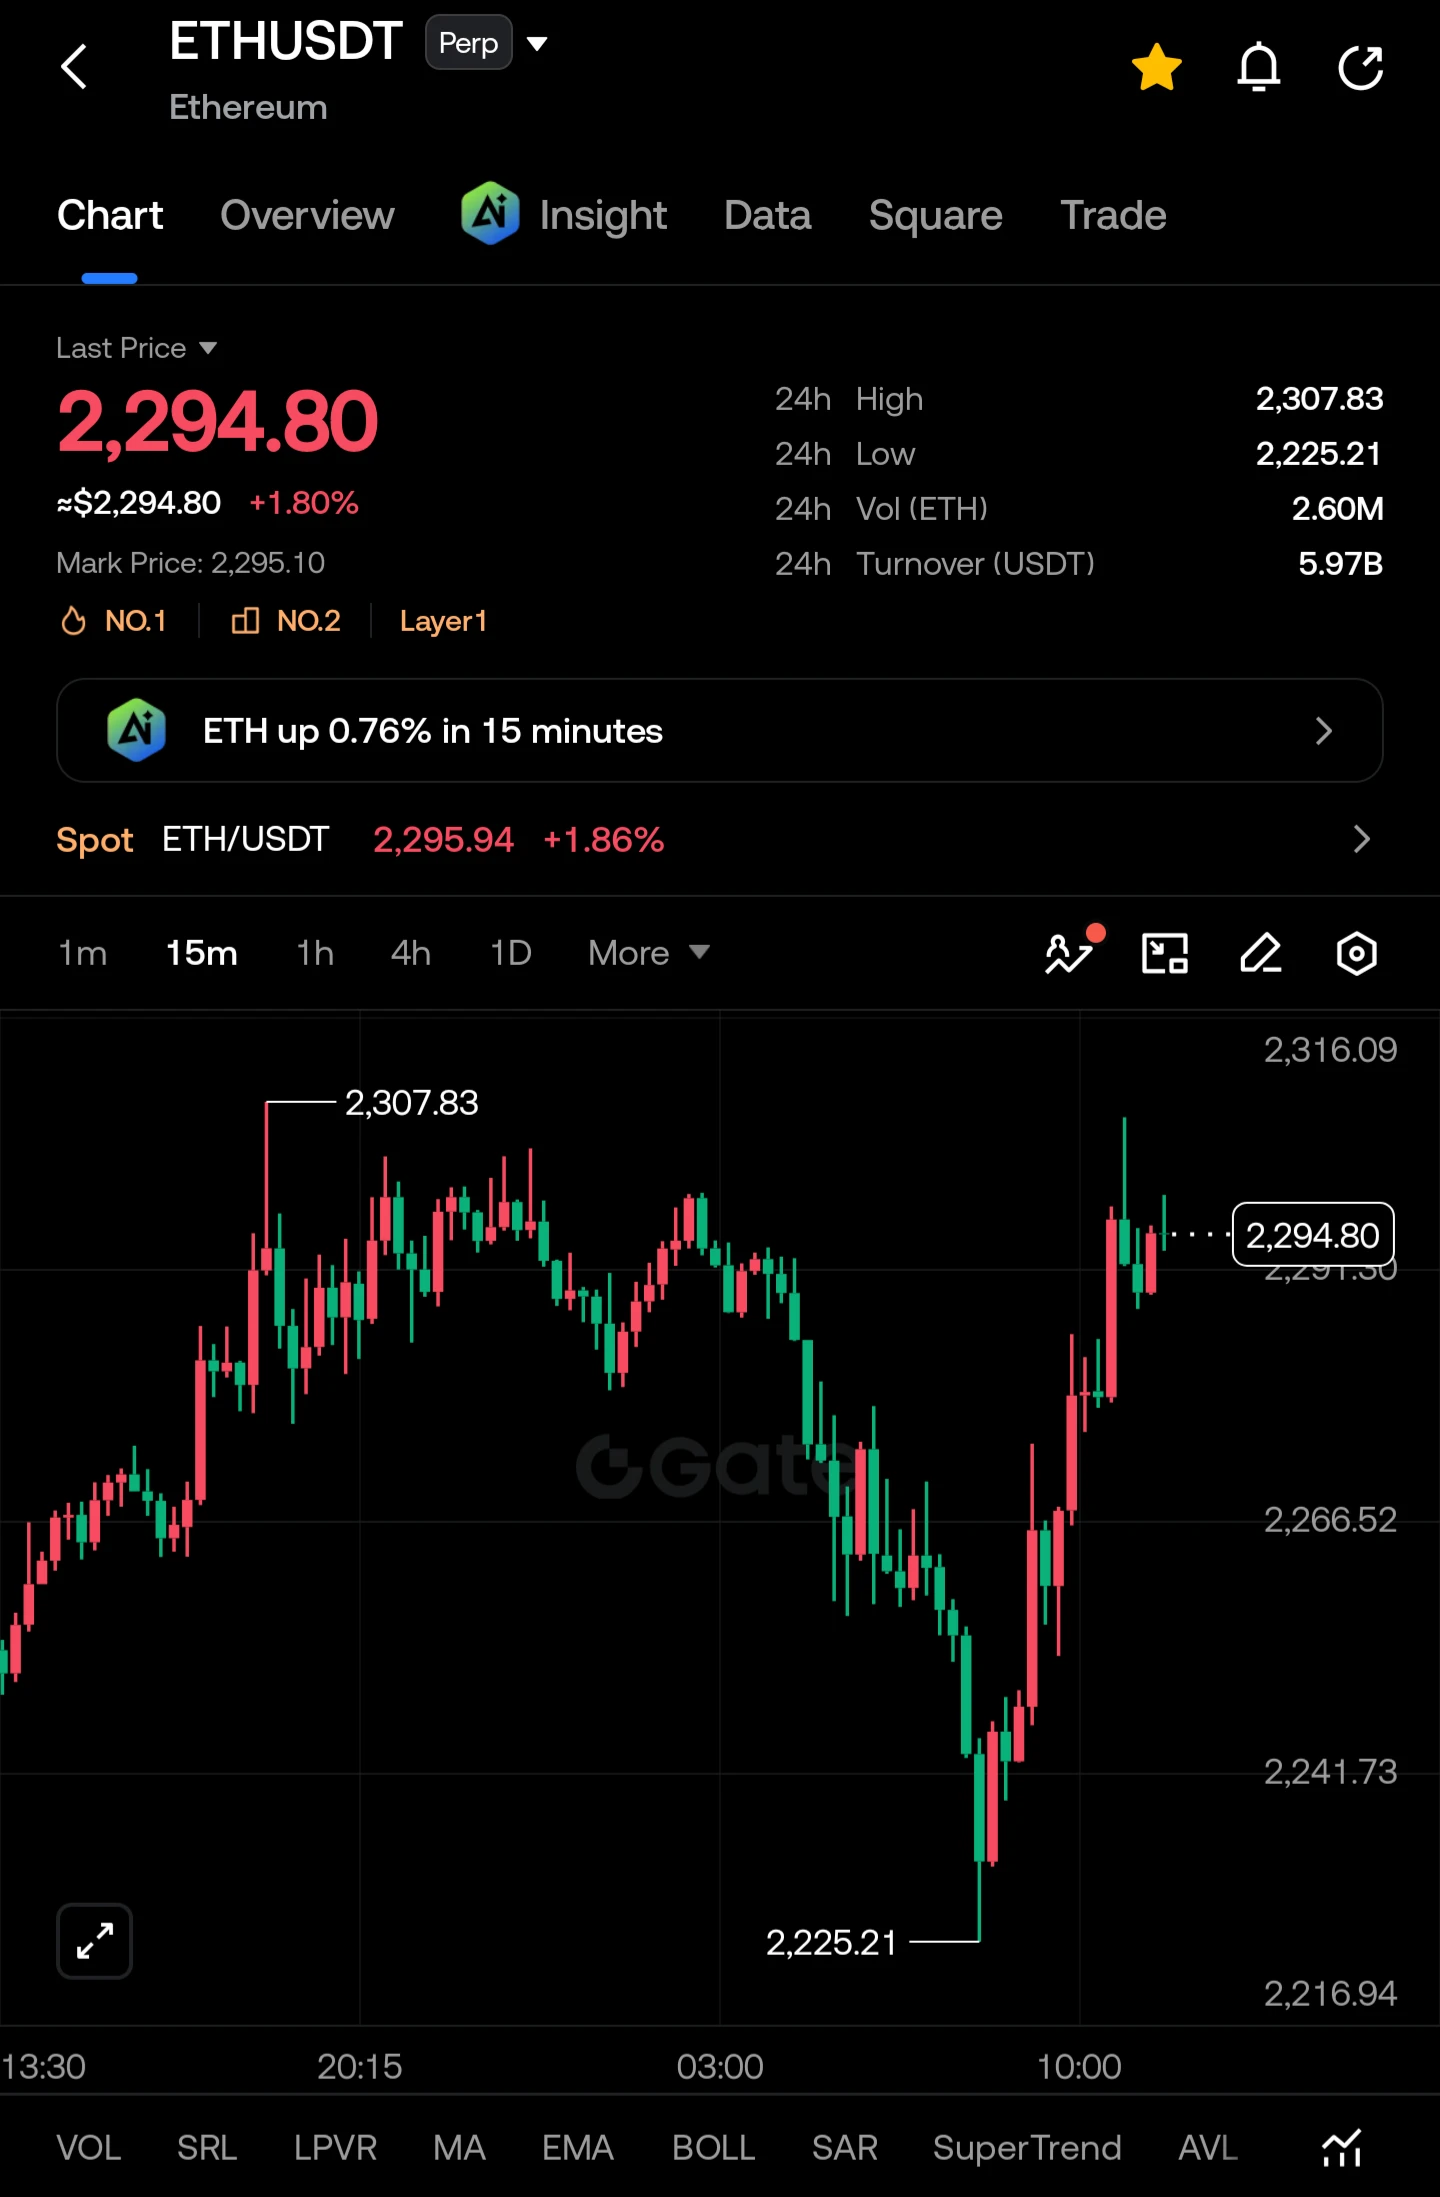
Personal hook: I'm watching $ETH very closely right now. 👀🔥

ETH just bounced hard from the 2,225 low and is now pushing 2,294 (+1.80%). Buyers stepped in at the bottom and the 15m candles are turning green fast. The real question is whether it can break the 2,307 high. If it does, momentum could get wild. 🚀

**Entry level:** 2,285 – 2,295 (or on a clean breakout above 2,308)

**TP1:** 2,325
**TP2:** 2,360
**TP3:** 2,410

**STOP LOSS:** 2,248 (below the recent structure)

I'm not rushing in. I wait for confirmation, keep my size small, and let the market prove itself first. Patience pays.
post-image
ETH-1.26%
  • 1
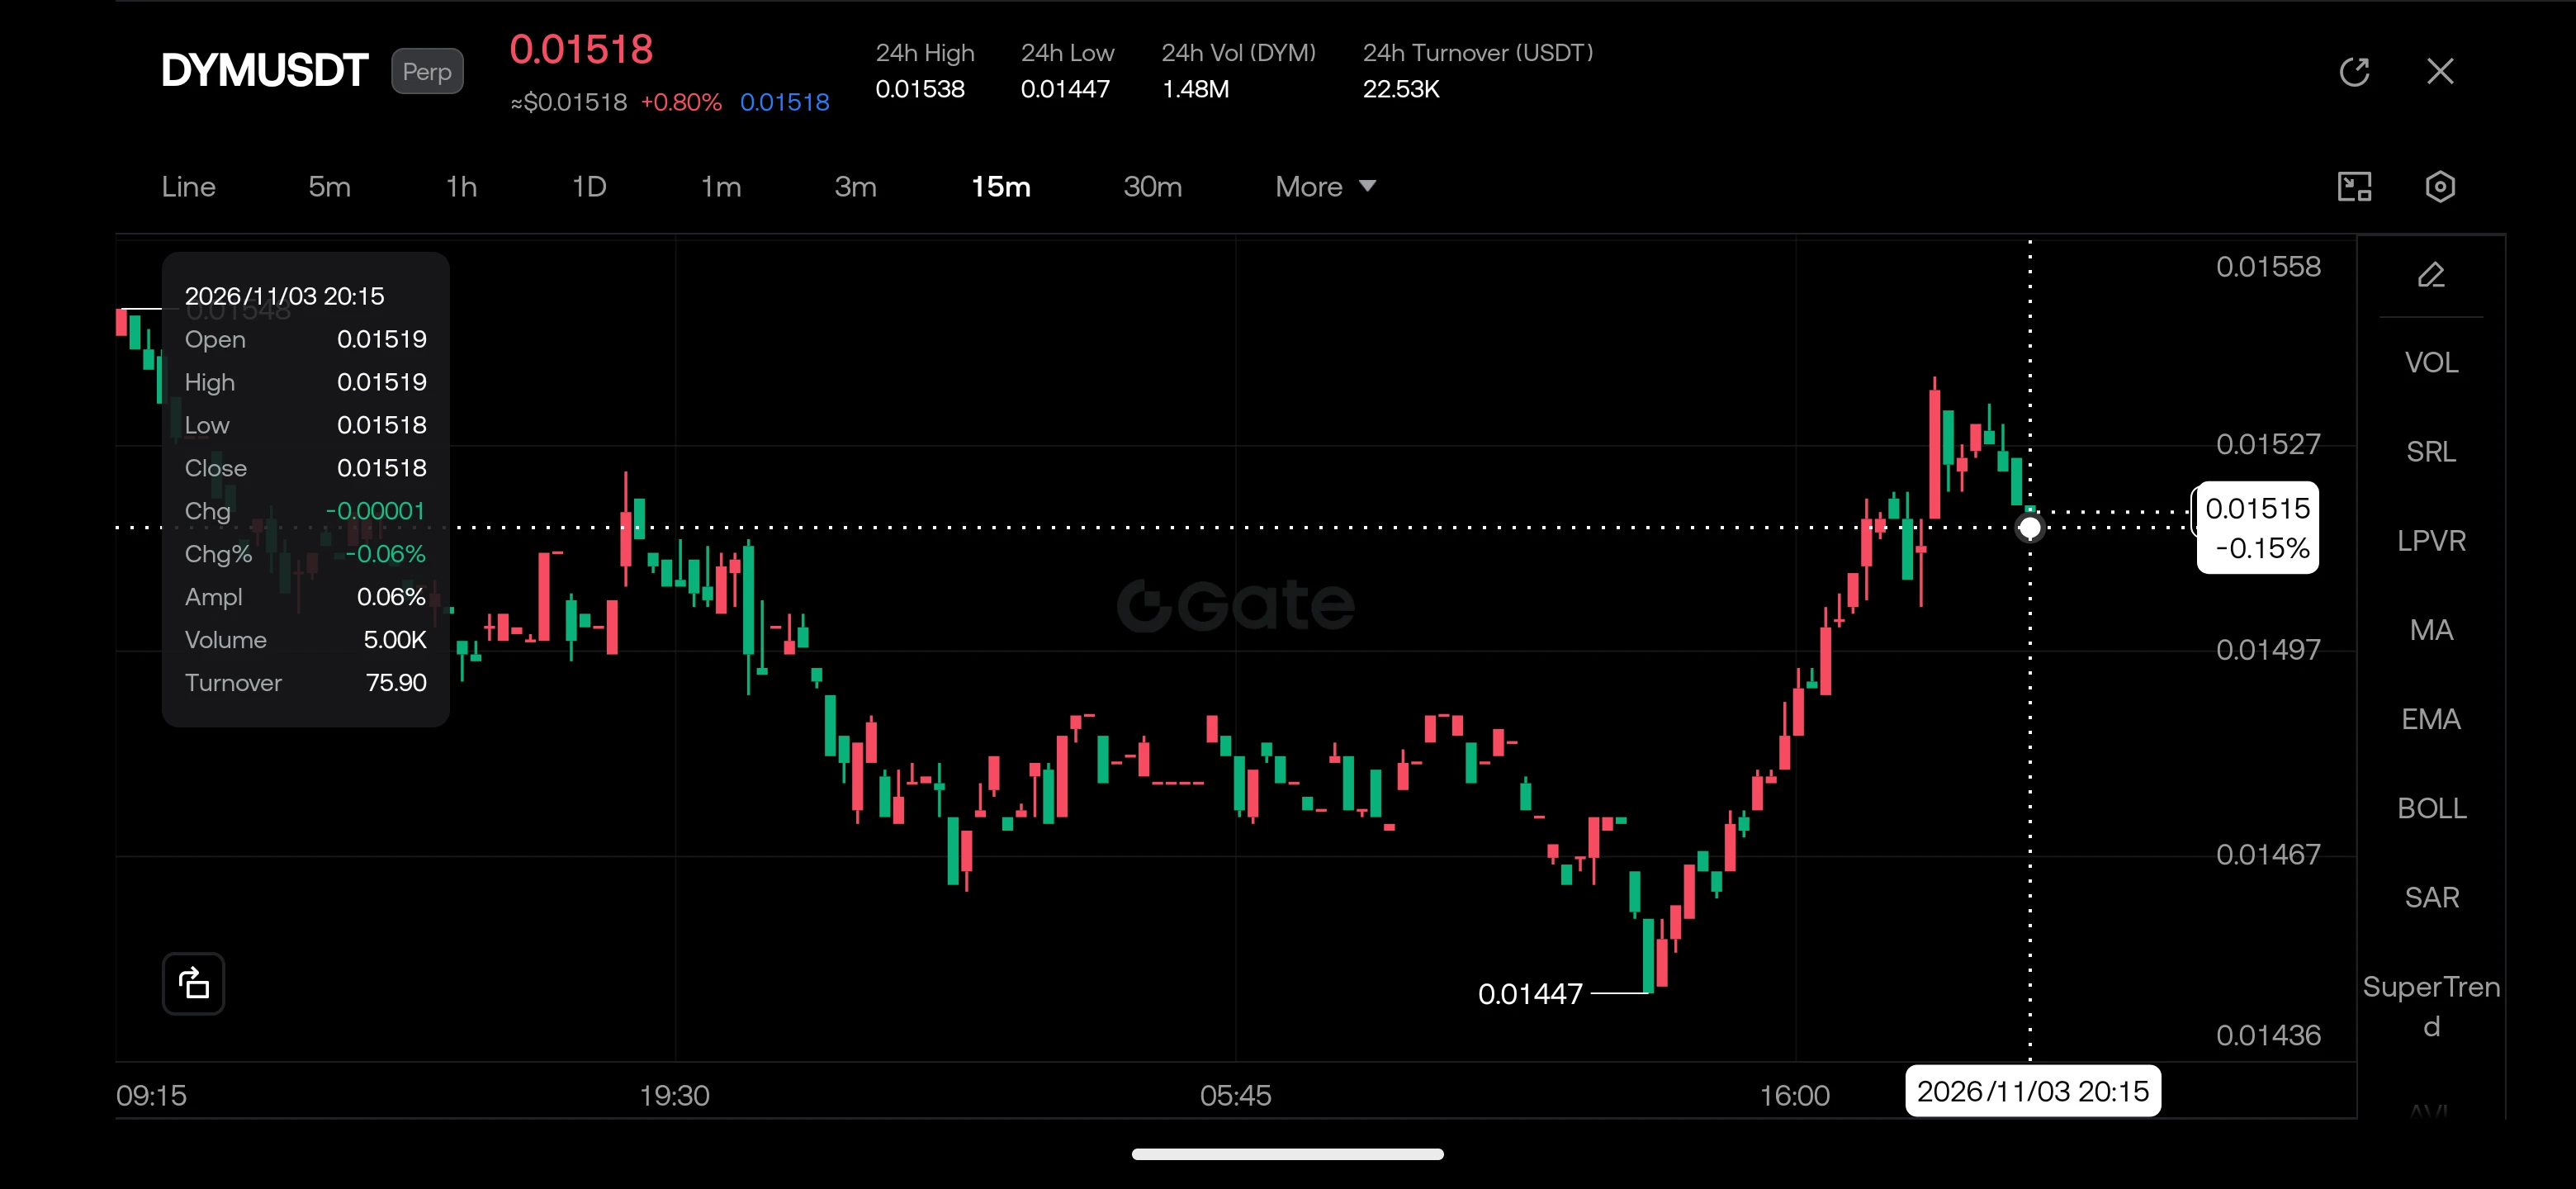
$DYM – Higher Timeframe Overview | Long on Pullback**

**Pair:** $DYMUSDT Perpetual

Price is at 0.01518, up about 0.8% on the day. I only have the 15m chart, so this is a short-term read rather than a true higher-timeframe view, and I'd want the 1h and 4h structure before leaning on it too hard.

I'd rather wait for a retest than chase this one.

**Market Observation**

For most of the session DYM slid, then ranged below 0.0150 until it printed a low at 0.01447. From there it turned into a steady run of higher lows and pushed up to the 24h high at 0.01538. Price has since pulled back slightl
post-image
DYM-3.79%
AAPL+0.10%
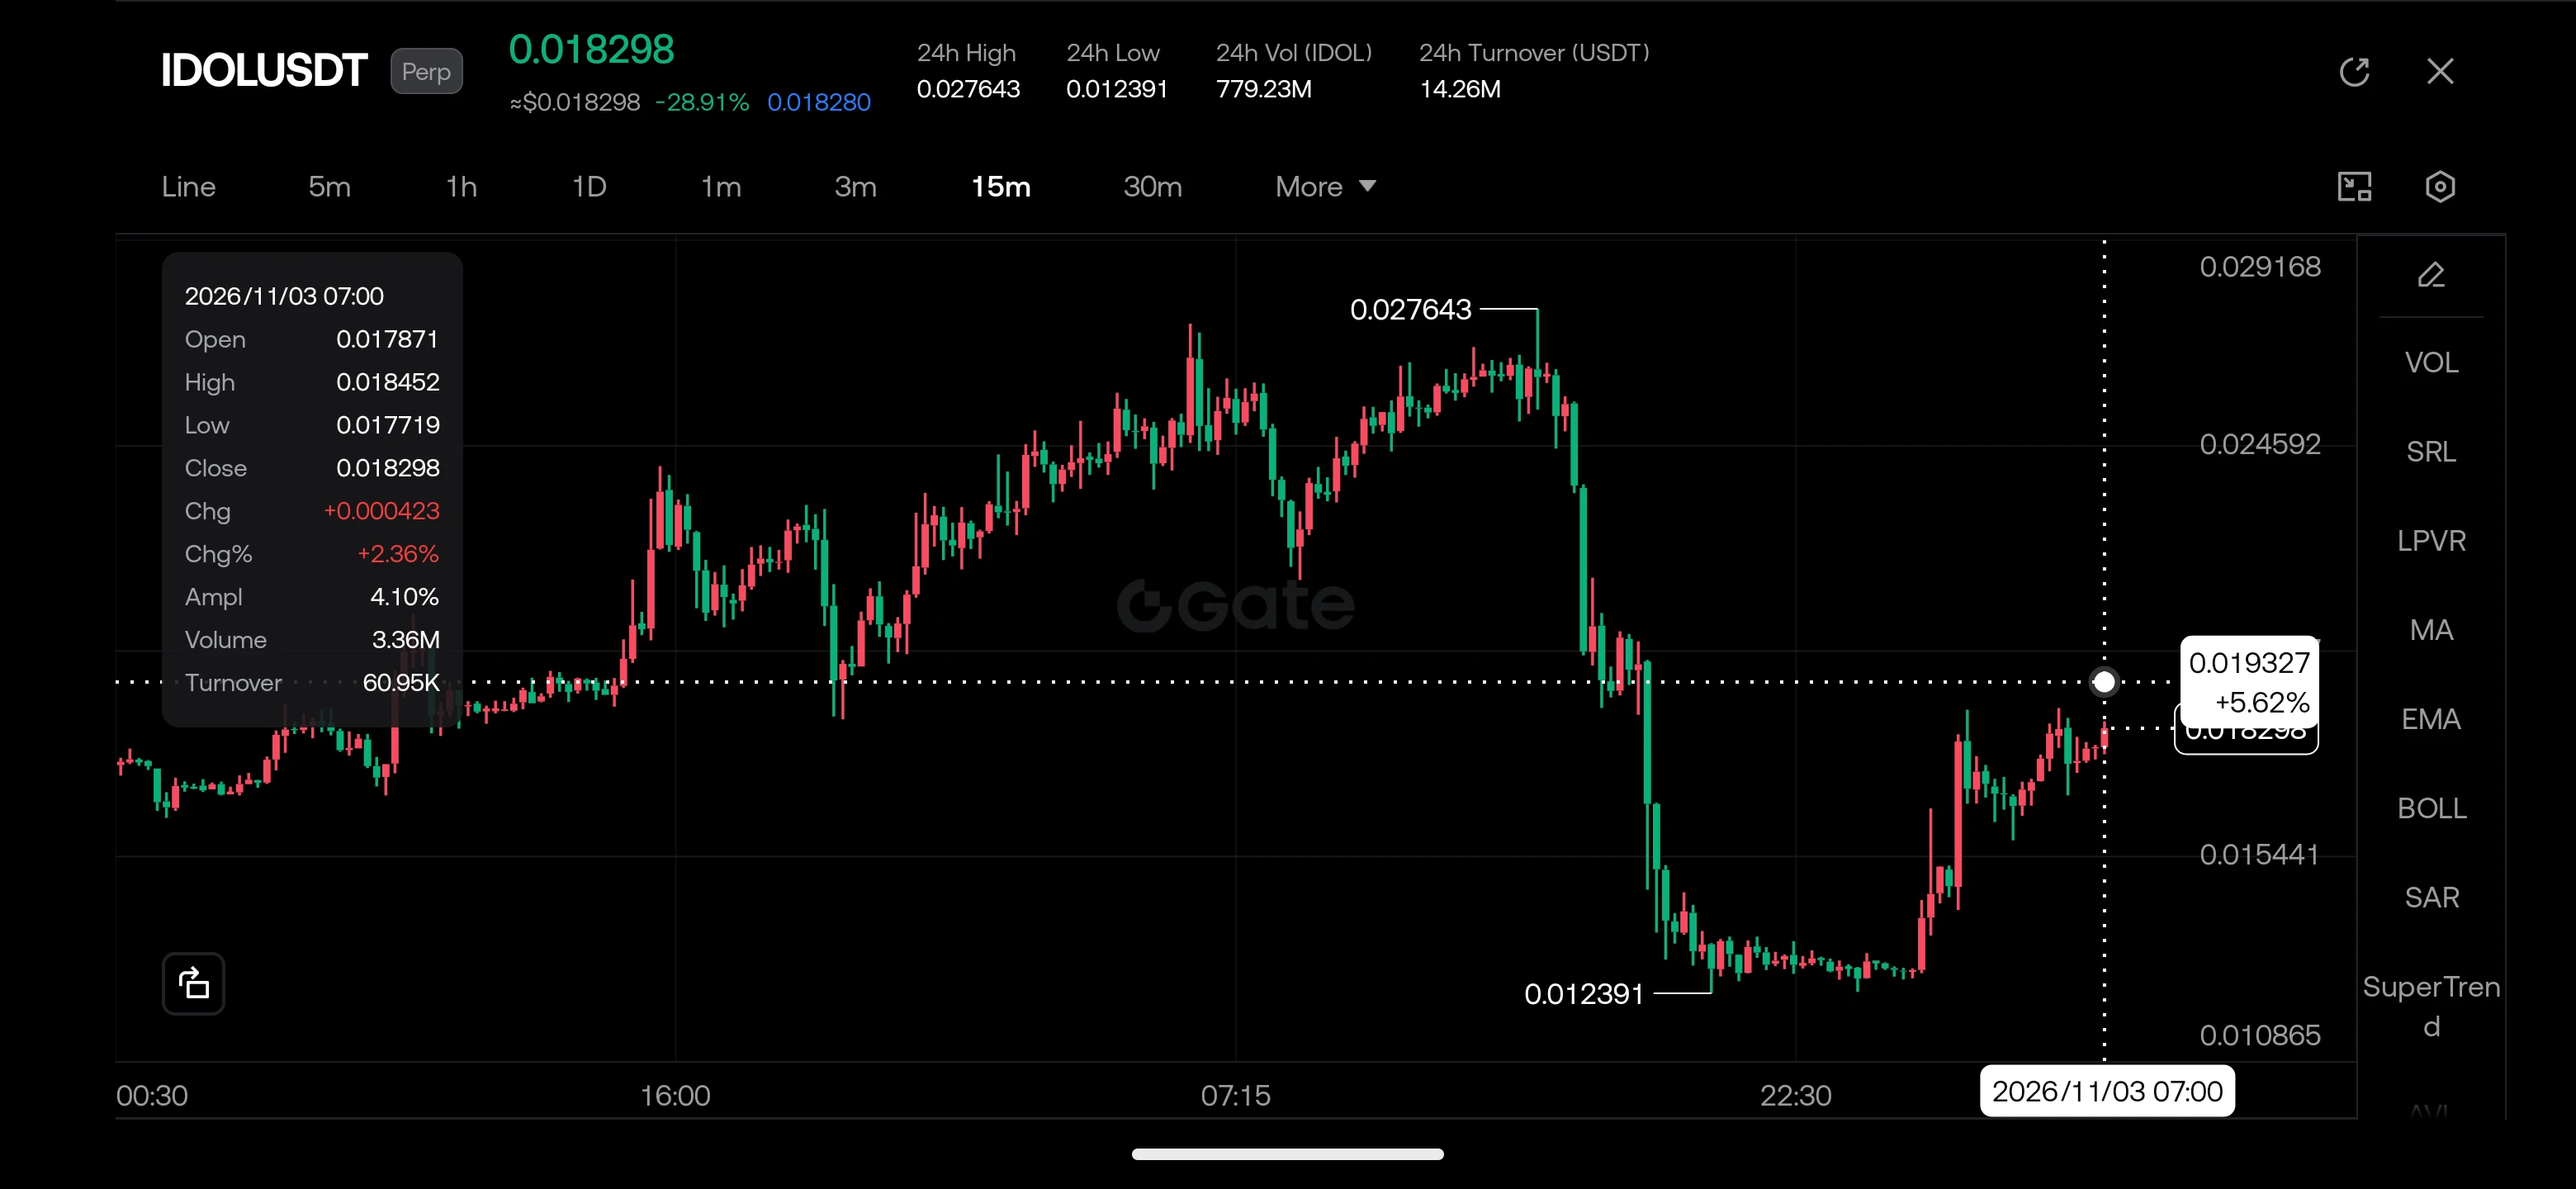
🔥 $IDOL – A Powerful Comeback Is Taking Shape! 🚀

I'm watching $IDOL /USDT closely because this chart has caught my attention. After a brutal sell-off from the $0.0276 region toward $0.01239, buyers have stepped back in and pushed price toward $0.01830.

That's a strong recovery, but the real test is whether bulls can maintain this momentum and reclaim the next resistance zone. 👀

📍 Entry Level: $0.01780 – $0.01830

🎯 TP1: $0.01930

🎯 TP2: $0.02050

🎯 TP3: $0.02200

🛑 STOP LOSS: $0.01680

⚡ What I'm Watching: A breakout above $0.01930 could attract fresh buying pressure. If buyers hol
post-image
IDOL-6.71%
  • 1
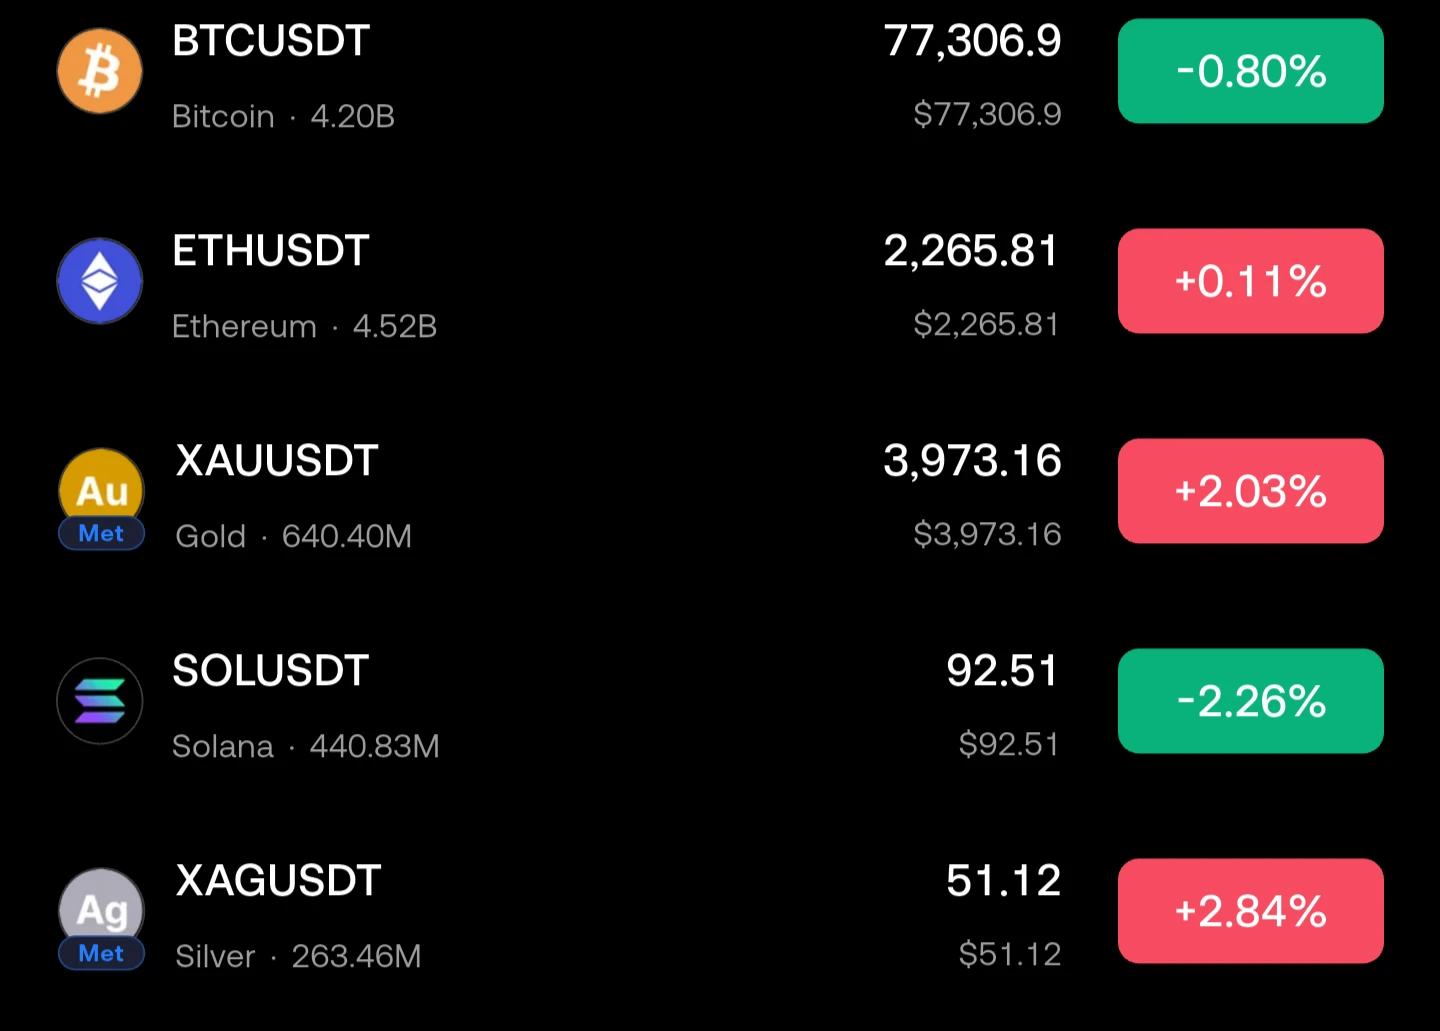
📊 Market Snapshot**

🟠 $BTC : $77,306.9 (-0.80%)
🔷 $ETH : $2,265.81 (+0.11%)
🥇 : $3,973.16 (+2.03%)
🟣 $SOL : $92.51 (-2.26%)
🥈 Silver: $51.12 (+2.84%)

Metals are leading today while crypto cools off. Gold and silver are strong, BTC and SOL are slightly down, and ETH is flat. Watch whether money keeps rotating into metals. 👀

*Not financial advice. DYOR.* #BTC #ETH #SOL #Gold #Silver

**Shorter version (for X/Twitter):**

Metals pumping 🚀 Gold +2.03%, Silver +2.84%. Crypto is mixed: BTC -0.80%, SOL -2.26%, ETH flat. Safe-haven money is movingly today.

Want a bullish or bearish tone,
post-image
BTC-0.67%
ETH-1.26%
SOL-0.77%
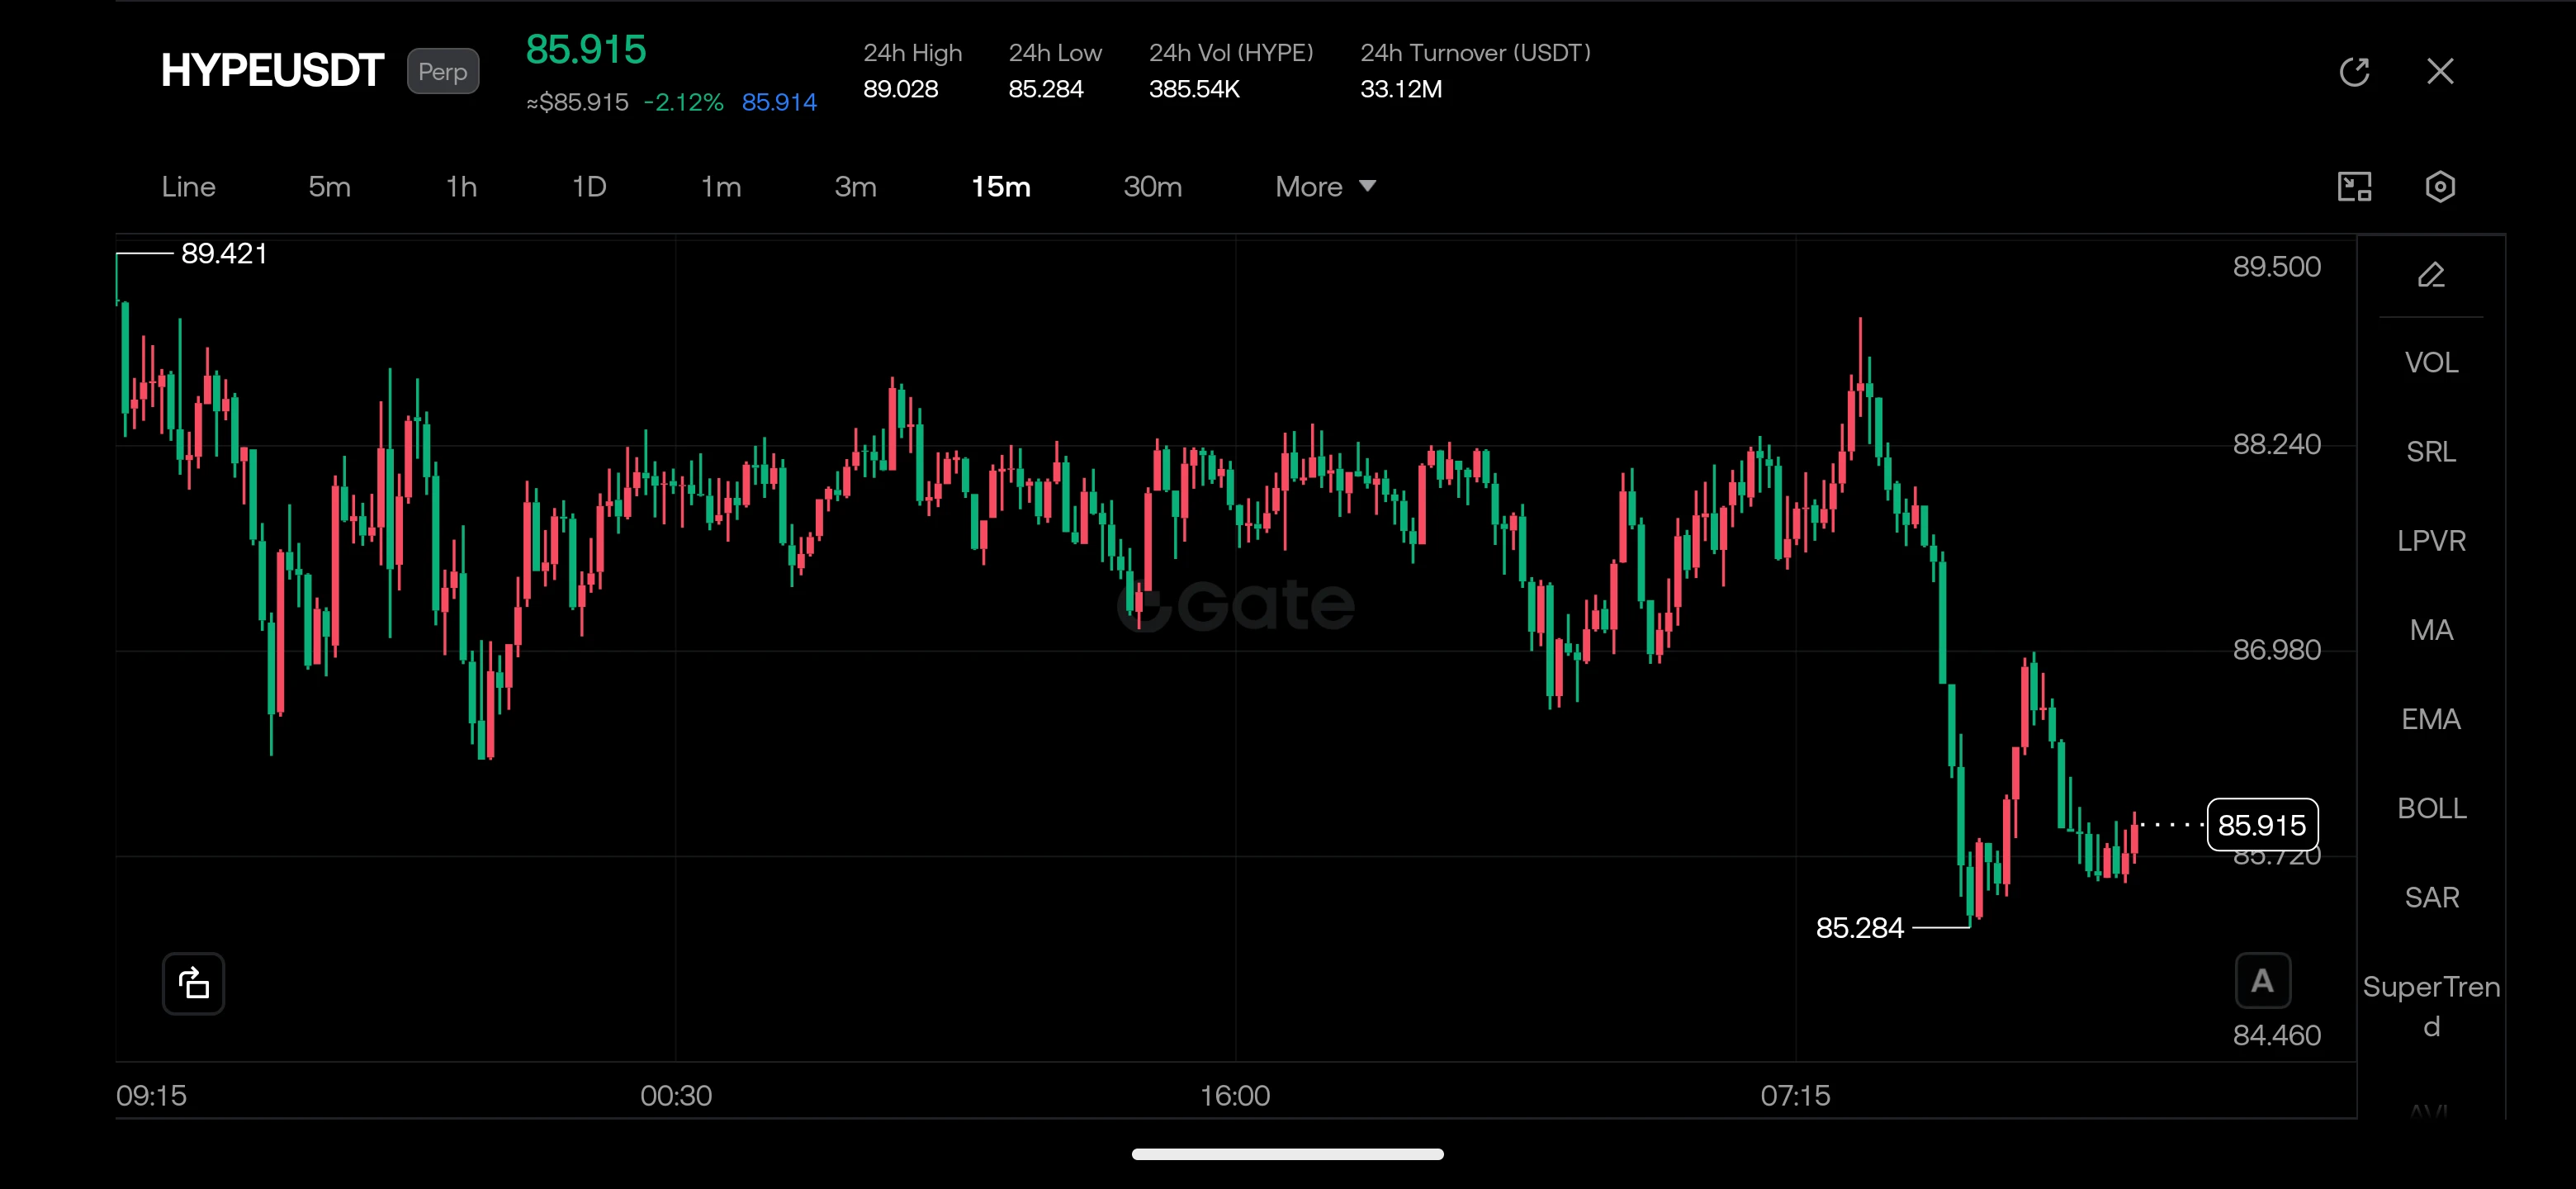
🔥 **Personal hook I'm watching: $HYPE just got slapped down to 85.28, and now it's quietly stabilizing.**

I've seen this movie before. A sharp flush, panic candles, then the sellers go quiet near the 24h low. The 15m chart is printing small higher lows right above 85.28. That's the kind of calm before something snaps. 👀

I'm eyeing a bounce play on HYPEUSDT (Perp).

📍 **Entry level:** 85.70 – 86.00

🎯 **TP1:** 86.98 (first resistance, take some off here)

🎯 **TP2:** 88.24 (the mid-range magnet)

🎯 **TP3:** 89.40 (retest of the recent high, the dream scenario 🚀)

🛑 **Stop loss:** 84.9
post-image
HYPE+0.24%
EURCAD+0.00%
NVDA-2.97%
INTC-0.92%
MU-1.11%
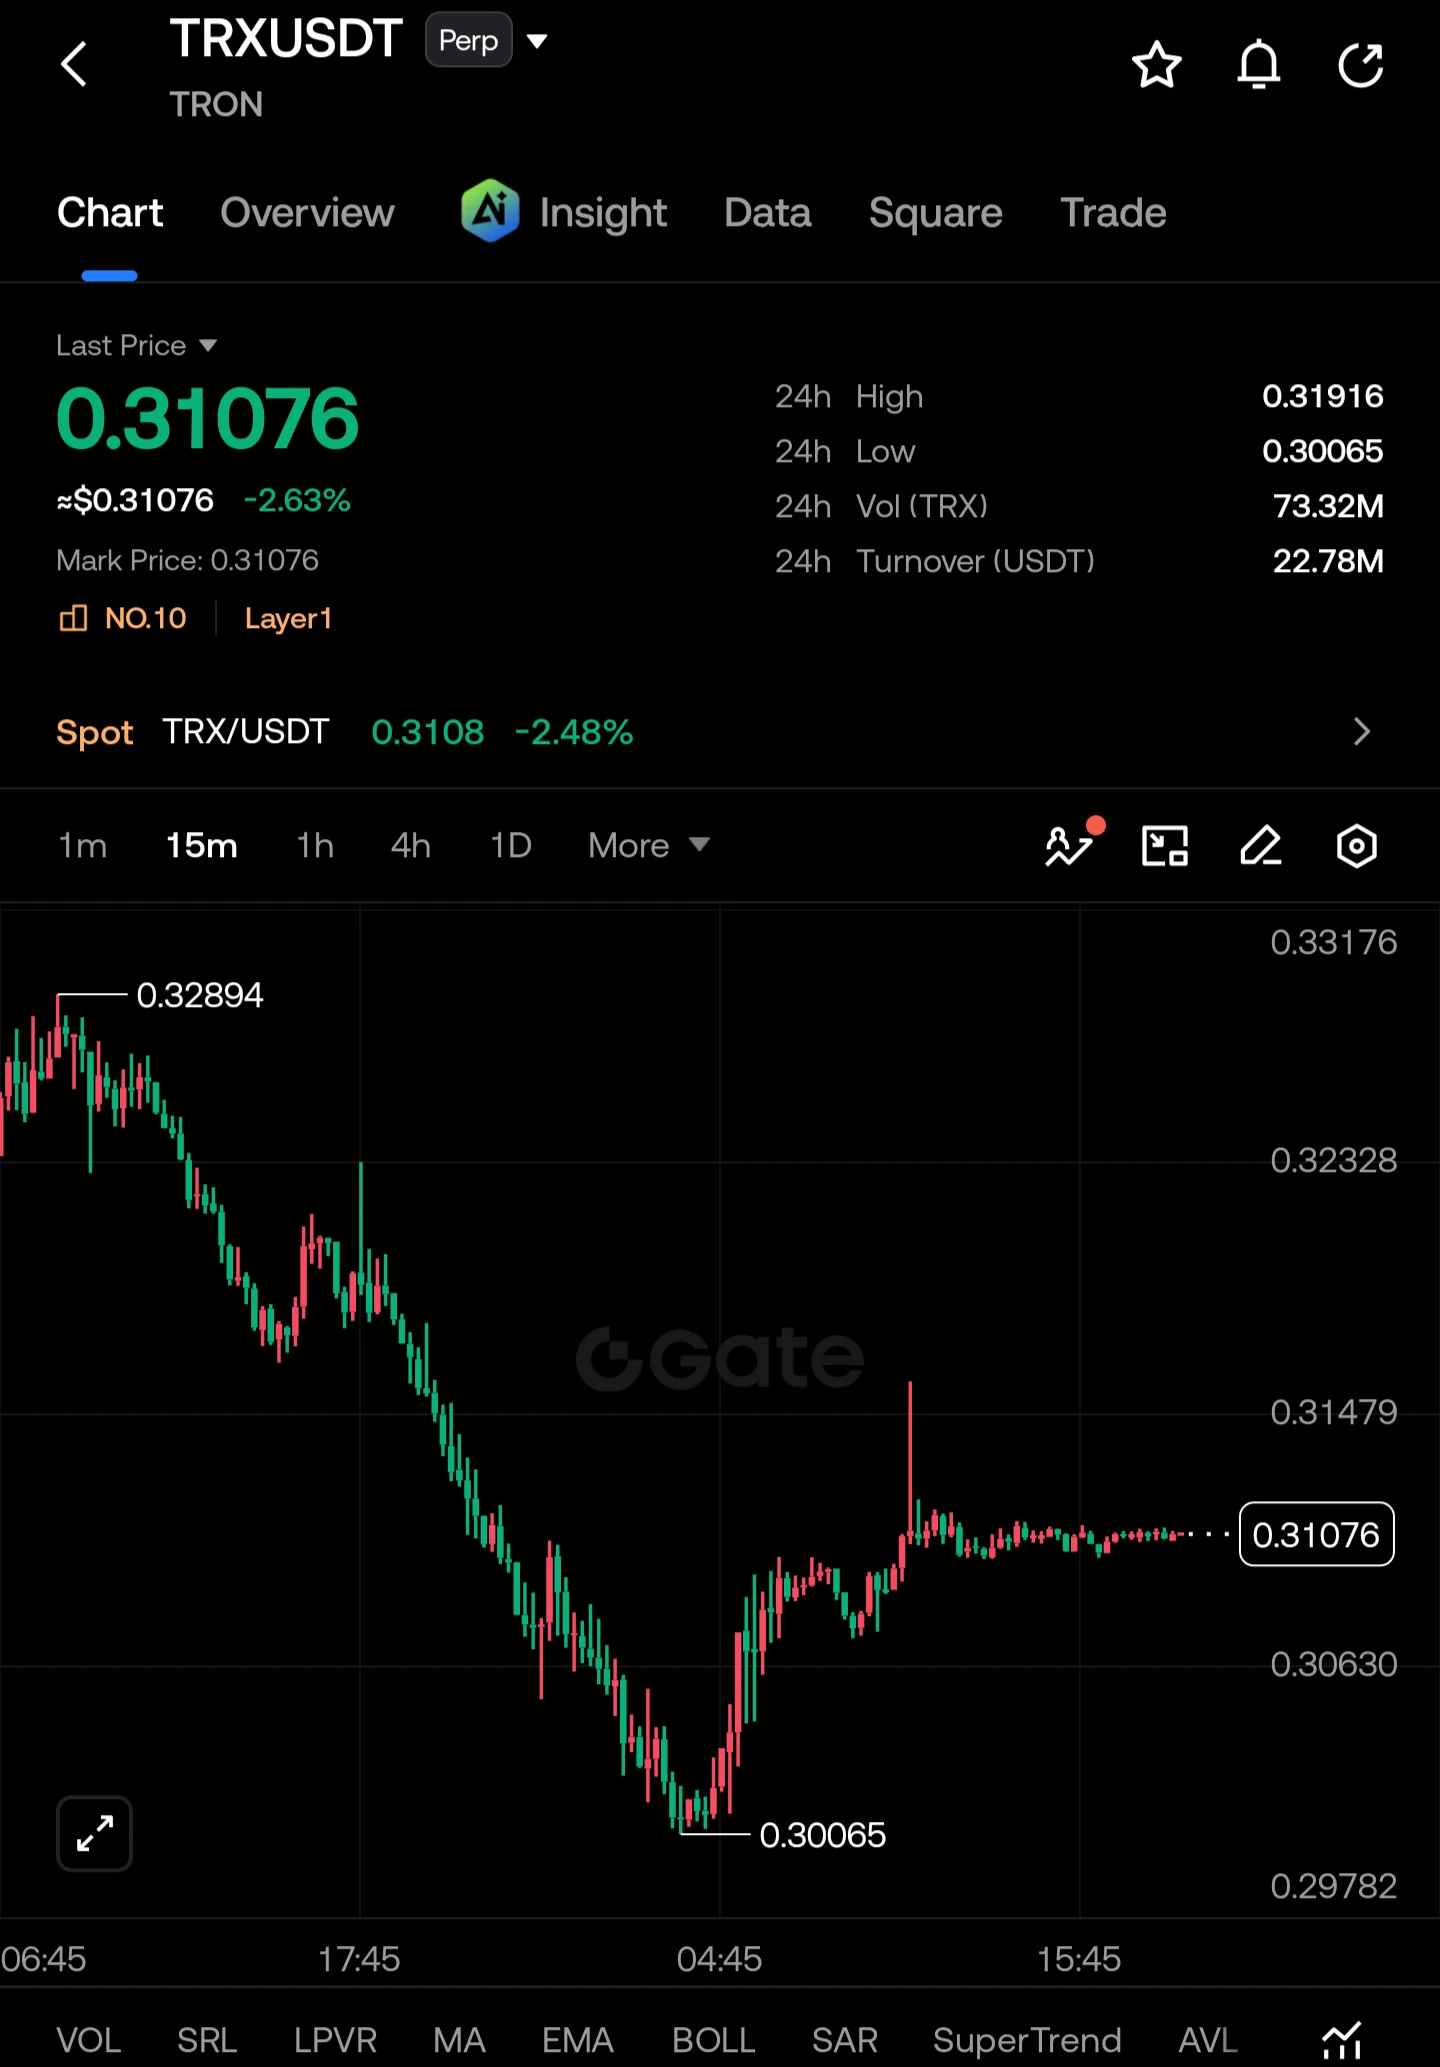
🚀 $TRX USDT – Bulls Are Trying to Take Control!

I'm watching $TRX closely here. After a strong sell-off toward 0.30065, buyers finally stepped in and pushed the price back up. Now TRX is holding around 0.31076, showing signs of short-term recovery.

The interesting part is whether buyers can maintain this momentum and break the nearby resistance. I'm watching for a continuation move rather than chasing blindly. 👀

📍 Entry Level: 0.3090 – 0.3110

🎯 TP1: 0.3148
🎯 TP2: 0.3192
🎯 TP3: 0.3233

🛑 STOP LOSS: 0.3058

DISCLAIMER: This is a technical analysis idea based on the 15-minute chart, no
post-image
TRX+0.42%
Load More