Square
Following
Hot
News
Notifications
Profile
Share your thoughts
placeholder
Article
#AVAX利好短时上涨6.4% #WCTCS9
Systemic Re-Rating: AVAX Exploits Institutional Liquidity Channels Following NYSE Infrastructure Node Integration
The Avalanche network ($AVAX ) has initiated a high-velocity structural breakout, defying broader market consolidation to post an explosive 6.4% intra-session expansion. This sudden upward trajectory was catalyzed by milestone institutional news, as the New York Stock Exchange (NYSE) revealed advanced development pipelines aimed at utilizing Avalanche’s high-throughput subnet architecture to deploy tokenized real-world enterprise assets (RWAs).
The digital a
AVAX-0.10%
  • 1
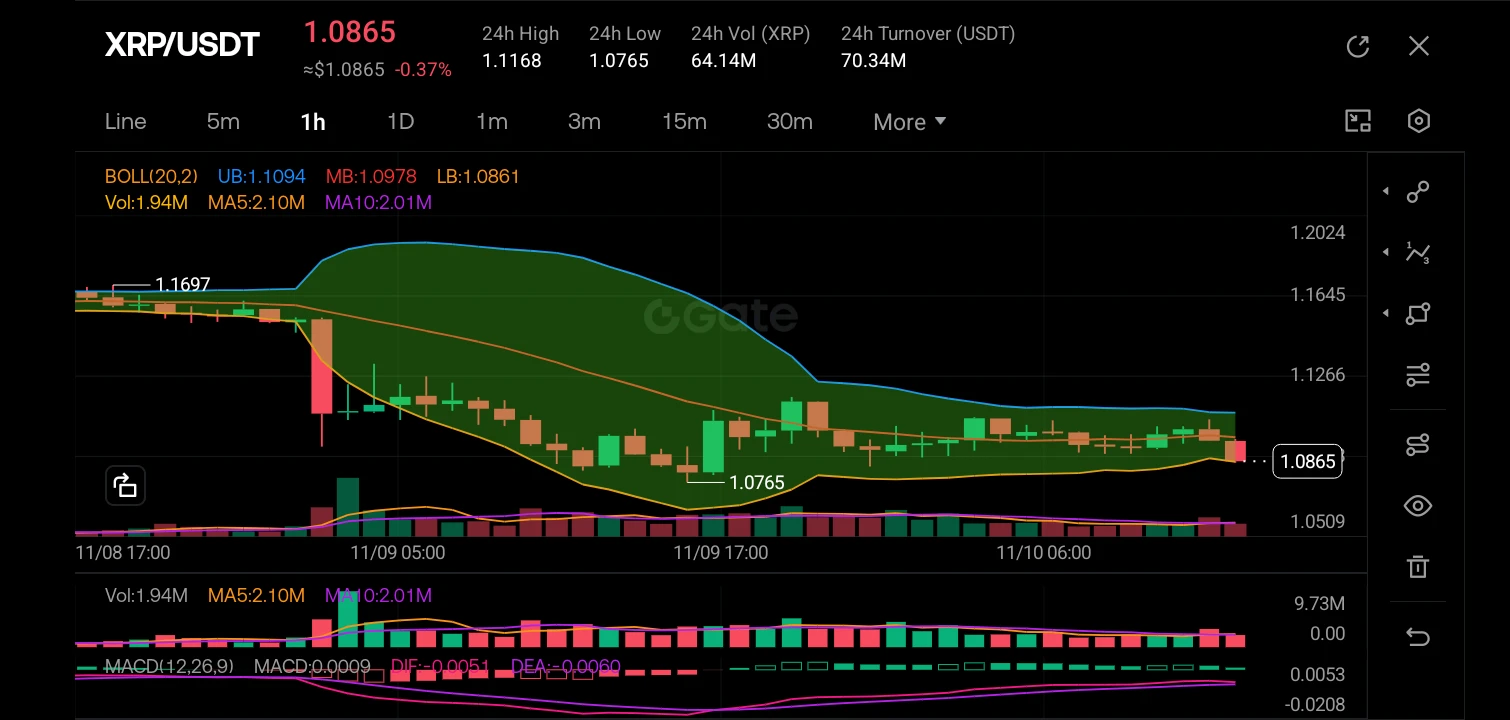
$XRP ‌
The market structure has clearly shifted from a bullish rally to a corrective bearish phase. After peaking near 1.1697, the price aggressively broke down, forming a steep descending channel. The structure is currently characterized by lower highs and lower lows, but we are seeing a potential stabilization attempt near the 1.0765 support level.

The K-lines show a strong initial sell-off followed by a period of consolidation. Price action is currently hugging the lower Bollinger Band (LB: 1.0861), indicating persistent selling pressure, though the band is beginning to flatten. The movi
post-image
XRP-1.15%
Trenches
PIEVERSE
P
bade
b
PIEVERSE
0x0e...25a9
Market Cap
$.
Change
.
24h Vol
$.
Holders
.
牛逼
牛
bade
b
牛逼
0x96...7777
Market Cap
$.
Change
.
24h Vol
$.
Holders
.
STONK
S
bade
b
STONK
6GmA...UNgx
Market Cap
$.
Change
.
24h Vol
$.
Holders
.
ON
O
bade
b
ON
0x0e...1d48
Market Cap
$.
Change
.
24h Vol
$.
Holders
.
FLOAT
F
bade
b
FLOAT
Bv1a...BMmr
Market Cap
$.
Change
.
24h Vol
$.
Holders
.
🚨 US CPI INFLATION DATA DROPS TODAY!
⏰ 8:30 AM ET
Previous: 0.6% | Forecast: 0.3%
Market Reaction:
↳ Above 0.3% → Bearish
↳ At 0.3% → Mixed reaction
↳ Below 0.3% → Bullish
Missing 2025 shutdown data means only monthly CPI rates will be released.
All eyes on inflation!
post-image
$B2 Repeated spikes followed by pullbacks—how should you position for an entry?

With the broader market having an impact, major coins are seeing little volatility and declining trading volume, and altcoins have weakened as well. B2 has repeatedly spiked and pulled back at the 0.48 resistance level. There is indeed heavy selling pressure here, and bears have established a strong defense.

However, B2 found support and rebounded again at 0.43 on declining volume. If it can retest 0.44 and volume picks up again, Sister Xing thinks it could continue pushing through around this level.

A breakout
B2-2.19%
Only 5 strong signals this round: JCT, AKE, SOXS; 2 long, 3 short. Watch volume and structure before acting. Last round: 5 wins, 1 loss, +34.2%; MUU, NXPC, and GRAM are each up about 9–10%, with 15 positions currently averaging +0.3%. The rhythm is still there; observe for now. 🎯 Last round's returns: MUU entry $15.5800 → exit $15.1000, 5.0x leverage, gained +9.2%; NXPC entry $0.1564 → exit $0.1589, 5x leverage, gained +9.2%; GRAM entry $1.0760 → exit $1.1090, 5.0x leverage, gained +10.0%━━━ Market View ━━━BTC 74,767 +1.2%, with short signals becoming more concentrated; negative funding rate
post-image
JCT-3.26%
AKE+6.39%
SOXS-22.80%
MUU+12.50%
NXPC+0.00%
$KORU Shocking! Whales’ 5% long/short ratio is bearing down like a mountain. Don’t catch a falling knife—the bounce is a chance to short!

In the face of overwhelming capital, any technical rebound is a paper tiger.

Personal view and case: Don’t be fooled by KORU’s sharp rally from 6.21 to 7.95—it’s clearly a trap to lure in longs before wiping them out. Whale data doesn’t lie: 286 short positions hold 53.4 million U, with 7.27 million in unrealized profit. The positions held by 75 longs are barely a drop in the bucket.

Short-term funds are fleeing across timeframes from 5m to 1h, with outfl
KORU-1.22%
gm Elysium printers
another day to log on and lose money.
post-image
Reality has repeatedly taught people to leave themselves a way out. They don't dare quit their jobs lightly or take time off when they get sick. Buying a home, retirement, children's education—which of these doesn't require money? It's not that many people don't want to spend; they just don't dare. When real difficulties arise, others may not be able to bail you out. Ultimately, the sense of security people talk about still has to be supported by their own savings.
At the end of the day, it's not that people don't want to enjoy life. It's the uncertainty of the future that makes them prepare i
post-image
I quite like using #闲钱宝
I like placing my limit orders low; sometimes they go unfilled for several days. What I like most about Idle Cash Bao is that my funds earn a return while my order is resting. Even if I don't manage to buy, at least those few days weren't wasted! #闲聊 $NVDA
post-image
NVDA-4.34%
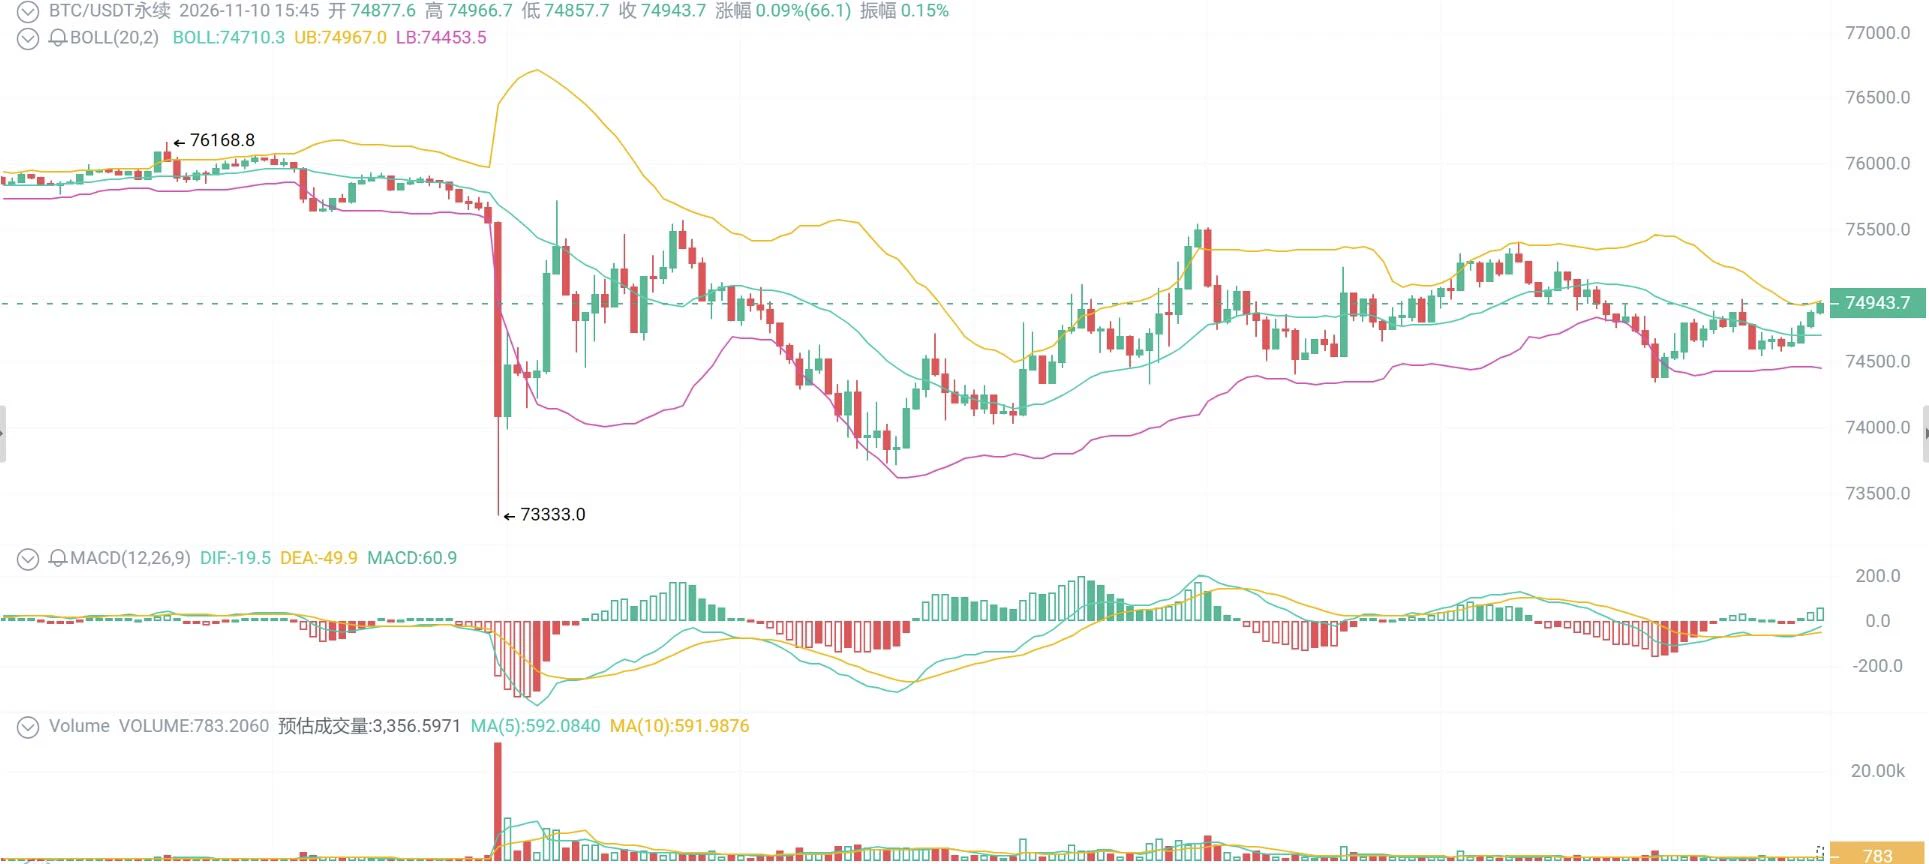
Bitcoin is maintaining a bullish outlook for now. The wide short-term swings are more of a shakeout and consolidation before the next move, so don't let the back-and-forth news disrupt your rhythm. Despite multiple dips, the market has not seen a sustained breakdown, and buyers are firmly defending support below. The repeated volatility is essentially digesting geopolitical news while awaiting the data.

Tonight's CPI is more of a short-term disturbance and is unlikely to reverse the broader trend. As long as key support holds, a pullback that stabilizes presents an opportunity to buy the dip
post-image
BTC-0.65%
ETH-1.23%
SOL-0.74%
Computing power isn’t short on money—it’s short on electricity!
Morgan Stanley estimates that, hit by the “Blue Tide,”
around 20% of new data center projects could be delayed until 2029, and 40% of chips already shipped won’t be powered up before 2028.
AI’s bottleneck has shifted from “can’t get a GPU” to “can’t get plugged in.”
Think it through, and this is actually a window of opportunity for crypto markets!
Mining farms have existing grid interconnection capacity and load-management capabilities. The pricing power over computing assets and grid resources is being reshuffled.
Army’s outlook:
post-image
Featured📈 AI tech stocks rebound strongly—who will lead the next wave?
Last week, AI tech stocks experienced sharp volatility, with popular stocks such as $NVDA and $AMD rebounding after steep pullbacks.
Will the rebound continue, or will they pull back again?

💬 Let's hear your take today:
If you had to pick one AI tech stock now, which one would you bet on? Share your pick and why you like it.

🌟 Gate Square's Stock Chat Season is underway
Three outstanding authors are selected daily, each receiving 5 USDT plus an official featured spot to give your investment insights more exposure.

Post your
post-image
NVDA-4.34%
AMD+13.35%
  • 5
  • 1
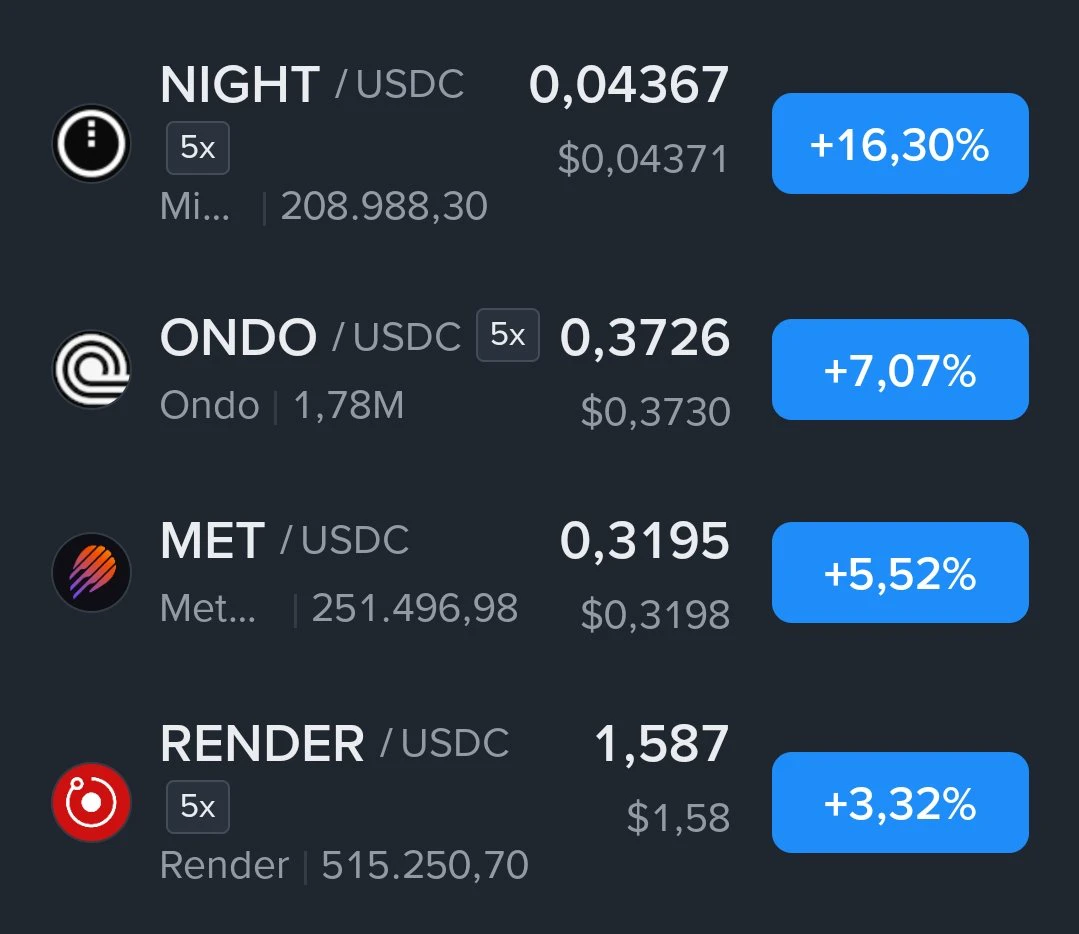
$NIGHT $ondo $met
#EXO_KASE #Riyadh_now
post-image
NIGHT-3.10%
ONDO-0.29%
MET-0.33%
What Is the Brier Score? How Can Mathematical Methods Evaluate the Quality of a Trading Model’s Probability Predictions?

In crypto quantitative trading, even if a model often correctly predicts whether prices will rise or fall, that does not mean the probabilities it gives are reliable. For example, if a model predicts a 90% chance that BTC will rise, but prices rise only 60% of the time after similar predictions, it may be overconfident. The Brier score can help us evaluate the error between probability predictions and actual outcomes.

First, what is the Brier score?

For binary predictions
post-image
BTC-0.67%
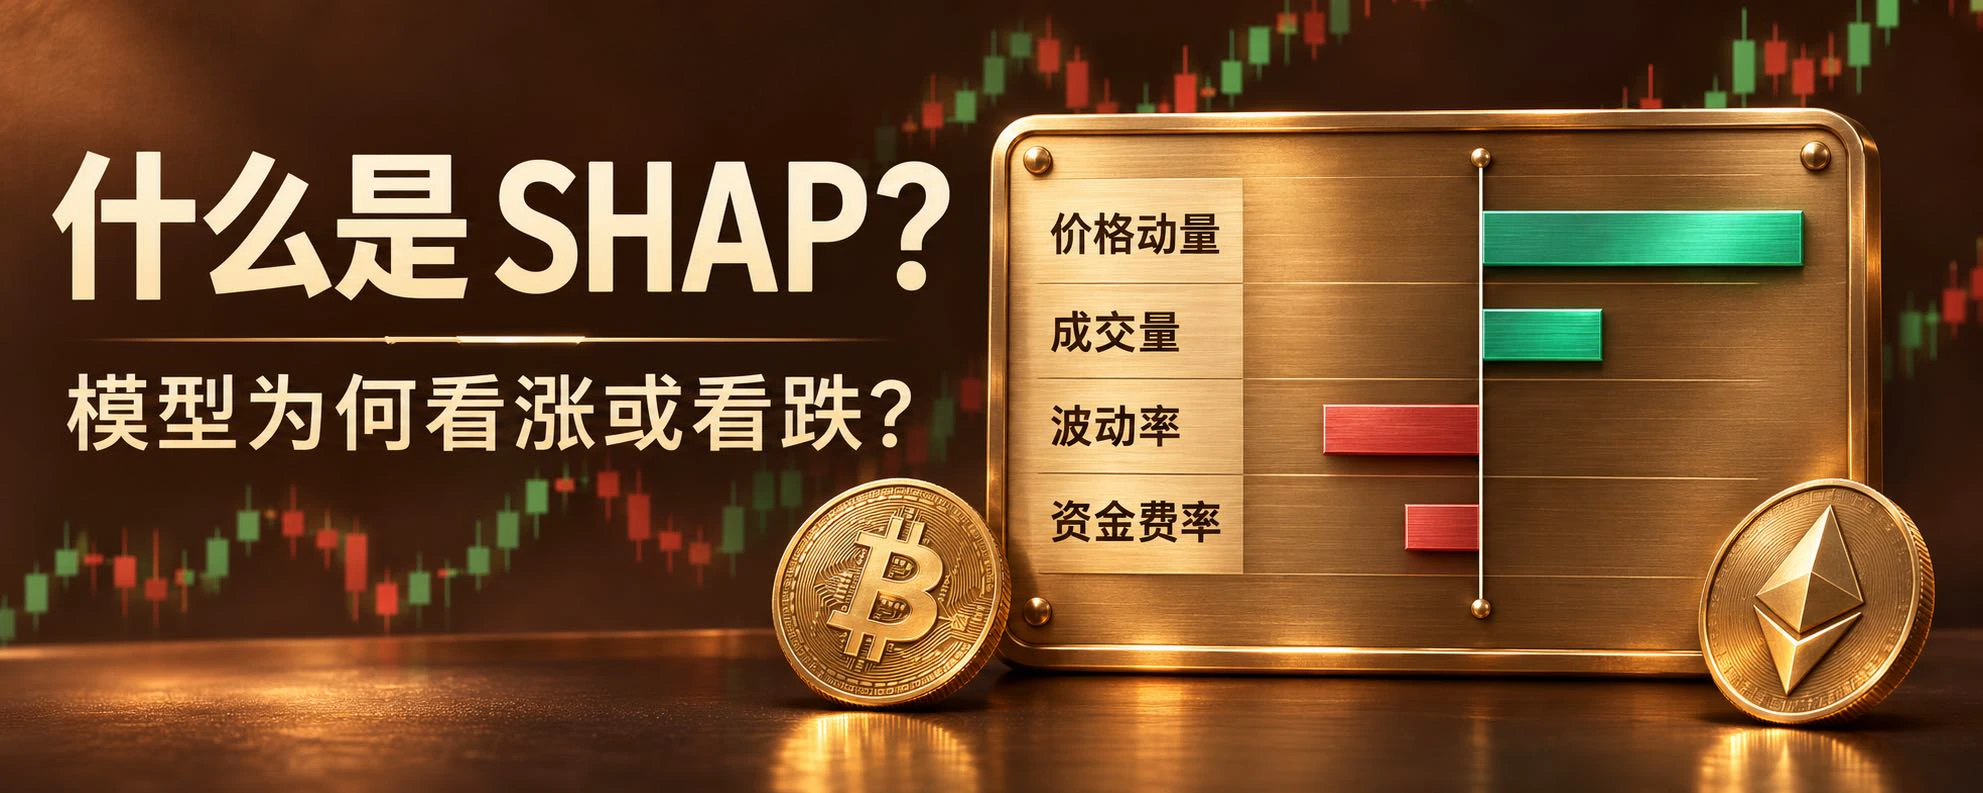
What Is SHAP? How Can It Explain Why a Machine Learning Model Gives a Bullish or Bearish Prediction?

In crypto quantitative trading, machine learning models may use features such as price momentum, trading volume, volatility, and funding rates to predict future price movements. But when a model predicts a bullish or bearish outcome, that does not mean traders know why it made that prediction. SHAP is a method for helping explain model predictions by analyzing how different features contribute to an individual prediction.

First, what is SHAP?

SHAP is based on the idea of Shapley values, whic
post-image
BTC-0.67%
A 5% jump does not, by itself, constitute a trend.

The sharp rise in the KOSPI, which exceeded 5%, was driven primarily by Samsung and SK Hynix. From the perspective of an individual investor, I do not view this move as the beginning of a trend.

Data flows originating from the U.S. and various geopolitical developments remain unclear. In the current climate, it is wiser to maintain a cautious approach and wait for the markets to settle. On days like these, the costliest mistake one can make is to increase one’s position out of fear of missing out on a single day’s rally. While this surge off
post-image
Afternoon Market Updates
live-cover
LIVE1,933
[NEW STREAMER]Market update💕
live-cover
LIVE5,088
A major hack bombshell, yet it surged 80%? $INIT The whales’ master plan—retail traders, don’t become cannon fodder!

Once the bad news is out, it’s good news; whales are bloodthirsty and leave nothing behind!

Guys, the major bearish news of the INIT hack being halted has somehow sent the price up 80%! Look at the fund flows: major players are aggressively net buying over the medium to long term. Look at the liquidation map: there are shorts trapped all over above. And look at the whales: the long-short ratio is 234%, and shorts with an average entry price of 0.17 are now deeply underwater!
INIT-1.74%
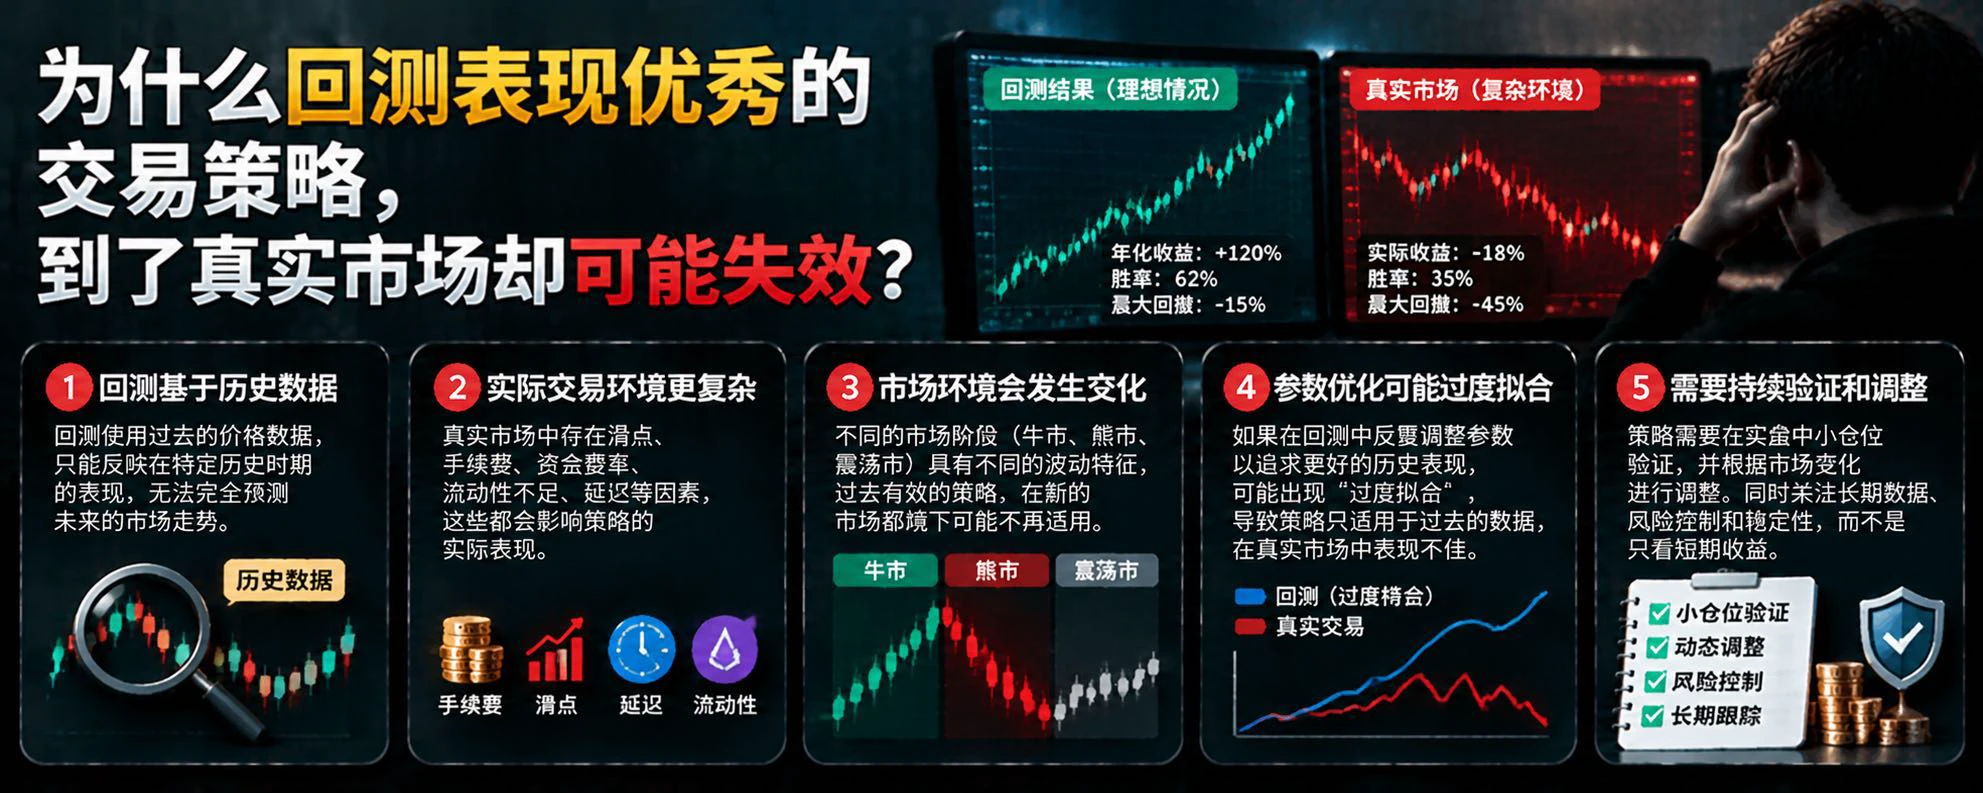
What Is Walk-Forward Testing? Why Can Backtesting Over a Fixed Period Hide Strategy Flaws?

In cryptocurrency trading, market conditions are constantly changing. A strategy may perform exceptionally well in a bull market but suffer frequent stop-outs in a sideways market; it may also be profitable on a particular stretch of historical data but fail to adapt to subsequent volatility. Walk-forward testing can help traders assess how well a strategy adapts across different periods.

First, what is walk-forward testing?

Walk-forward testing typically divides historical data into consecutive time
post-image
Load More

Join 40 M users in our growing community

⚡️ Join 40 M users in the crypto craze discussion

💬 Engage with your favorite top creators

👍 See what interests you

Trending Topics

GateGlobalComplianceExpansion

24.88k Views192 Discussing

Gate continues to expand its global compliance footprint, now covering 81 regulated jurisdictions across Europe, North America, Asia, and Oceania. From MiCA and U.S. state-level MTLs to Japan’s FSA, Dubai, and Australia-related regulatory approvals, global exchanges are entering a new stage of compliance competition. Do you think regulatory strength will become as important as products and liquidity for exchanges in the future?

USCPIDataIncoming

52.57k Views2.26k Discussing

USIranTalksShowNewProgress

8.68k Views1.29k Discussing

View More