Square
Following
Hot
News
Profile
Share your thoughts
placeholder
Article
CRYPTO MARKET OVERVIEW
live-cover
LIVE1,843
$QNT ‌ is bouncing from a key zone, but can buyers turn this recovery into a real comeback?
QNT is up nearly 10% today, trading around $194 after a prolonged pullback from its $374.50 peak. The encouraging part is that price remains above the daily Supertrend at $159.77, giving bulls an important level to defend.
Key levels on my radar:
Support: $185 to $176
Major support: $159.77
Resistance: $200 to $215
Next hurdle: $251
A clean reclaim of $200 could open the door toward $215. If buyers lose the $176 zone, another dip becomes possible.
QNT is showing signs of renewed strength. Now the focu
QNT+9.57%
SPCX+1.88%
  • 3
  • 1
Trenches
STONK
S
bade
b
STONK
6GmA...UNgx
Market Cap
$.
Change
.
24h Vol
$.
Holders
.
BTC
B
bade
b
BTC
C5xp...pump
Market Cap
$.
Change
.
24h Vol
$.
Holders
.
CNPY
C
bade
b
CNPY
0xc6...ddd2
Market Cap
$.
Change
.
24h Vol
$.
Holders
.
ZIG
Z
bade
b
ZIG
0x8c...1145
Market Cap
$.
Change
.
24h Vol
$.
Holders
.
LAUNCH
L
bade
b
LAUNCH
AhBi...Qj6C
Market Cap
$.
Change
.
24h Vol
$.
Holders
.
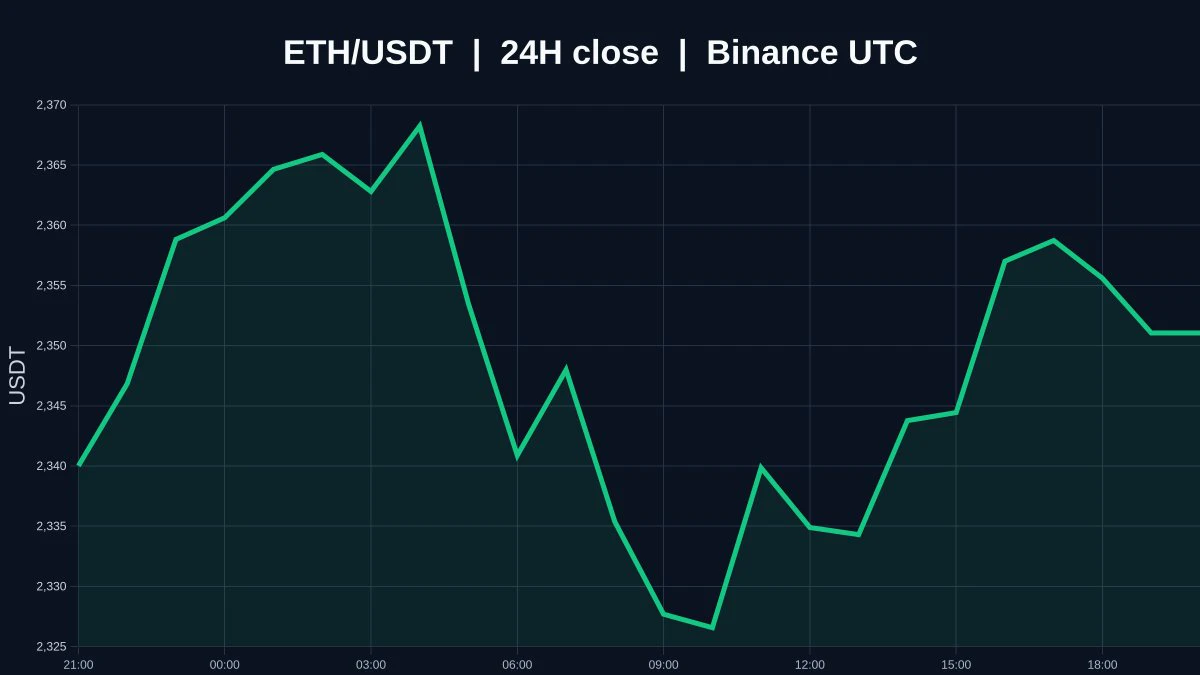
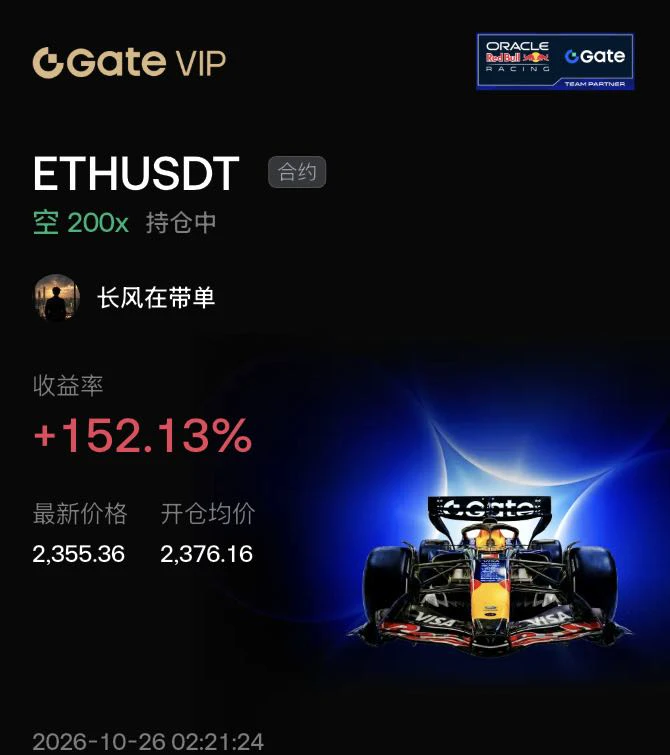
$ETH Currently trading at 2,351.05, up 0.35% over 24H (range: 2,318–2,371.52). The 1H trend is strong, with an RSI of 56; the 4H trend is weak, with an RSI of 35. If it breaks above 2,371.52 convincingly, watch for further upside; if it falls below the 2,318 support, the short-term structure may weaken. The market is volatile; for observation only.
post-image
ETH+0.48%
$GRIFFAIN This coin’s funding rate was once very high, with longs willing to pay significantly elevated costs to keep their positions open. If that situation persists, the market can easily become overheated.
I opened a short when the funding rate was high and the price was struggling to rise. The logic was that longs’ costs would keep piling up, and their subsequent position reductions could themselves push the price down. Later, the market weakened, and forced selling amplified the decline.
This short trade returned more than 2x, mainly by capturing the deleveraging phase. What really drives
GRIFFAIN+1.94%
BTC+0.12%
ETH+0.53%
A whale/institutional entity holds ETH long positions worth over $270 million that are now on the ve
live-cover
LIVE1,300
The chart will judge for us 🥱As always, before any coin skyrockets, you can find the mafia and his gang 😉Look at our entry point on the chart before $GT ; while you were still considering the upside, we had already entered. This kind of trade, no one can offer you except the mafia 💀🔥
Goodbye 👋🏻
post-image
GT+0.20%
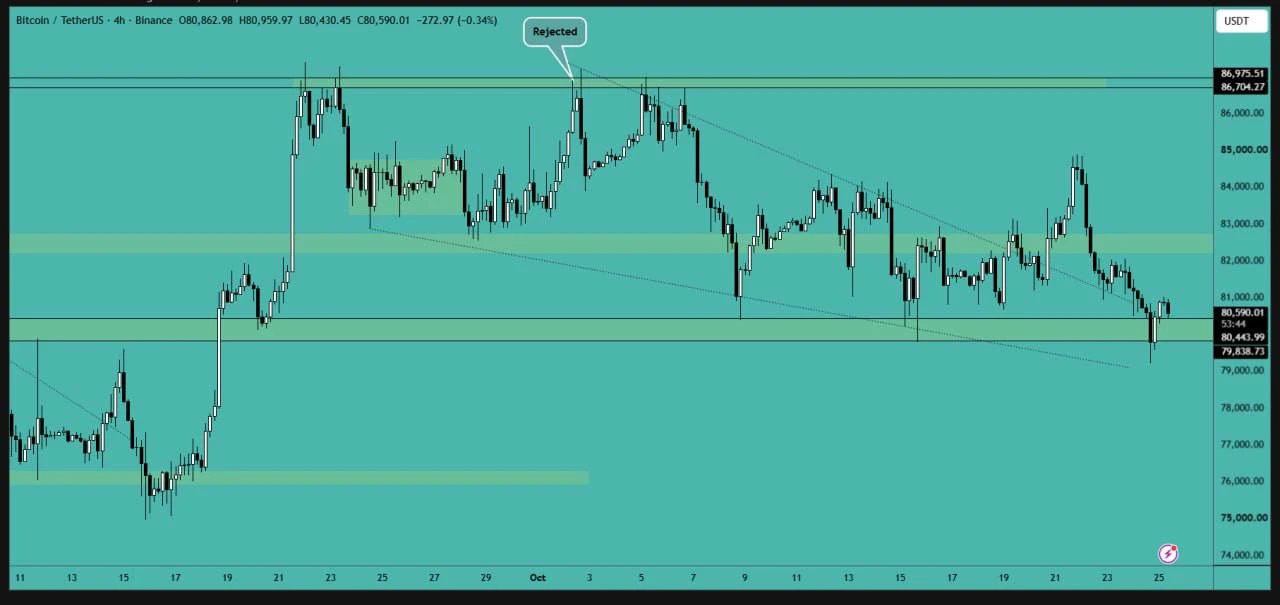
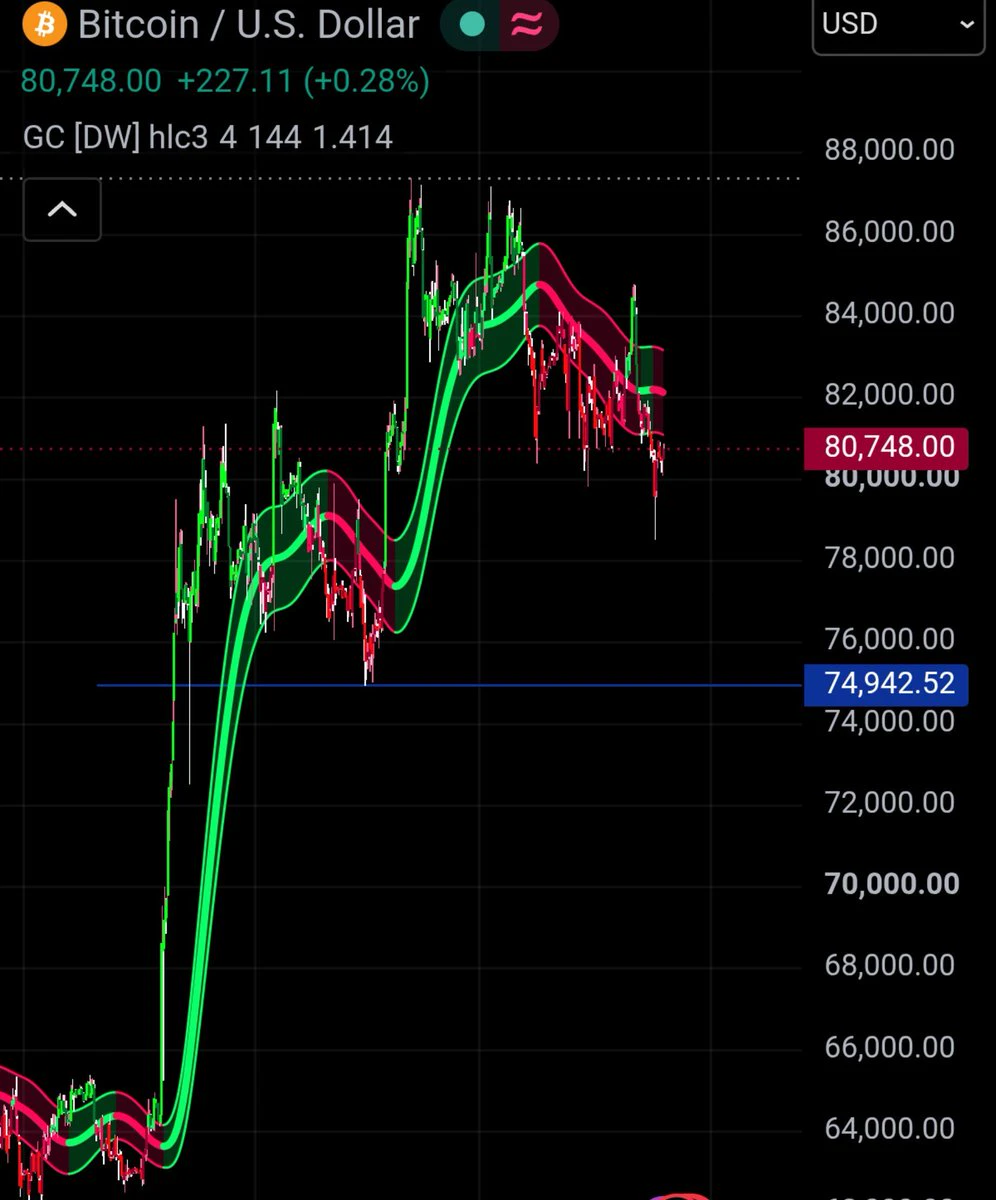
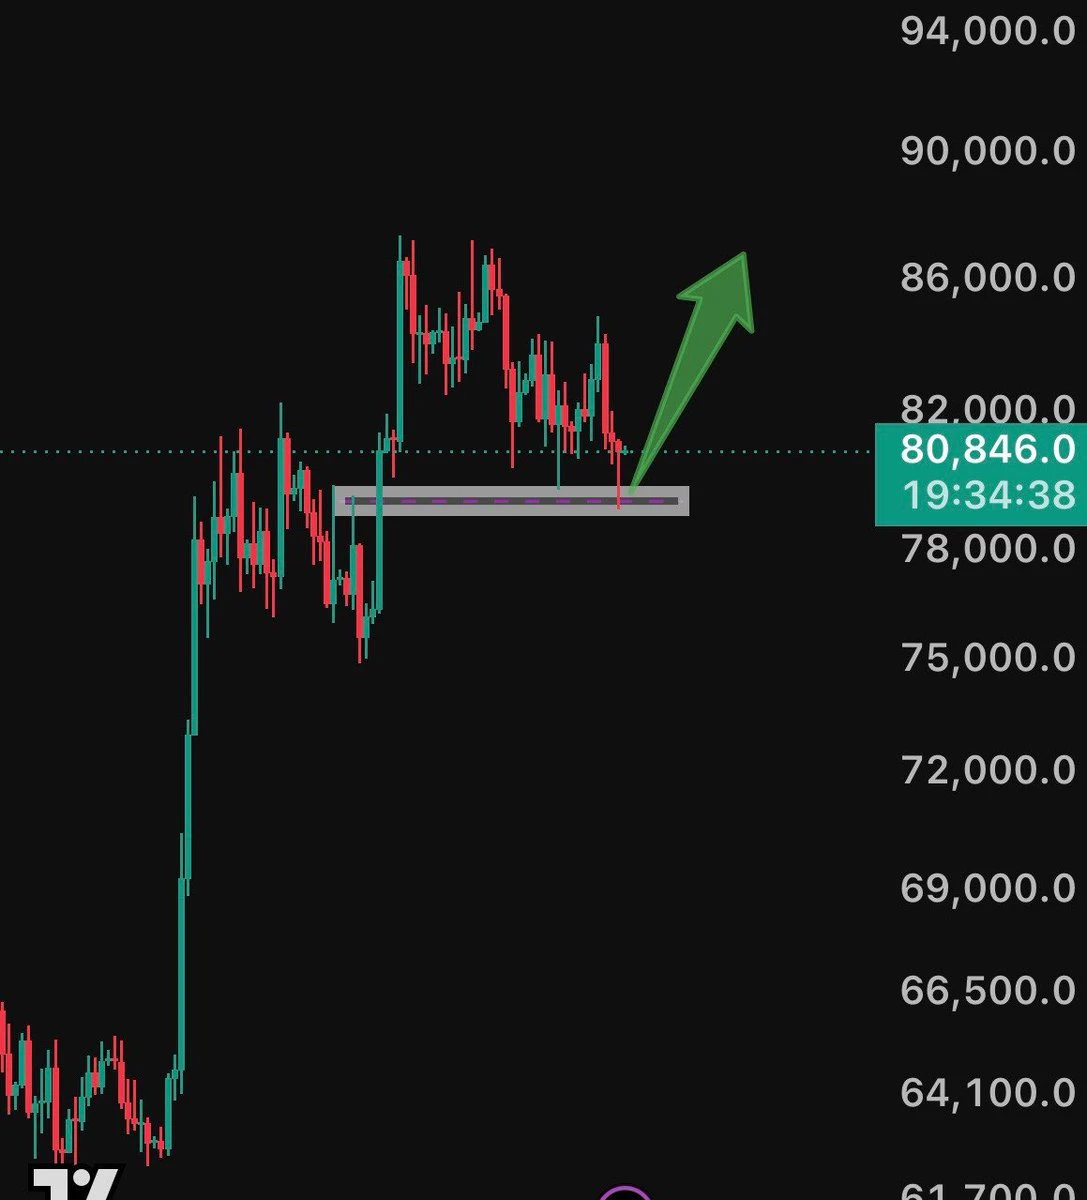
Bitcoin is testing the support area and has managed to hold above it. Volume is low due to the weekend, and choppy movement is expected until the market opens on Monday.
$BTC ‌#GateSquareNewCreatorProgram #ShareWeekly
post-image
BTC+0.09%
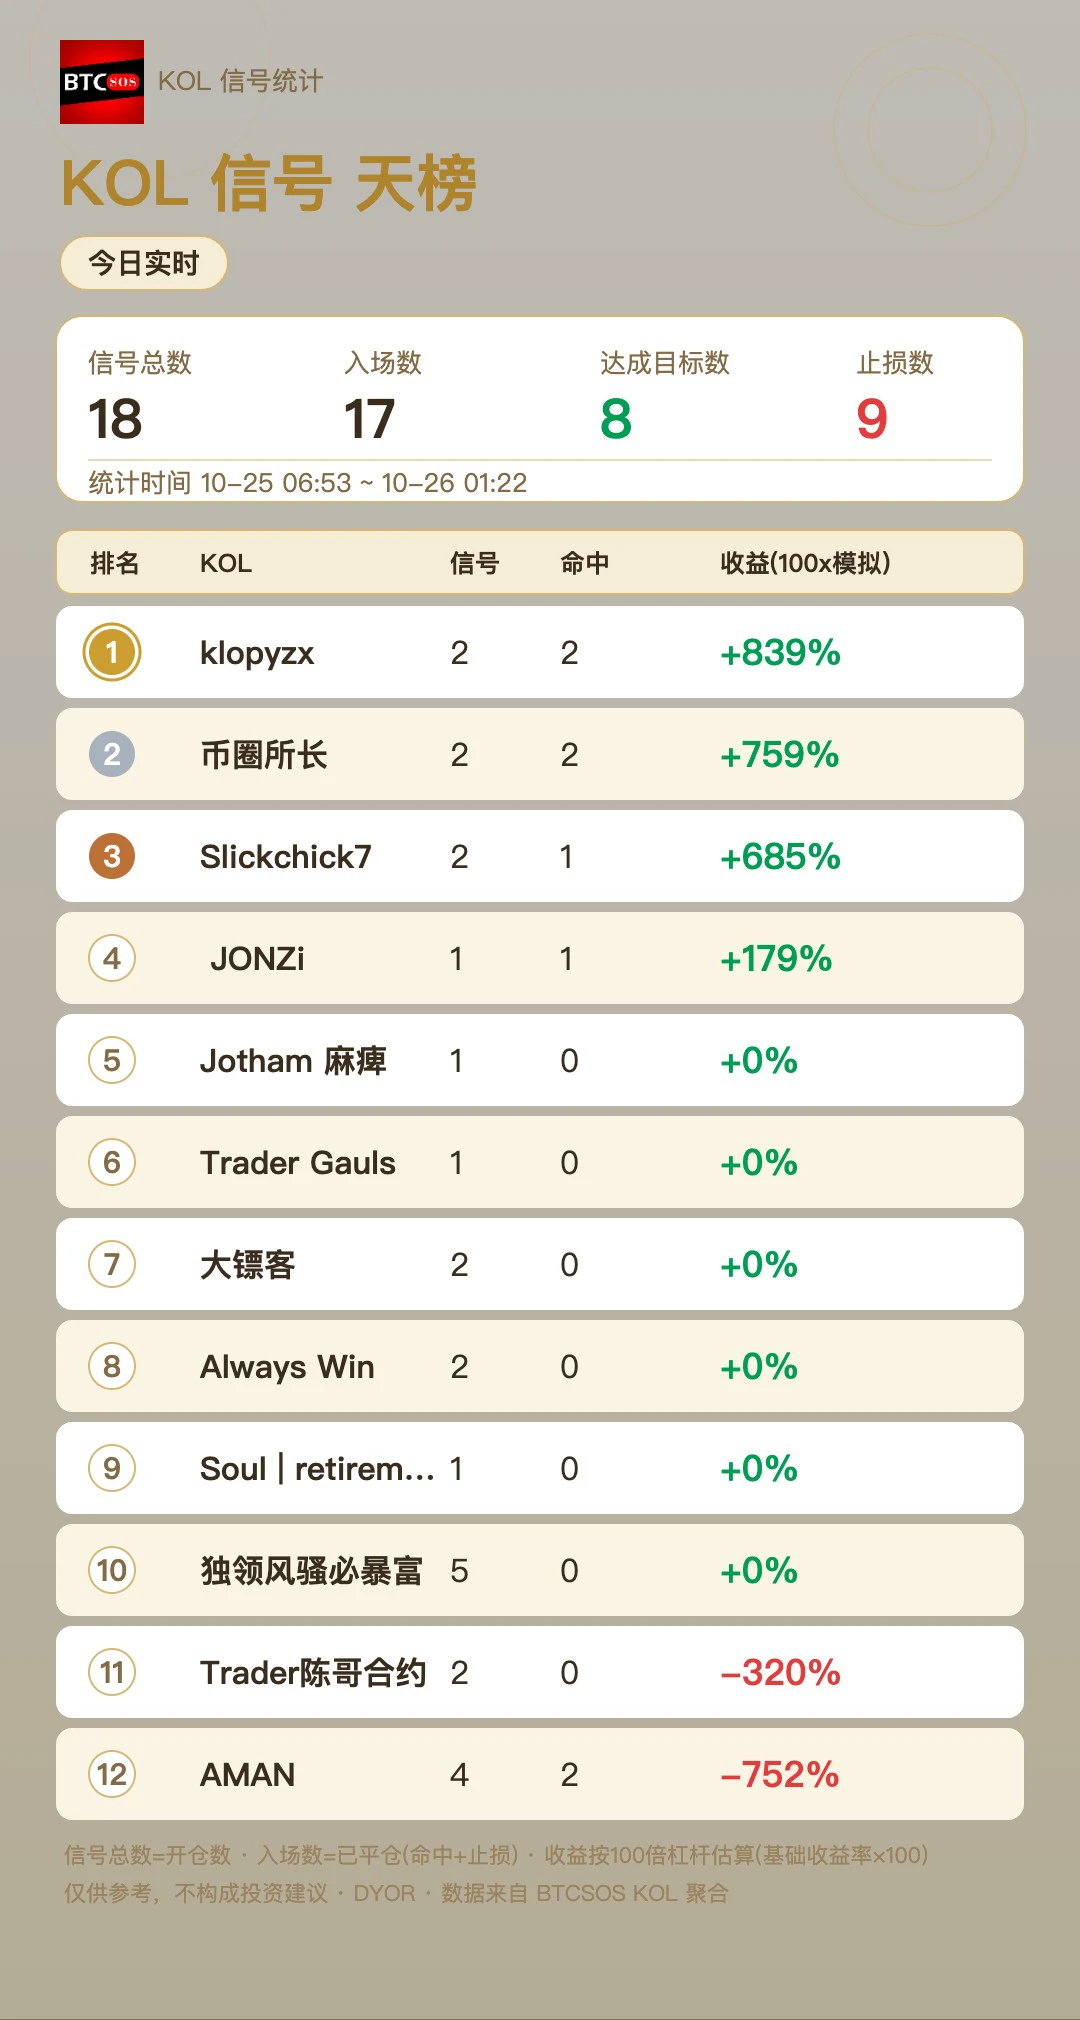
Today’s KOL leaderboard is here: 18 signals, 17 settled, 8 hits and 9 stop-losses, putting the overall win rate below 50%. Top-ranked klopyzx won both trades, with simulated returns of +839%, firmly securing the top spot; 币圈所长 follows close behind at +759%. One reminder: figures are based on simulated 100x trading, and looking good on the leaderboard ≠ guaranteed wins. See the image for the full leaderboard. 👀 By the way, klopyzx also topped last period’s (10-25) leaderboard (+839%), making it two in a row. 👀#Samsung Q3 profit forecast to rise nearly 8-fold; full earnings report coming soon
post-image
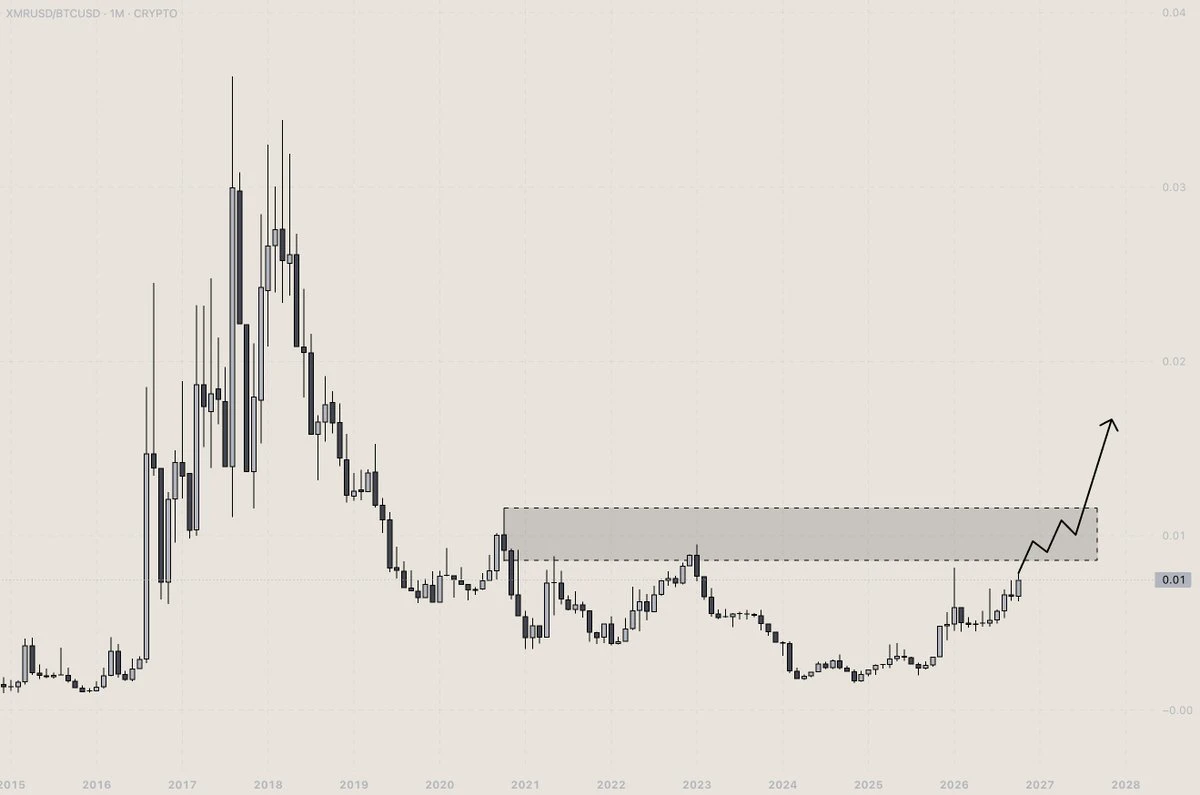
most interesting alt chart in crypto right now
my 3 major bags are $BTC , $HYPE , and $XMR
happy with my $BTC and $HYPE bags, looking to add more $XMR on dips
the XMR/BTC chart looks ready to break out of this 7 year accumulation
monero is the only real private money
post-image
BTC+0.09%
HYPE+1.74%
XMR+0.00%
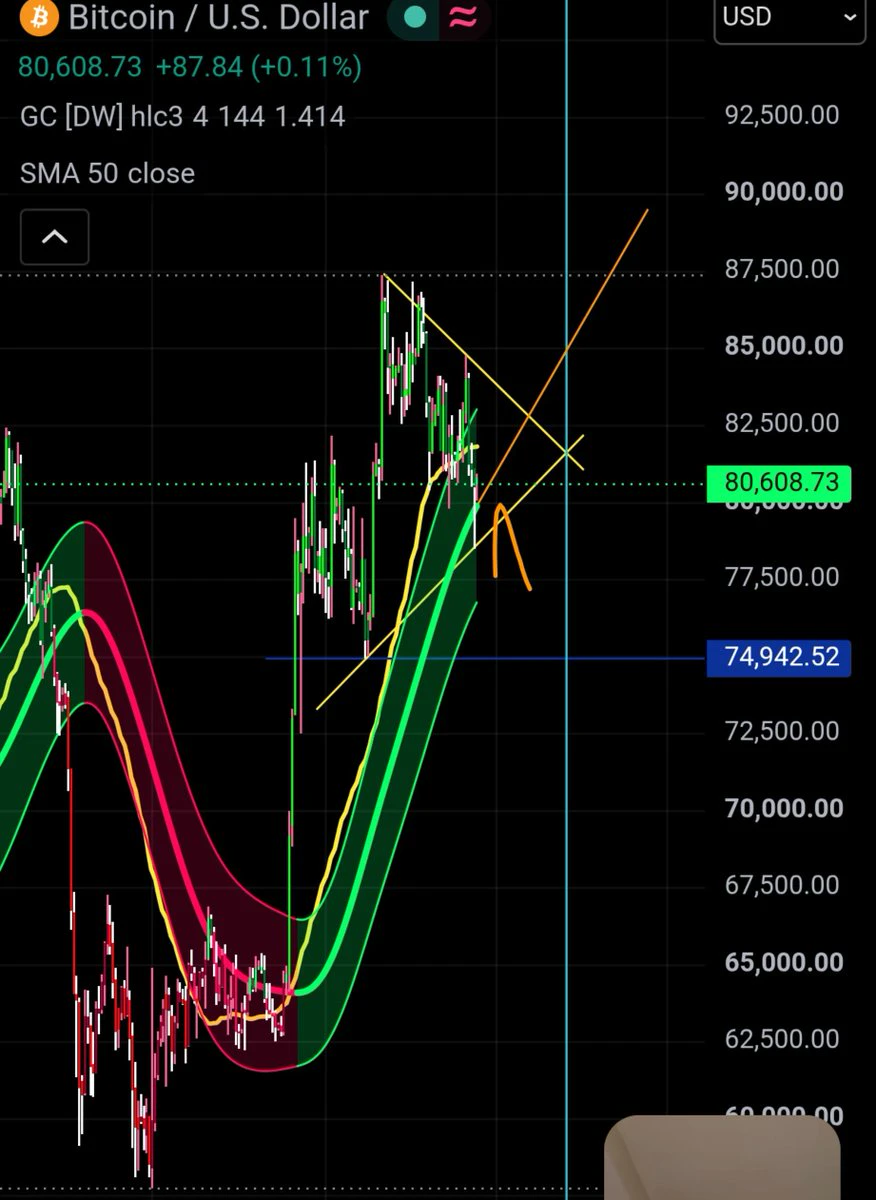
Flirt with 74k then we can talk
$BTC
post-image
BTC+0.09%
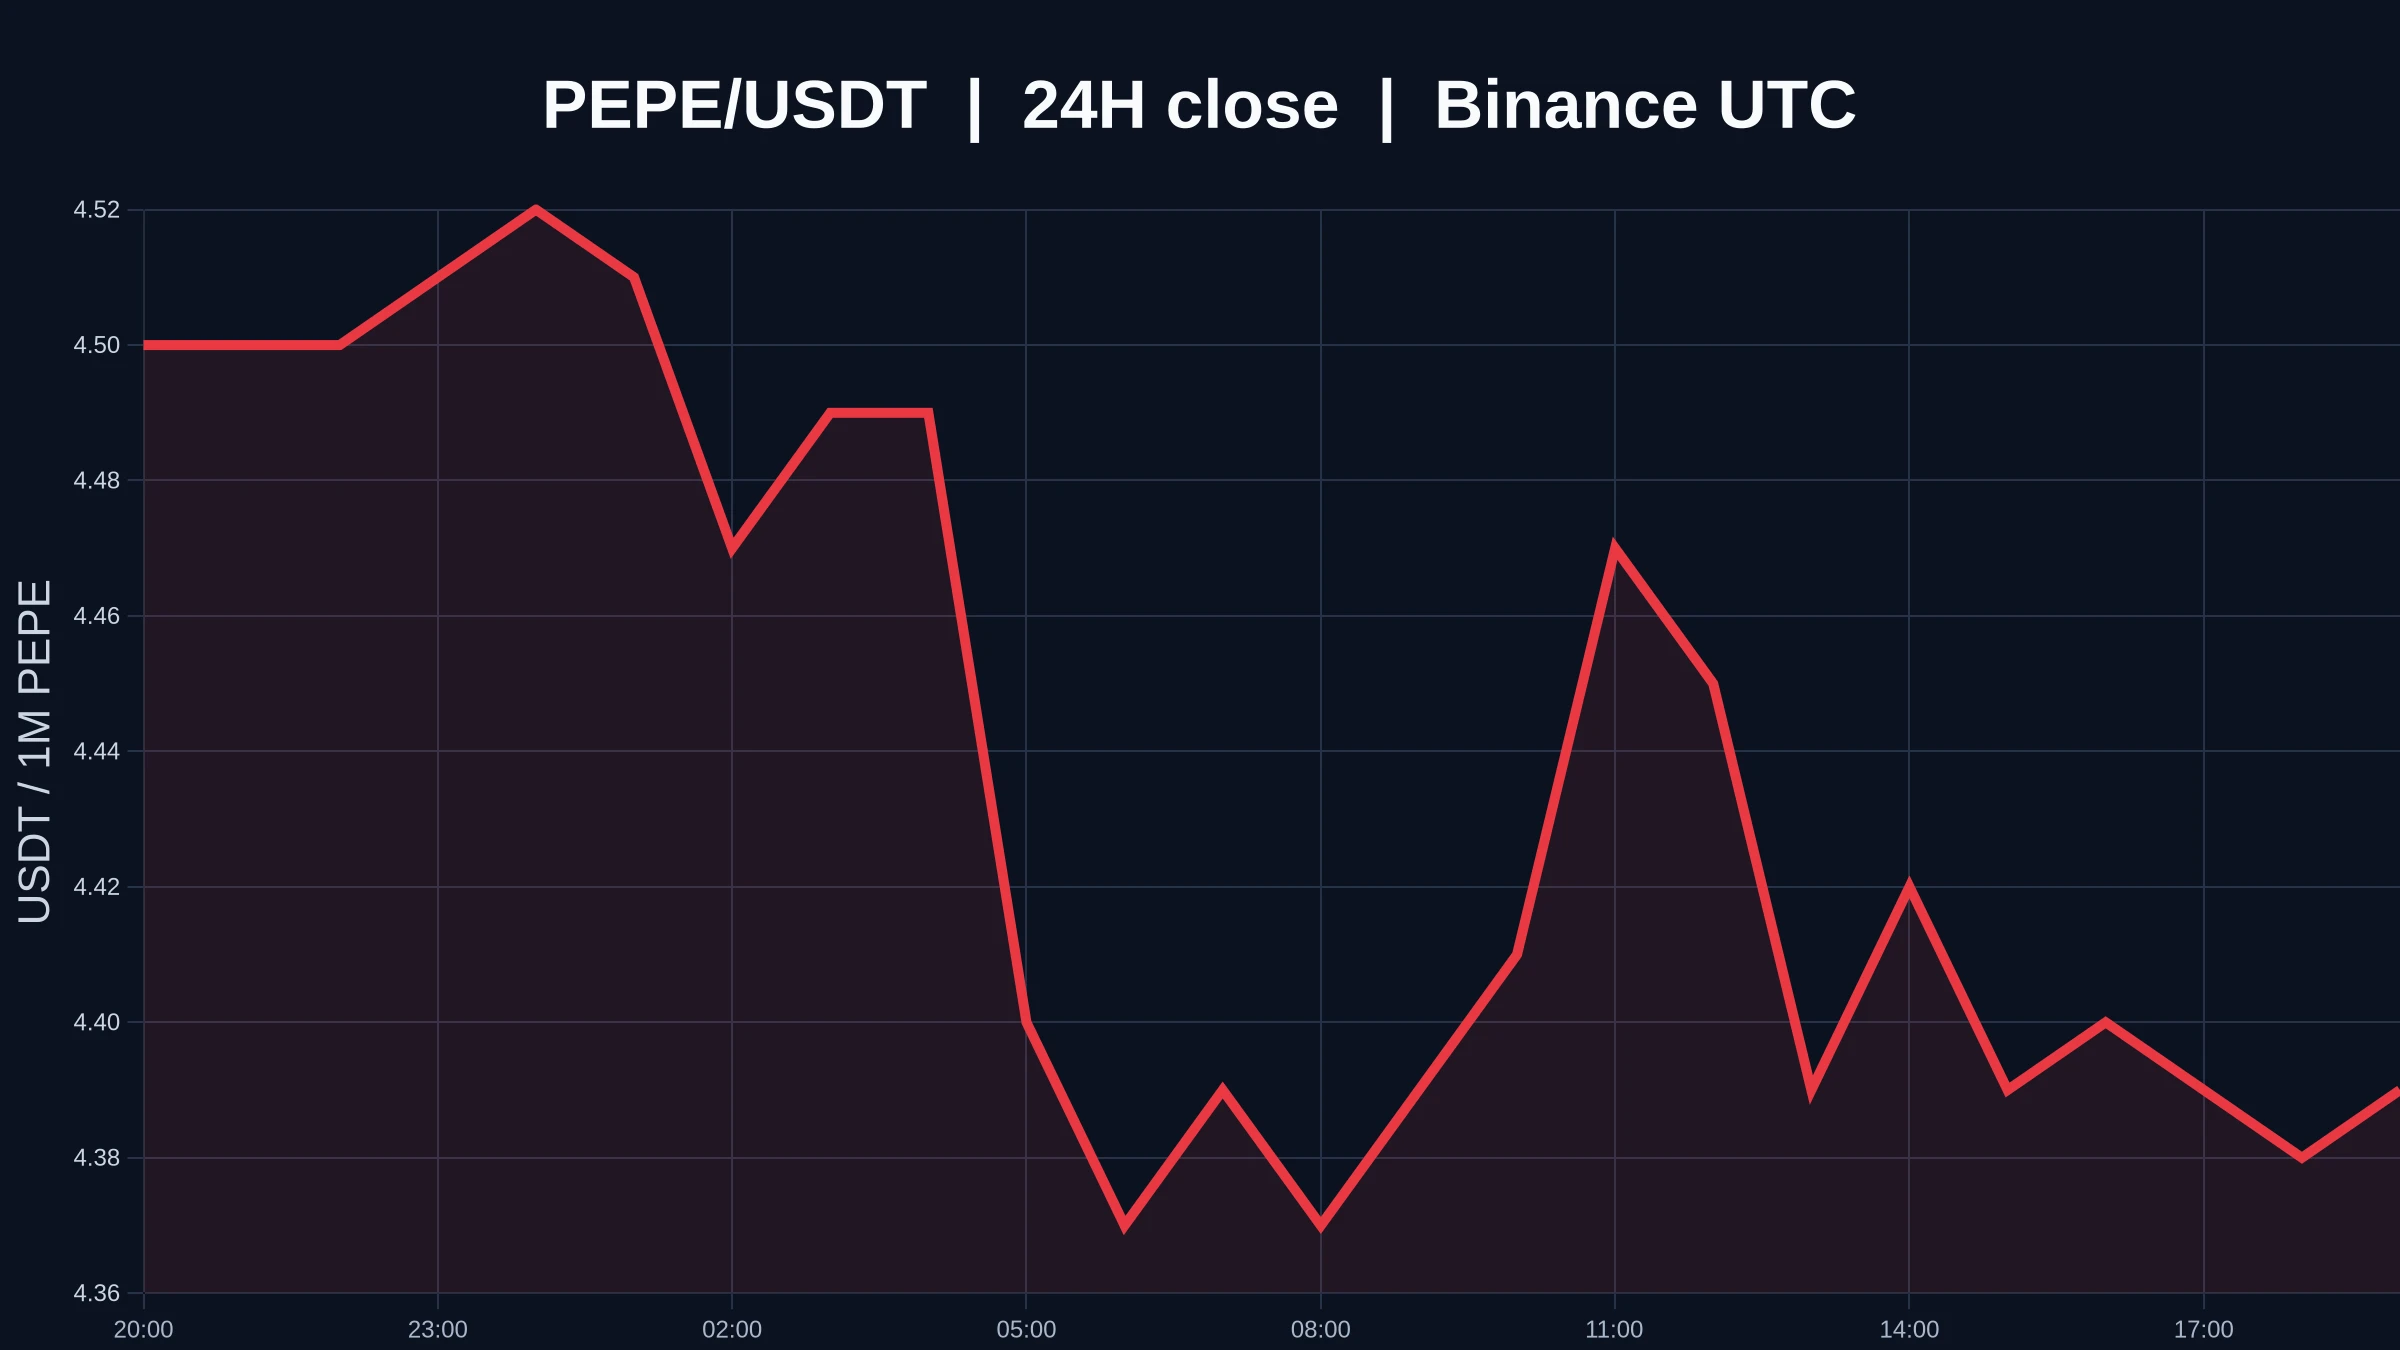
What’s worth watching this time for $PEPE isn’t a simple “up” or “down” call, but which of the two nearby boundaries is decisively dealt with first after the price reaches 0.0000044. Rather than picking a side between bulls and bears, first check that oversold does not mean bottom. RSI entering low territory only means selling pressure has been released in a concentrated burst, and the price may rebound; only stopping its slide to new lows and reclaiming key levels would provide further evidence that it has stabilized.
The price is currently searching for answers between 0.00000433 and 0.00000
post-image
PEPE-2.52%
10.26 BTC Public Trading Outlook
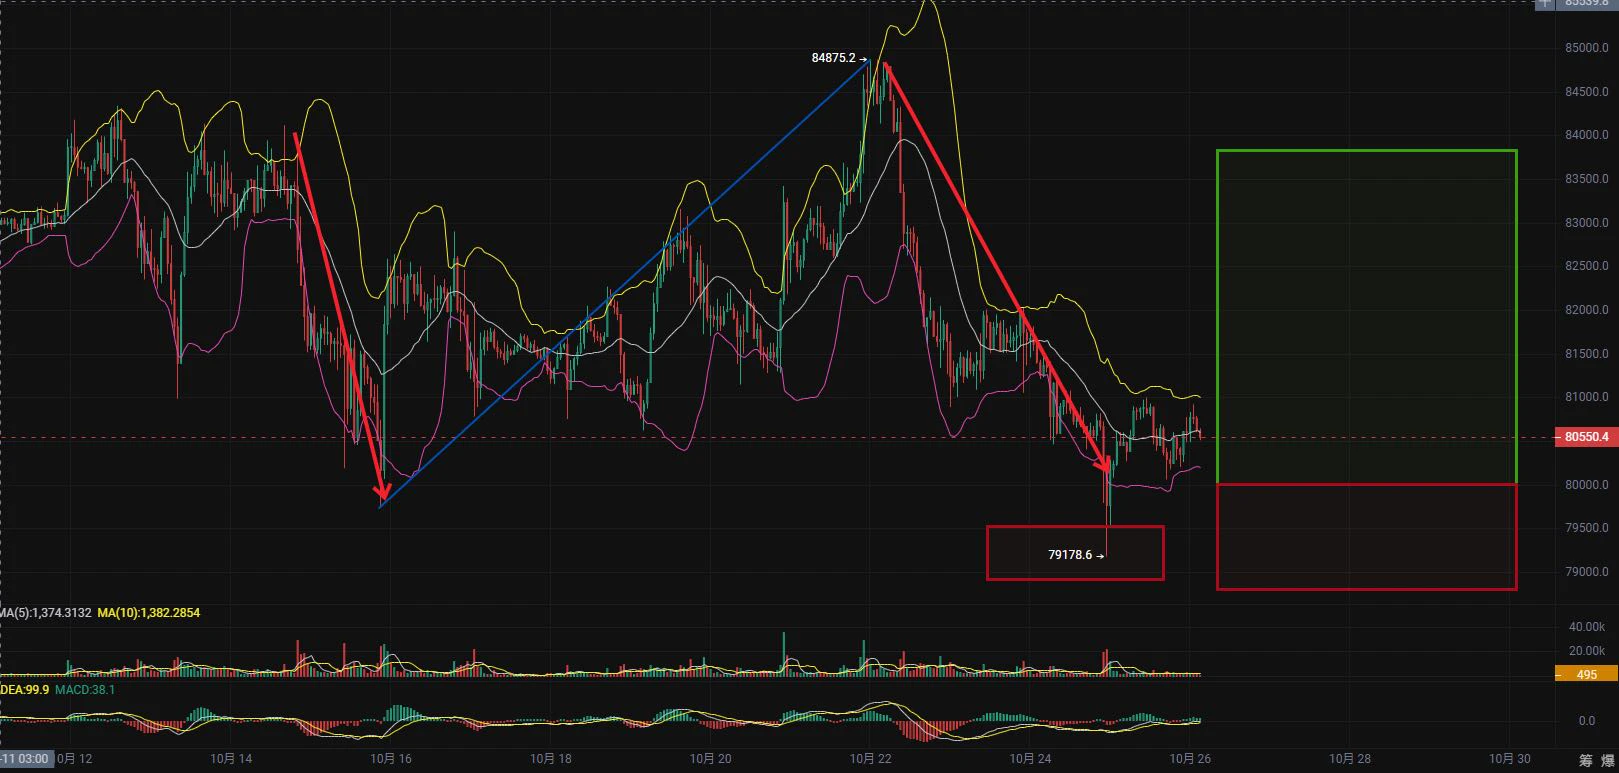
Long Trade Setup$BTC
  Entry range: 795-802
  Stop-loss: around 788 (depending on the entry price and position size)
Take-profit targets
  First target: around 810 (middle Bollinger Band support turns into resistance)
  Second target: around 820 (upper Bollinger Band resistance)
Third target: 828 (in view if the second target is broken)
Fourth target: 838 (in view if an evening trend develops)
Trading factors: Brent crude oil remains at elevated levels, pushing up inflation expectations. This, in turn, will constrain the Fed’s room to e
post-image
BTC+0.12%
ETH+0.53%
ZEC+3.41%
🚨 Do you understand what happened this week..
> Friday: Brent hit $116.72, a 6 month high, on fears of a new US-Iran strike.. the Dow dropped 652 points to 52,215.. the S&P and Nasdaq both logged a 2nd straight weekly loss..
> the 10 year Treasury yield sits at 4.99%.. one tick from 5%.. the Fed decides Wednesday and futures price about a 90% chance of a hold..
> Saturday: Bitcoin slipped under $80,000 for the first time since Oct 15, low of $79,107.. over $400M of longs got wiped in 4 hours.. spot ETFs bled $773M in 2 days.. the average ETF and treasury company holder is sitting near breakev
SPX+2.63%
BTC+0.09%
AXP-3.70%
CRWD+8.19%
NET+7.35%
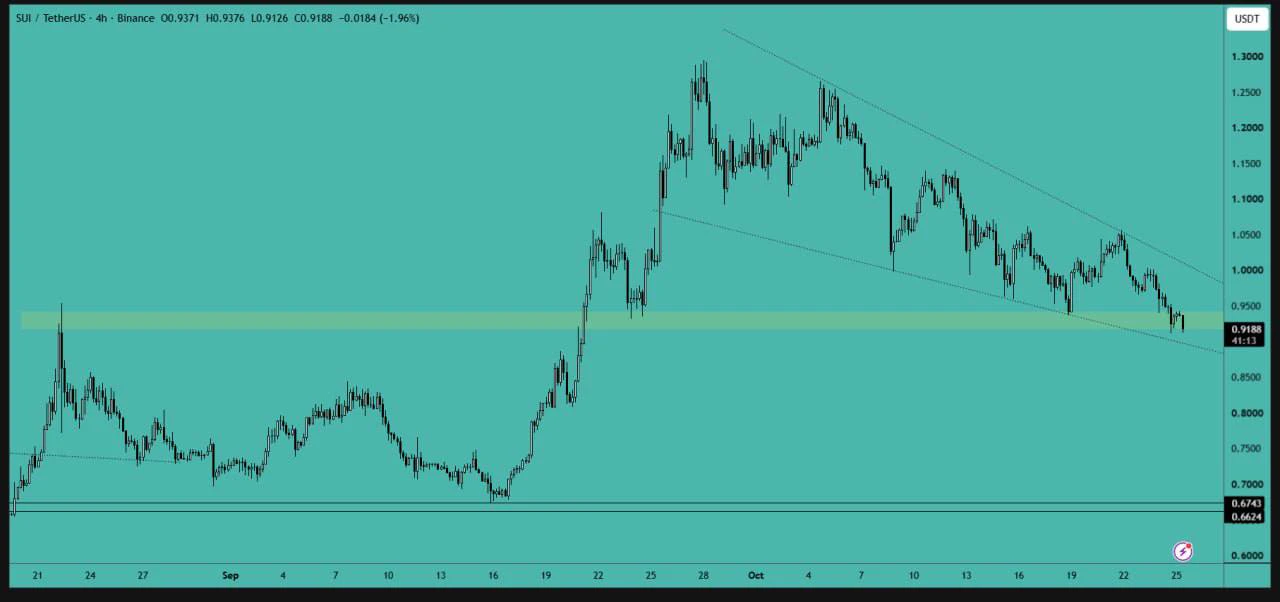
SUI analysis:
The price is currently testing a major support area, which may lead to a bounce. Additionally, there is a falling wedge pattern; a breakout from this pattern could result in a significant upward rally. Consider opening long positions, but be sure to use a tight stop-loss.
$SUI ‌#GateSquareNewCreatorProgram #ShareWeekly
post-image
SUI-0.74%
BE READY FOR THIS 🙈
$BTC
post-image
BTC+0.09%
Floki all time high hype ath go
post-image
FLOKI-0.90%
HYPE+1.74%
$ETH Today's analysis, for reference only
After the daily chart's rebound failed between 2440-2548, price broke below the previous ascending channel. The technical structure remains bearish, with the current key area between 2323-2365.
If this area holds, a corrective rebound is likely, but a trend reversal would still require price to reclaim the 2440-2520 range. Following the technical breakdown, liquidation risk in the key zone is near 2180. Institutions are currently entering positions around 2280-2315. For now, the main focus is on the daily chart reclaiming the 2323-2365 area! Remember n
post-image
ETH+0.53%
BTC+0.12%
  • 1
Will this ever happen again?
Be honest
post-image
Load More

Join 40 M users in our growing community

⚡️ Join 40 M users in the crypto craze discussion

💬 Engage with your favorite top creators

👍 See what interests you

Trending Topics

USEarningsSeason

102.33k Views3.53k Discussing

The U.S. Q3 earnings season is in full swing, with major tech companies including Tesla and Meta reporting results. Market focus is shifting beyond revenue and profit toward AI spending, capital expenditure, margins and forward guidance. Which company’s earnings are you watching most closely?

GateWCTCS9GlobalTradingCompetition

729.68k Views8.1k Discussing

USConsumerSentimentNearRecordLow

12.61k Views304 Discussing

View More