
Square
Following
Hot
News
Notifications
Profile
Share your thoughts
placeholder
Article
What Is the Funding Rate? Why Can Perpetual Contracts Continue to Incur Holding Costs Even When Prices Barely Move?

In crypto trading, many people focus only on price movements after opening a position and overlook the funding rate. For perpetual contract traders, even if prices move sideways for a long time, holding a position may still generate additional costs or returns as long as the funding rate is nonzero.

First, what is the funding rate?

The funding rate is a mechanism in perpetual contracts for periodic payments between longs and shorts, designed to keep contract prices close to sp
post-image
Subscribe to Anthropic: Earn Stock Trial Funds and Unlock Listing Rewards
The Anthropic (ANT) IPO subscription is now open! Complete a valid subscription through Gate IPO Access and qualify for up to 1,000 USDT worth of ANT Stock Trial Funds, based on your final subscription amount. Eligible subscriptions may qualify even if no shares are allocated.

More benefits are available beyond the subscription:
Listing Trading Rewards: ANT is scheduled to begin trading on November 19. Join the designated trading campaign for a chance to win, with 100% winning odds under the campaign rules.

VIP Airdrop
Gate_Square
Subscribe to Anthropic: Earn Stock Trial Funds and Unlock Listing Rewards
The Anthropic (ANT) IPO subscription is now open! Complete a valid subscription through Gate IPO Access and qualify for up to 1,000 USDT worth of ANT Stock Trial Funds, based on your final subscription amount. Eligible subscriptions may qualify even if no shares are allocated.
More benefits are available beyond the subscription:
Listing Trading Rewards: ANT is scheduled to begin trading on November 19. Join the designated trading campaign for a chance to win, with 100% winning odds under the campaign rules.
VIP Airdrop: Eligible users who meet the registration, subscription, net deposit, and VIP-level requirements can share an airdrop of ANT stock worth a total of 100,000 USDT.
Simple Earn Offers: Eligible new users can access a designated USDT fixed-term product with APR of up to 200%. IPO subscribers can also check the designated 14-day product offer.
The subscription period ends on November 17 at 18:00 (UTC+8). Trial Fund slots are limited by tier—review the rules and participate in time.
👉 View the Anthropic IPO campaign: https://www.gate.com/campaigns/7003
Trial Funds, airdrops, and Simple Earn offers are subject to eligibility requirements, availability, and the applicable campaign and product terms. IPO subscriptions involve allocation, fund-lockup, and market risks. APR does not guarantee future returns. This content is not investment advice.

repost-content-media
Trenches
mihao
m
bade
b
mihao
4Cxj...pump
Market Cap
$.
Change
.
24h Vol
$.
Holders
.
AGT
A
bade
b
AGT
0x5d...e274
Market Cap
$.
Change
.
24h Vol
$.
Holders
.
FOOD
F
bade
b
FOOD
FTu5...pump
Market Cap
$.
Change
.
24h Vol
$.
Holders
IDOL
I
bade
b
IDOL
0x3b...ab07
Market Cap
$.
Change
.
24h Vol
$.
Holders
.
AI
A
bade
b
AI
2T56...pump
Market Cap
$.
Change
.
24h Vol
$.
Holders
.
What Is the Difference Between Isolated and Cross Margin? Why Can the Same Market Move Affect Accounts Completely Differently?

In crypto futures trading, many people focus on price, leverage, and liquidation prices, but overlook an equally important question: whether they are using isolated margin or cross margin.

These two modes determine how margin is allocated and how an account’s funds may be affected when an individual position incurs a loss.

First, what is isolated margin?

Isolated mode manages the margin allocated to a particular position relatively independently. The margin for tha
post-image
$UAI Sell-off signals are fading, grab a bowl of pho, guys🤩LONG NOW🔥Tp1: 0.042Tp2: 0.046Tp3: 0.055Sl: 0.0347$AKE $DODOX
post-image
DODOX
DODOXDODOX
Pump.Fun
MC:$3.17KHolders:86
6.67%
UAI-7.58%
AKE+6.07%
Why Can the Order Book Look Deep, Yet Liquidity Suddenly Disappear When You Place an Order?

In crypto markets, you may sometimes see a large number of buy orders stacked in the order book and assume there is strong support below. But when prices start falling rapidly, those buy orders can quickly dwindle, and a market that looked stable can suddenly become fragile.

Why does this happen?

First, orders can be canceled at any time.

The order book shows currently visible limit orders, not completed trades. Traders can modify or cancel orders as market conditions change. So large orders only in
post-image
Everyone says institutions are scooping up $HYPE , but the market is up just 1.2% and isn't buying it. I'm bearish.

There’s been talk this morning that Hyperliquid turned things around in Q3 thanks to yield on its USDC reserves, with institutions scooping up $HYPE. Is the market buying it? No—I’m bearish.

$HYPE is now at 72.37, up just +1.2% over 24h, with a volume ratio of only 0.987—I don't trust a low-volume rebound.

First, the trend is ugly—7d -7.78%, 30d -10.45%, daily RSI at 36.2, and the MACD has been in a death cross below the zero line for 6 days;

Second, the big guy is already do
HYPE+0.24%
$0G is building bullish momentum, gradually recovering toward the $0.160 resistance level! A confirmed breakout could open the door to further gains. Entry: $0.1570 – $0.1590 Target: $0.1610 / $0.1640 / $0.1670 Stop-loss: $0.1540
post-image
0G-3.73%
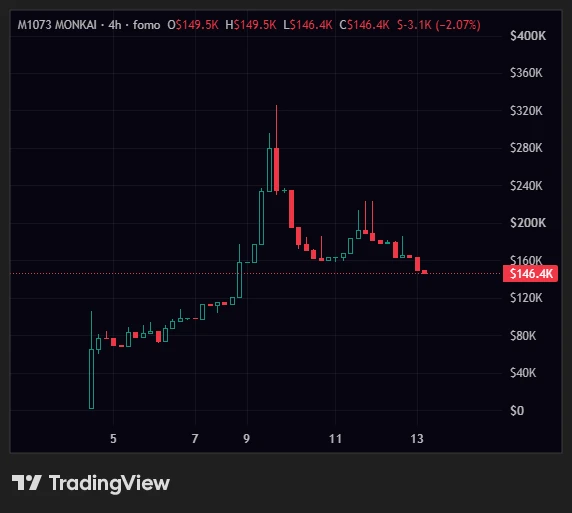
$MONKAI holding up pretty well considering how rough the market has been lately
Honestly I think this is the last entry before it starts making some serious moves
Don't sleep on this one 👀
post-image
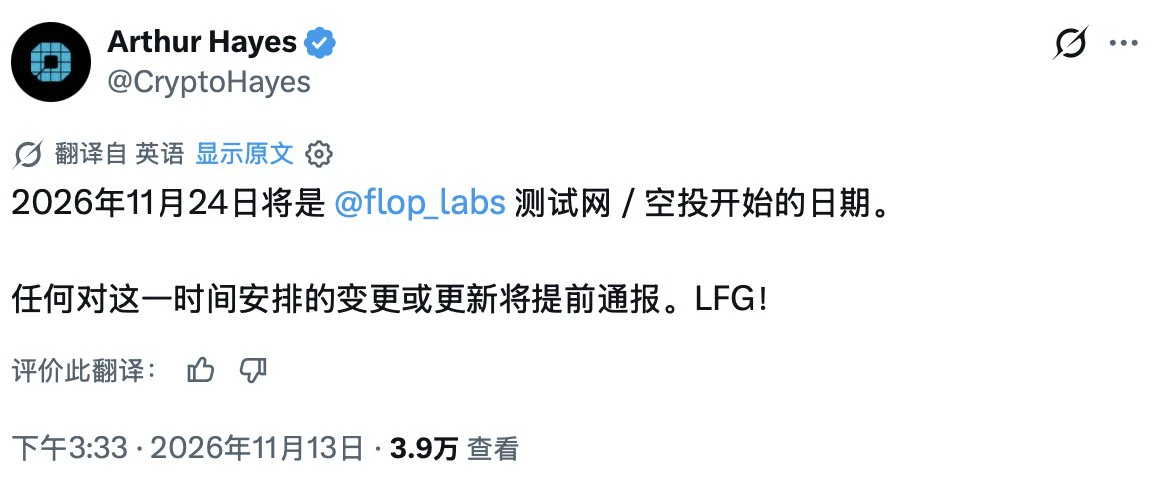
The previously mentioned @flop_labs
is the first project after @CryptoHayes’s comeback
Hayes and the official account both posted today
The testnet is about to launch, with an airdrop; it starts on November 24
The testnet will last about 90 days
Mainnet in Q1 2027
This one’s worth going for
post-image
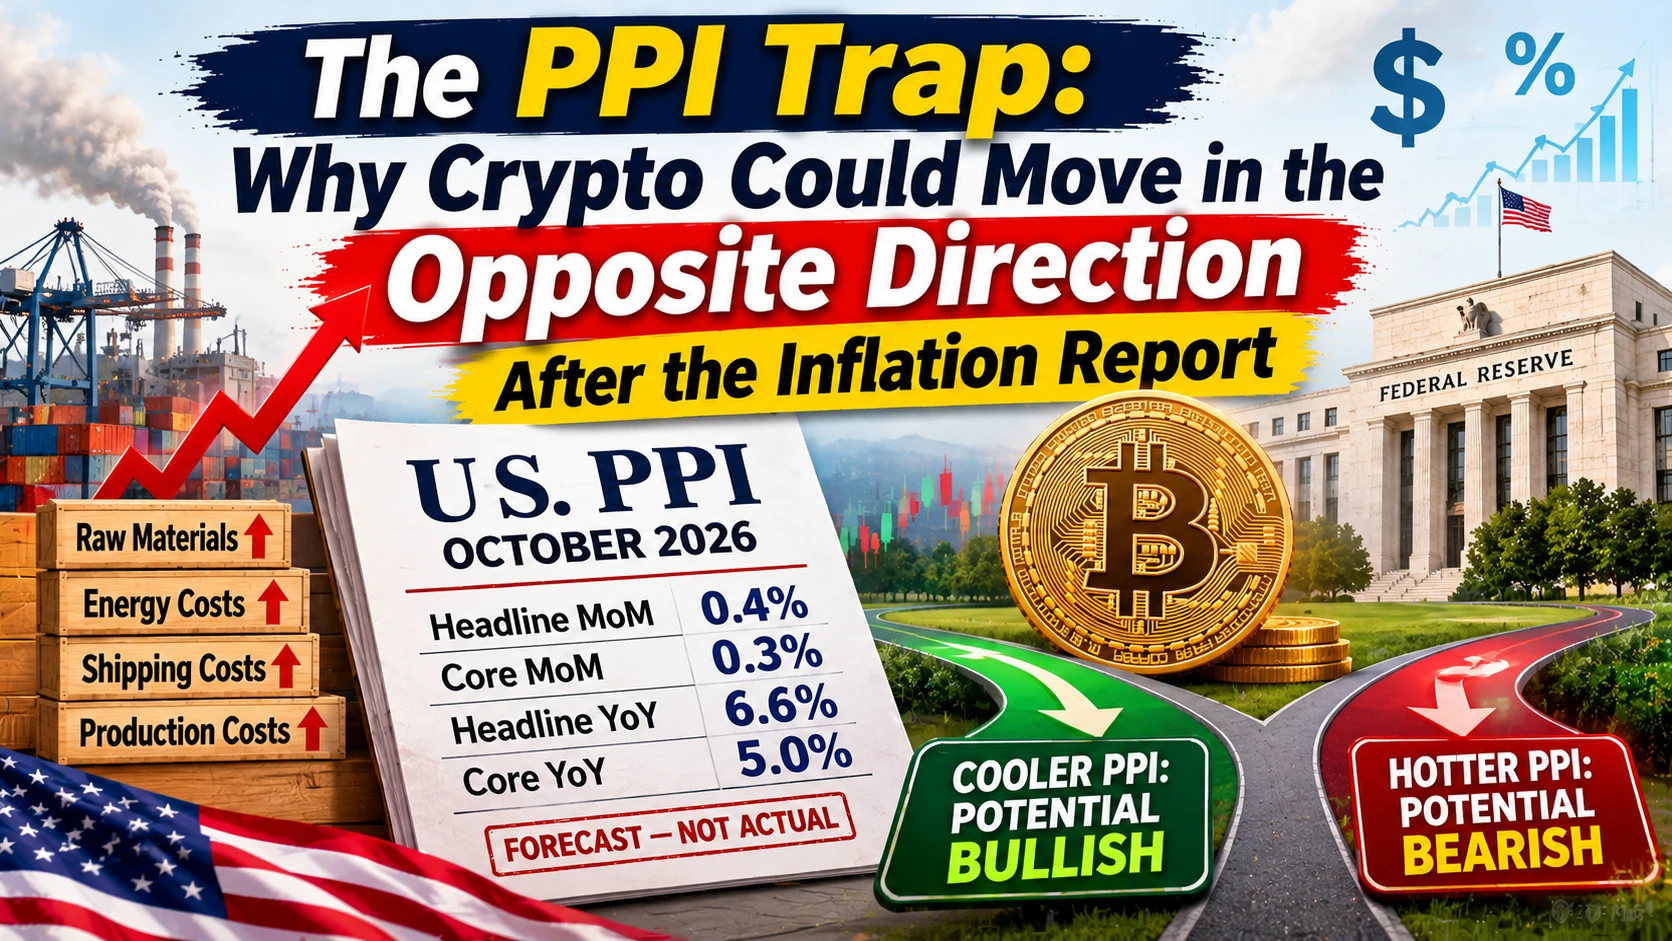
The PPI Trap: Why Crypto Could Move in the Opposite Direction After the Inflation Report

Crypto markets do not always react to economic data in the way traders expect. Sometimes a number looks positive on the surface, but Bitcoin still falls. Other times, inflation remains high, yet the market starts recovering. That is why the October U.S. Producer Price Index deserves more attention than just checking whether the headline number is green or red.

The October PPI report is scheduled for November 13, and the market is looking for a 0.4% monthly increase in headline producer prices. Core PPI,
post-image
BTC-0.65%
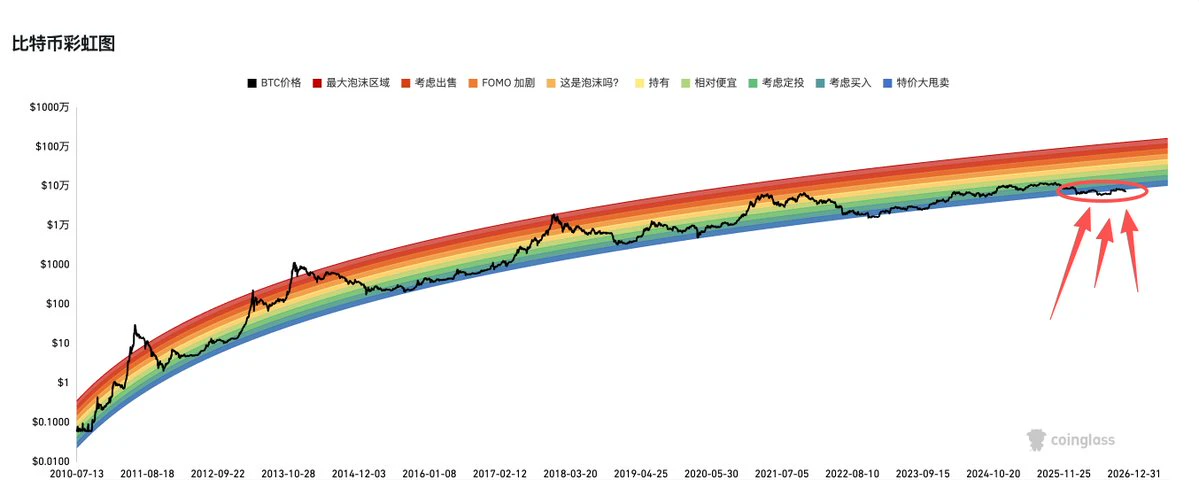
The Rainbow Chart has already broken below its structure and reached the super-discount fire-sale bottom. After this, surely BTC reaching 100,000–200k next year should be no problem, right?
This is also the biggest breakdown in the Rainbow Chart’s history. Previous pullbacks were never this deep, but now it has stayed below the breakdown level for so long; things may not improve in the short term.
We’ll just have to see where BTC hits the brakes and starts a recovery rally. I’ve really lost everything this time and have no money for the New Year. I hope altcoins pick up and get all the ones I’
post-image
BTC-0.67%
  • 1
What Is the Difference Between Mark Price, Last Traded Price, and Index Price? Why Do They Affect Contract Trading?

In crypto contract trading, some people see that the last traded price has not yet reached their expected level, but their account is already showing a large unrealized loss or even nearing liquidation. Others find that the price on the candlestick chart does not exactly match the price the platform uses to calculate risk.

One important reason is that the last traded price, index price, and mark price are not the same thing.

First, the last traded price: the price of the marke
post-image
BTC falls below $71k, hitting its lowest level since September! The $70k level is under threat—where
live-cover
LIVE4,390
#ShowMyPositionReturns

What is this account for?

Let me make this clear upfront to avoid any misunderstandings.

I don’t predict the market or call trades. This account does just one thing: mirror the trades of a public signal account with ultra-low latency.

1:1 mirroring of Uncle Sam’s positions

I post trade cards every day and latency data once a week. Losses included.

Contract trading carries extremely high risk. Past performance is not indicative of future returns. #BTC #ETH
BTC-0.65%
ETH-1.23%
This eagle is taking in heartbroken fans liquidated by Maple Leaf eth and Big Beard
post-image
ETH-1.23%
Crypto market update
live-cover
LIVE2,110
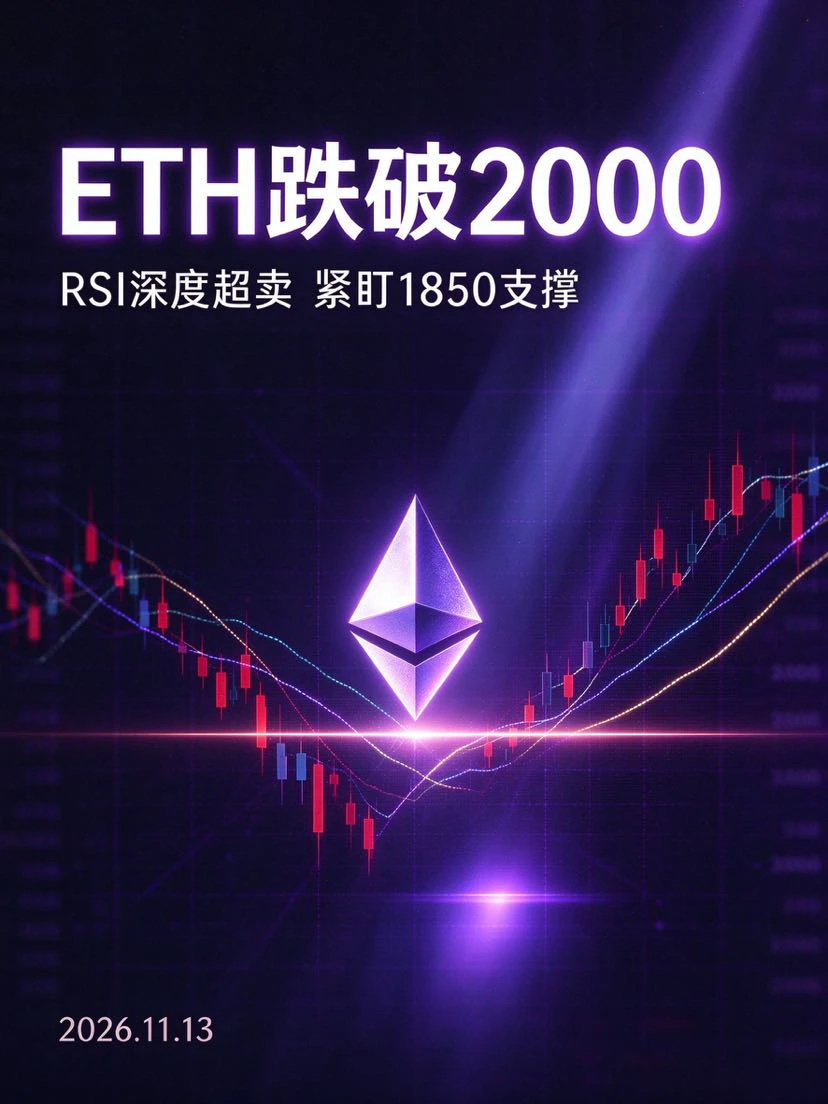
#黄仁勋辞职 ETH Price Analysis for Today (November 13)
Accelerating sell-off—breaks below $2,000—deeply oversold

Cause Analysis
Jensen Huang's resignation has hit tech stocks and the AI computing sector. Risk appetite has declined across markets, prompting funds to exit high-volatility assets in tandem; ETH ETFs have seen continued outflows, with cumulative net redemptions since November nearing $700 million, compounded by selling from whales and wallets linked to the Ethereum Foundation, pointing to weak institutional demand; the break below $2,000 triggered concentrated liquidations of leveraged
post-image
ETH-1.26%
  • 1
  • 1
What Is the Risk-Reward Ratio? Why Can a Trade Have Long-Term Value Even With a Low Win Rate, as Long as Risk Is Managed Properly?

In cryptocurrency trading, many people focus too much on the win rate, believing that they need to make frequent correct calls to make money. But what truly affects long-term trading results is not just the win rate, but also the amount gained or lost on each trade. The risk-reward ratio is an important tool that helps traders assess whether a trade is worth taking.

First, what is the risk-reward ratio?

The risk-reward ratio typically compares a trade’s potentia
post-image
What does it mean when prices rise, trading volume increases, and OI rises at the same time?

In the crypto futures market, traders often pay attention to a particular combination: prices rise, trading volume increases, and open interest (OI) also rises.

Some consider this a sign of a strong rally, while others worry that the market is accumulating too much leverage. So how should this be interpreted?

The key is that these metrics can provide information about market participation, but they cannot, on their own, prove that prices will continue to rise.

First, what does a price increase indi
post-image
$ERA Down 20% in a day—is 0.0777 a rock-solid bottom? It’s like a fire sale at the market before closing: it looks cheap, but it could be even cheaper tomorrow. The current price is 0.0788, with 24-hour trading volume of $99.4 million. The intense turnover shows bulls and bears are battling it out around 0.078. Technically, it has plunged nearly 23% from 0.1009 to 0.0777. It’s oversold in the short term, but there are no signs of stabilization. If on-chain volume keeps surging on the way down, panic selling isn’t over yet. My approach: don’t catch a falling knife. Wait for volume to contract a
ERA+24.21%
  • 2
Load More

Join 40 M users in our growing community

⚡️ Join 40 M users in the crypto craze discussion

💬 Engage with your favorite top creators

👍 See what interests you

Trending Topics

JensenHuangResigns

514.6K Views8.1K Discussing

Jensen Huang has resigned as NVIDIA CEO and stepped down from the board. CFO Colette Kress will serve as interim CEO while NVIDIA considers internal and external successors. $NVDA fell more than 10% in premarket trading following the announcement. With one of AI’s most influential leaders stepping aside, markets are now reassessing NVIDIA’s leadership stability, AI strategy, and long-term valuation.

GateIPOAccessAnthropic

279.6K Views2.6K Discussing

Dr.HanOxfordUnionSpeech

144.5K Views450 Discussing

View More