Square
Following
Hot
News
Notifications
Profile
Share your thoughts
placeholder
Article
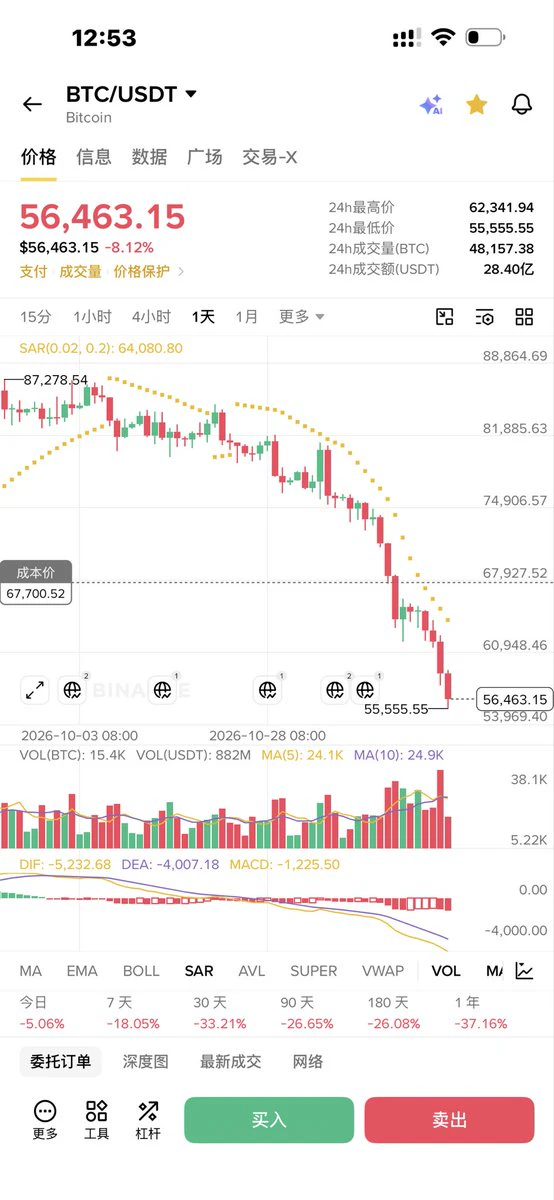
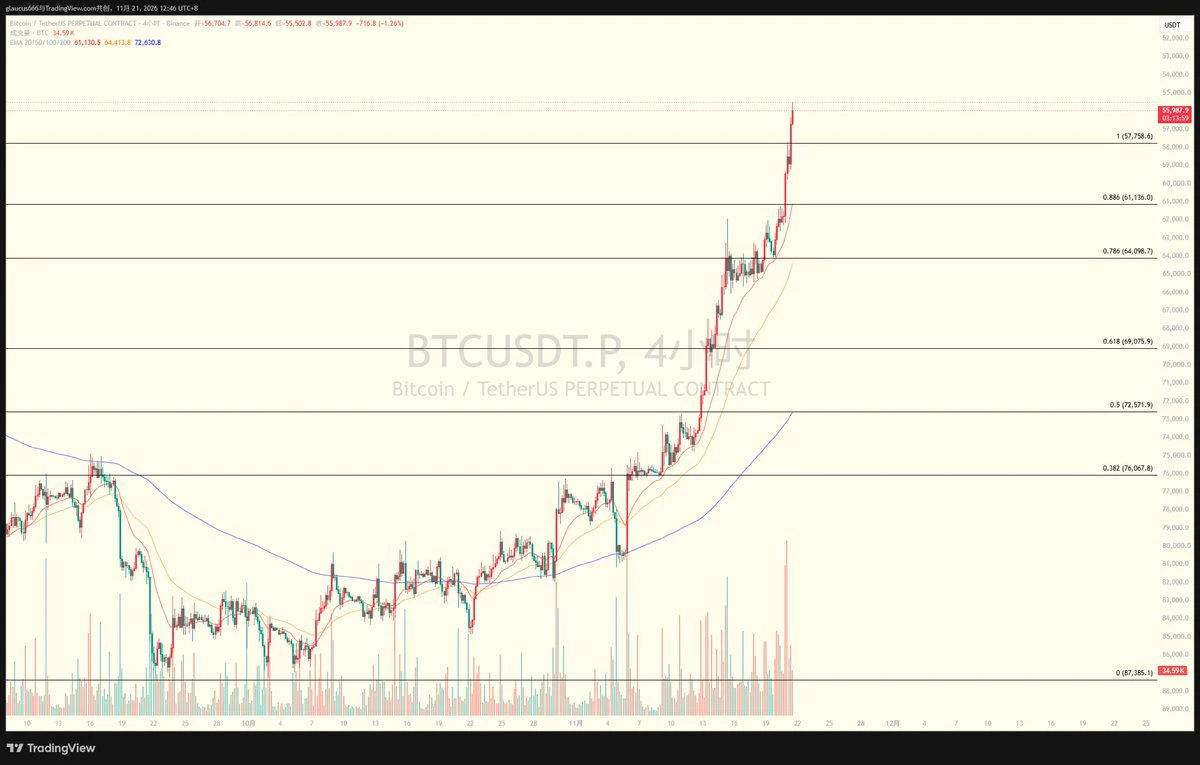
Fuck TMD, in October I watched BTC, and it never came down to 48000. In November, I started buying the dip in batches around 70000, and then it started dropping to 48000. My brain—I could have 100 of me and still not outplay the damn market makers. Luckily, this TND run was mostly spot dip buying; otherwise, no amount of money would have been enough to avoid getting liquidated. Fuck you. $BTC
post-image
BTC-0.67%
market prices updates
live-cover
LIVE1,055
XAUUSD-2.40%
NVDA-0.35%
ETH-1.23%
BTC-0.65%
XAU+0.38%
Trenches
FIONA
F
bade
b
FIONA
B34n...pump
Market Cap
$.
Change
.
24h Vol
$.
Holders
.
PIEVERSE
P
bade
b
PIEVERSE
0x0e...25a9
Market Cap
$.
Change
.
24h Vol
$.
Holders
.
mihao
m
bade
b
mihao
4Cxj...pump
Market Cap
$.
Change
.
24h Vol
$.
Holders
.
PROS
P
bade
b
PROS
0x8b...9832
Market Cap
$.
Change
.
24h Vol
$.
Holders
.
CLAUDIA
C
bade
b
CLAUDIA
2j5S...W2ZM
Market Cap
$.
Change
.
24h Vol
$.
Holders
.
Other markets aren't faring well either—
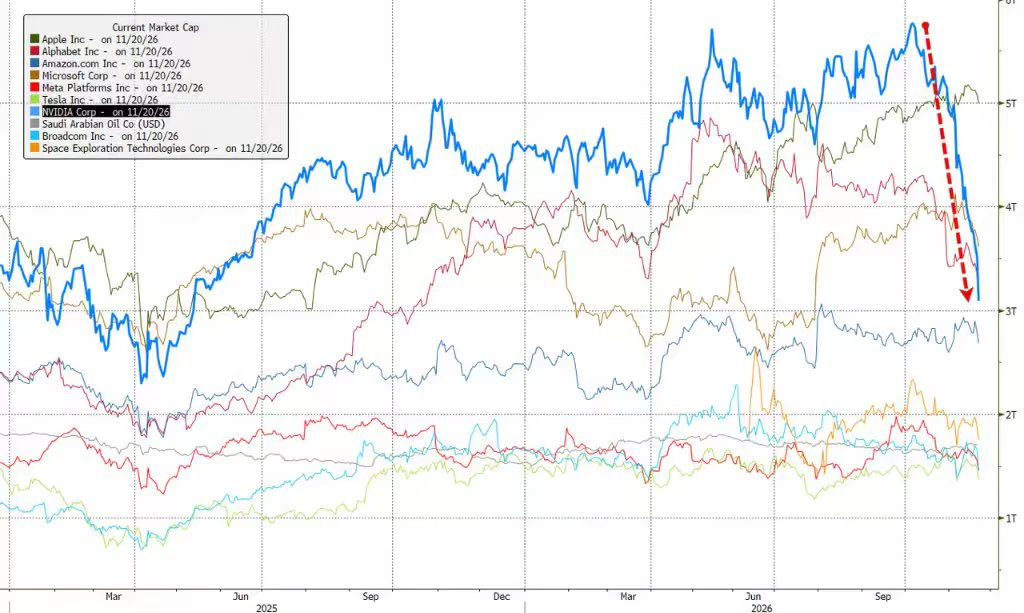
Chip stocks suffered their worst weekly selloff since 2001, wiping out about $2.3 trillion in market value.
That’s two crypto markets’ worth of market cap!
The liquidity black hole created by Anthropic’s record-breaking IPO is truly terrifying!
post-image
ANT-8.68%
A letter: I hadn’t written a word in 45 days. Three words got me liquidated.$BTC ‌
BTC-0.65%
  • 1
Guys, open shorts on $BLESS & $ENSO immediately, huge profits are coming. Set your short take-profit prices: ENSO - 0.25 BLESS - 0.0075
post-image
BLESS-2.00%
ENSO-3.03%
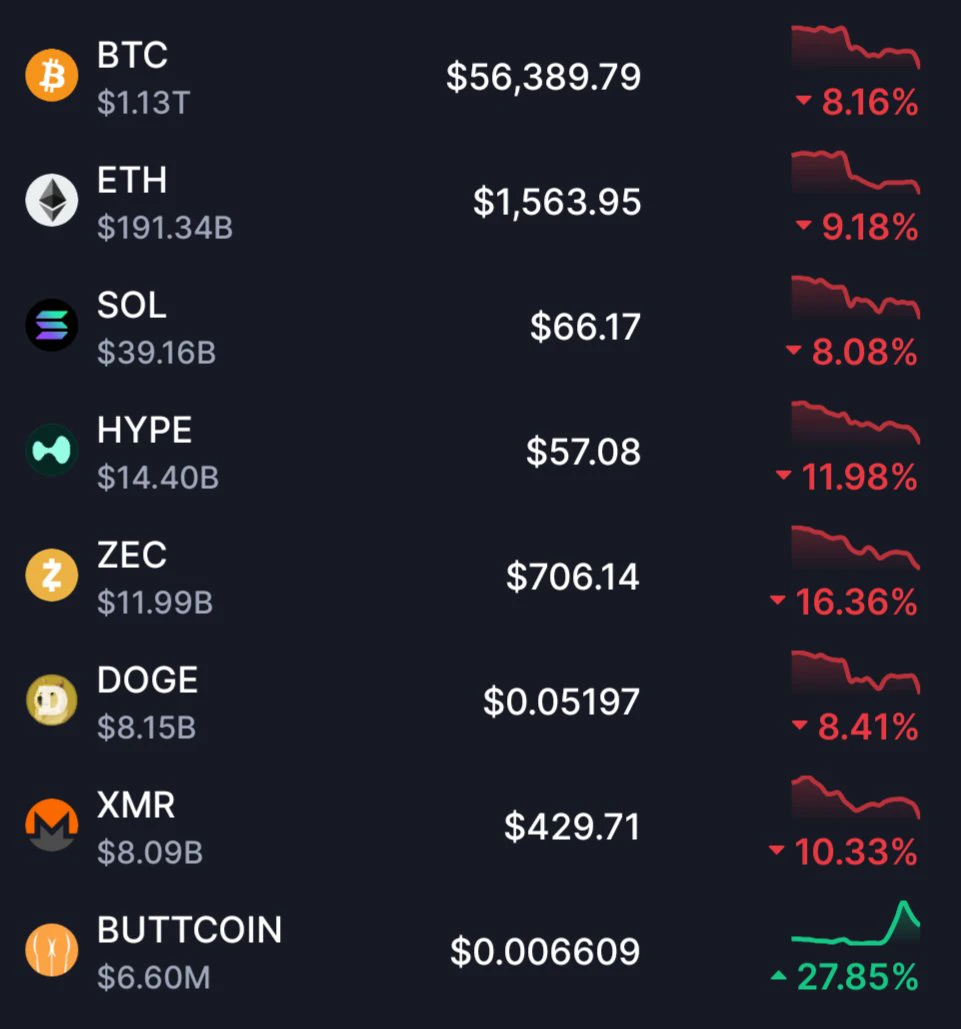
$ZEC is clearly oversold in the bottom region, and the drop has been a bit suffocating. I’m inclined to take a shot at a short-term rebound.
Short-term long trade idea $ZEC :
Entry range: 694.54 — 710.16 First target: 741.77 Second target: 773.31 Stop level: 666.76
One thing to keep in mind: bearish momentum on the 1-hour timeframe is still very strong, and the rebound could be slapped back down at any moment—or even trigger a new low. Don’t get carried away or go all in; size your position according to what your account can bear.
Risk warning: The above is only a personal trading idea and do
post-image
ZEC+1.16%
At first glance: I thought it was a pervert secretly filming
literally just buy $Buttcoin
post-image
55555.55
Is this some kind of sick joke?
This manipulated market
post-image
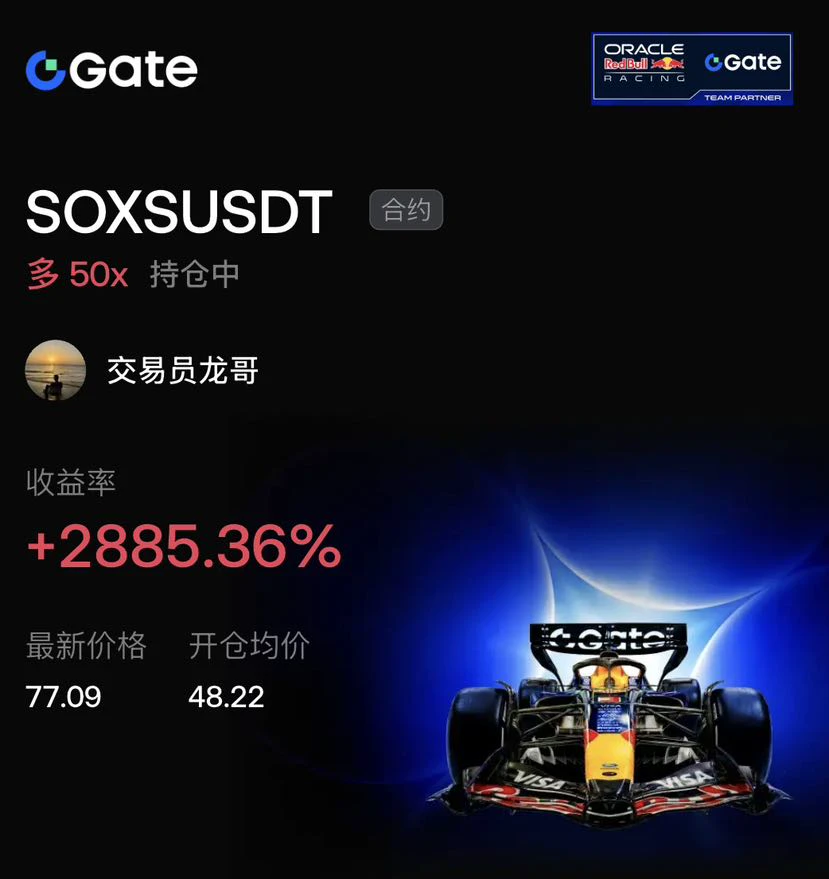
$SOXS This position is up 2885%, but I’ve already started reducing it in batches.

Long from 48.22, current price 77.09. The 50x leverage has generated hefty profits, but pullbacks and wicks at highs can happen extremely fast.

I’ve moved my stop loss up to breakeven. The trend remains bullish, but I’m not trying to squeeze out the last penny. Protecting principal and profits is the core of trading. I’ll keep a small position to bet on new highs and take profit on the rest. Waiting for the next perfect entry signal!$BTC $ETH
#BTC跌破6万美元关口
post-image
SOXS+1.46%
BTC-0.65%
ETH-1.23%
A nuclear bomb is about to explode

In 5 minutes, 385 million in liquidity was wiped out

The number of people liquidated instantly surged by nearly 100,000, bringing the 24-hour total to around 320,000
  • 2
  • 2
$ZRO Short setup... final target: 1.0149 ZRO continues lower after falling from 1.2554. Breaking below 1.1104 and printing a second bearish candle indicate sellers are still applying pressure. Entry price: $1.0779 Target 1: $1.0569 Target 2: $1.0359 Final target: $1.0149 Stop-loss: $1.0989 As long as ZRO stays below 1.1104, the short-term bearish outlook remains intact. A move back above 1.1104 would weaken this trade setup. Will sellers push the price to a new low? $BNB HYPE
post-image
ZRO-2.59%
BNB-0.76%
Yardeni says this is a correction, not the start of a bear market, and he has one reason: investors are panicking, and the sell-off has gone too far. Sounds familiar, right? He says this every time the market drops. It was the same story in 2022, and the Nasdaq fell more than 30% that year. I’m not saying he’s definitely wrong. I’m saying the argument itself isn’t worth much—he has no idea how long the panic can last.

What’s really worth watching is whether recession signals are starting to reinforce one another. Right now, the job market is holding up and consumer spending hasn’t collapsed,
post-image
NAS100-0.07%
  • 3
  • 1
$BTC
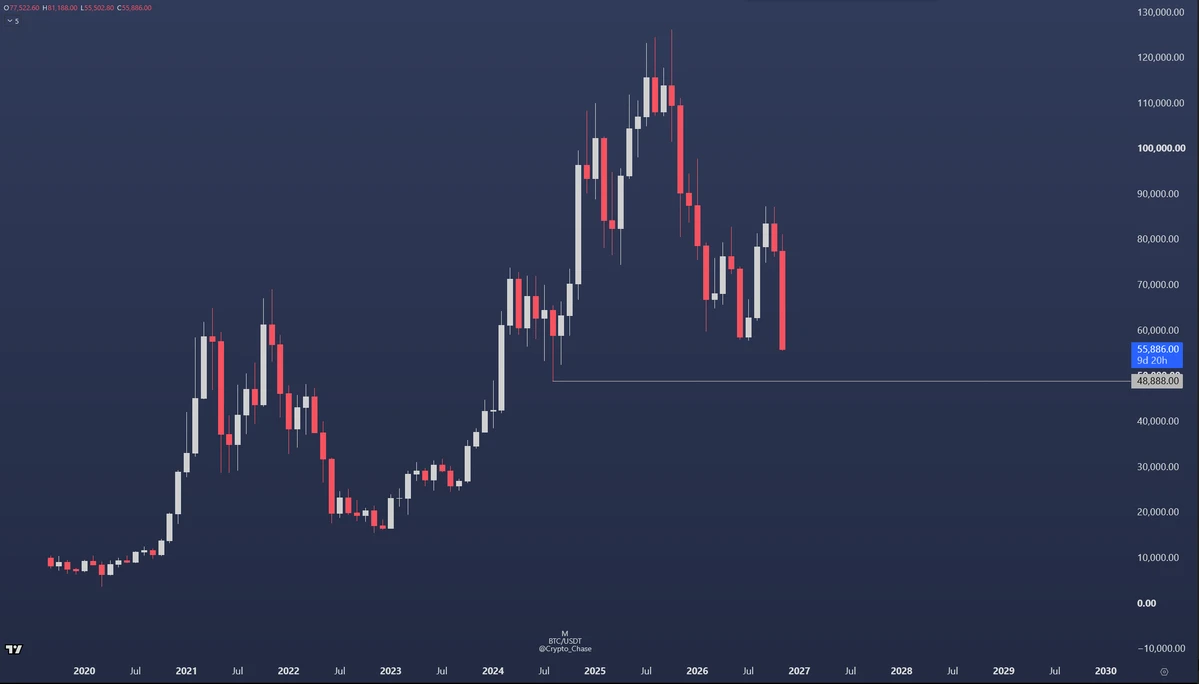
Don't plan on bidding because I truly believe Saylor is a single point of potential failure/collapse (have said this for a longgggg time now), but 48K~ liquidity seems like a logical area for a bounce.
post-image
BTC-0.67%
market prices updates
live-cover
LIVE1,682
XAUUSD-2.40%
XAU+0.38%
ETH-1.23%
NVDA-0.35%
SNDK-0.18%
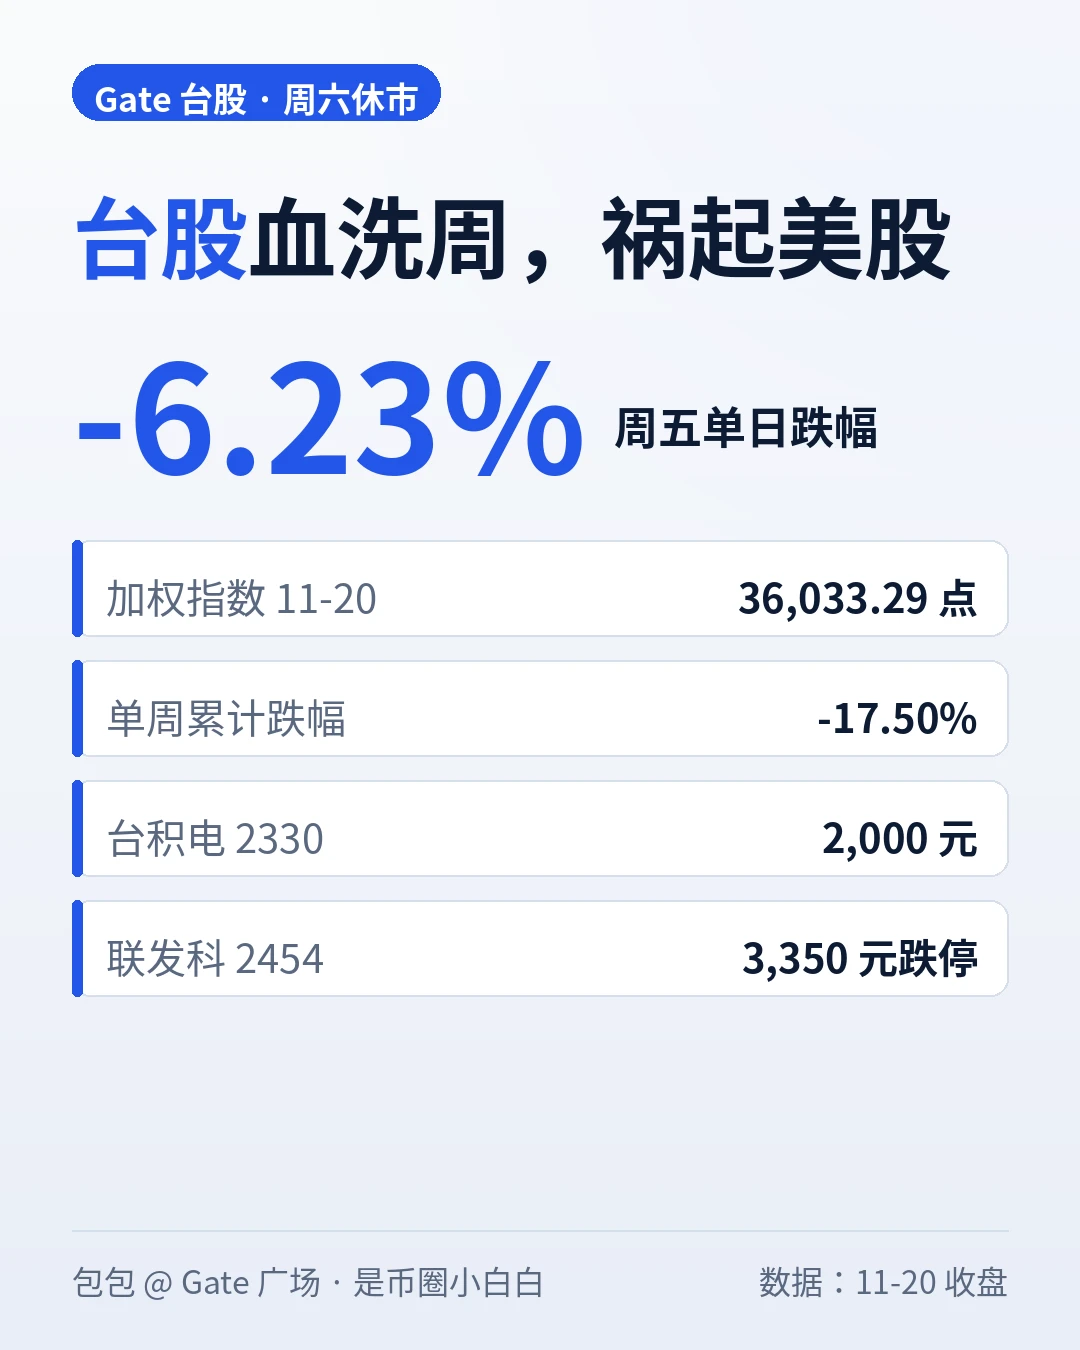
Taiwan stocks fell 2,393 points on Friday and shed 17.5% for the week, with the overnight US stock sell-off as the trigger: Nvidia -14%, the Philadelphia Semiconductor Index -10.7%—Taiwanese and US chip stocks have long been tied to the same rope. #Gate上线台股交易
First, let’s tally Friday’s losses: the TAIEX closed at 36,033.29, down 2,393.6 points (-6.23%), its third-largest closing point drop ever; it hit an intraday low of 35,738.68, with full-day trading volume of NT$877.35 billion. Even worse was the week as a whole—the index fell 7,641.83 points (17.5%) over five days, its worst week since
post-image
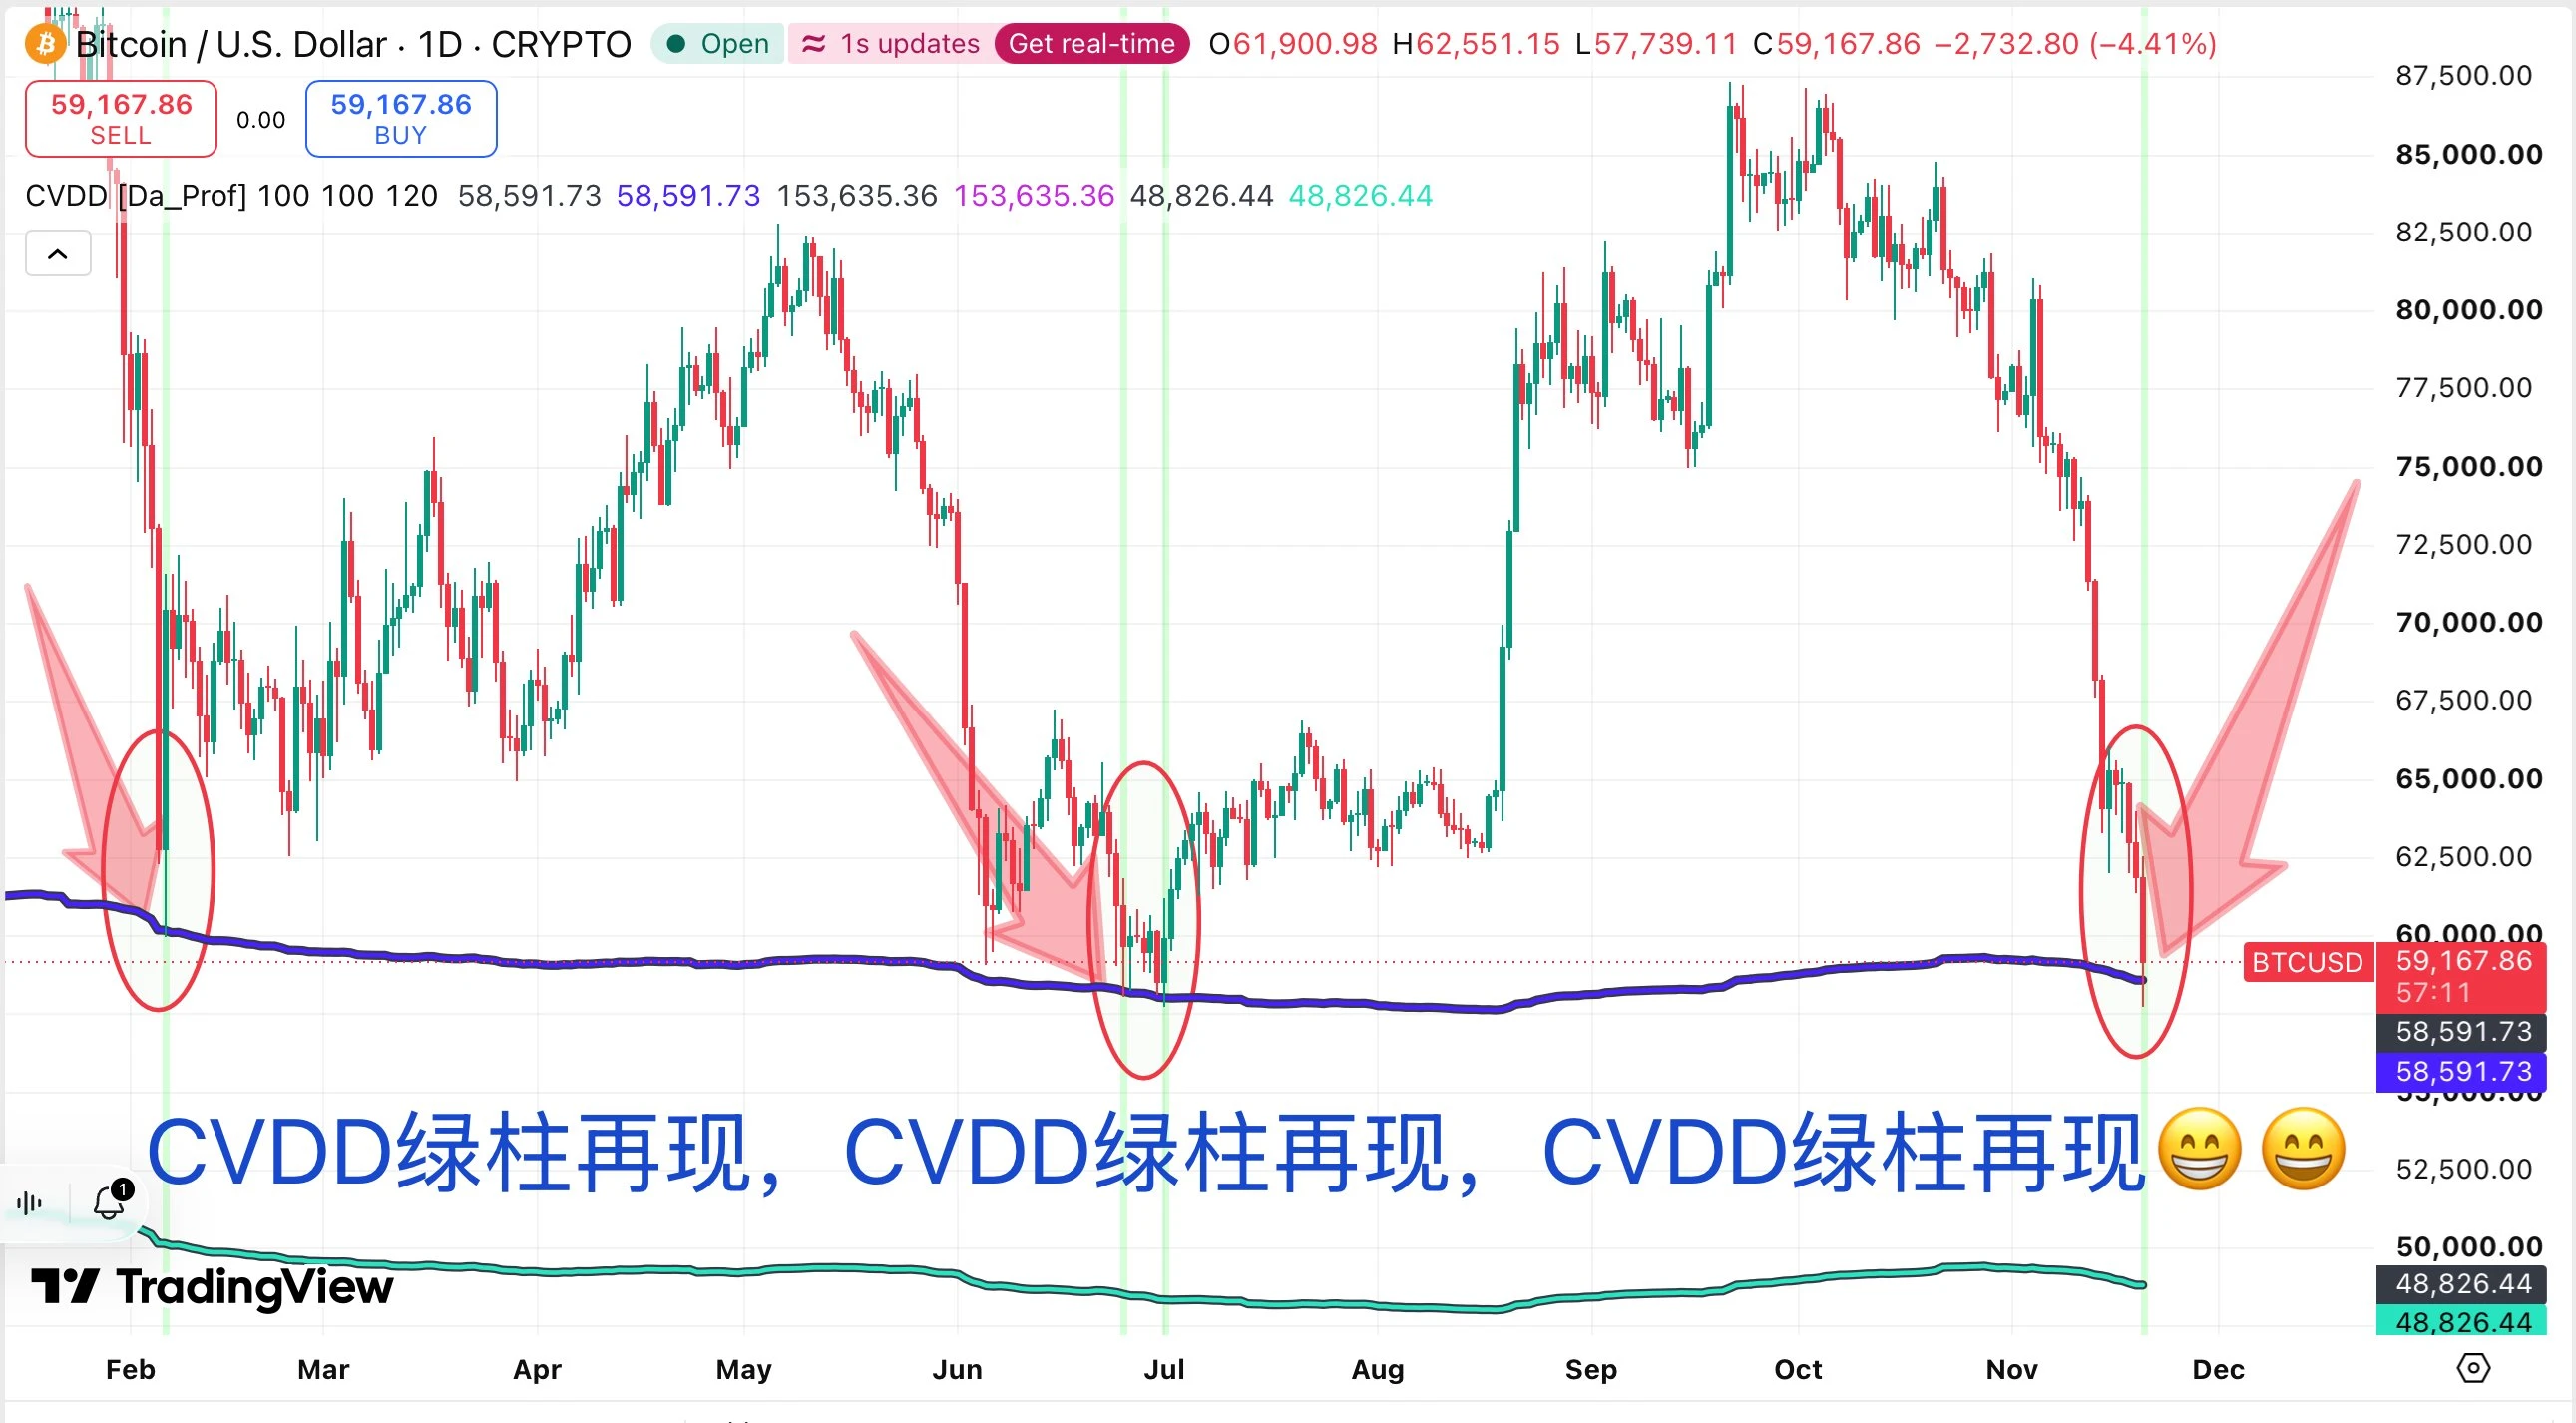
The CVDD indicator on Bitcoin’s daily chart has flashed green bars for the third time!

In February and June this year, BTC fell to near the blue reference line twice, and green bars appeared both times. A decent rebound followed each time. Here we go again!

BTC is currently around $59k, while the blue CVDD line is around $58.6k—they’re almost right on top of each other. Seeing this signal has me pretty tempted! $BTC

But just because it worked the first two times doesn’t mean it’ll work a third time. The most important thing now is to see whether the price can stabilize here and whether buy
post-image
BTC-0.65%
  • 1
  • 2
Fuck, this market is so damn good. Damn, feels like I’m making money every day, hehe.
post-image
I opened my MemeBitcoin Alliance first pack.
PACK-0.89%
A brief analysis of BTC’s short-term trend using Dow Theory, Chan Theory, Elliott Wave Theory, volume-price analysis, order flow, and price action
I. Dow Theory
57,778 Abyss, ultimate acceleration of the Dow bearish trend: From a Dow Theory perspective, 57,778 on November 20 was the ultimate capitulation abyss—both the 62,017 and 61,381 lines of defense were breached at once.

High sequence: 81,879→81,076→80,838→74,703→74,115→71,386→68,377→65,604→64,928→64,080→64,017 (Nov 19)→62,639 (Nov 20)—twelve successive lower highs, with bears in perfect control

Low sequence: 76,149→75,607→75,080→74,791
BTC-0.67%
  • 1
Load More

Join 40 M users in our growing community

⚡️ Join 40 M users in the crypto craze discussion

💬 Engage with your favorite top creators

👍 See what interests you

Trending Topics

BTCBreaksBelow60K

2.1M Views28.9K Discussing

BTC fell below $60,000 on November 20 for the first time since July, alongside a tech stock selloff and broader pressure on risk assets. Will $60K become resistance, or can BTC quickly reclaim it? What price or volume signals would convince you that selling pressure is easing?

GateDirectIPOPhase3ANTAllocates92100Shares

727K Views4.8K Discussing

NvidiaDropsNearly14Percent

305.4K Views7.5K Discussing

View More