Square
Following
Hot
News
Profile
Share your thoughts
placeholder
Article
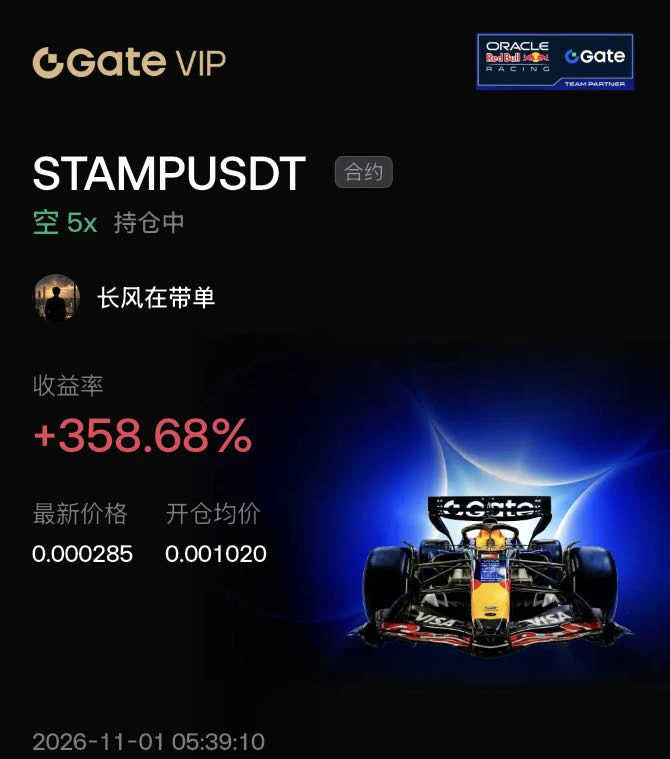
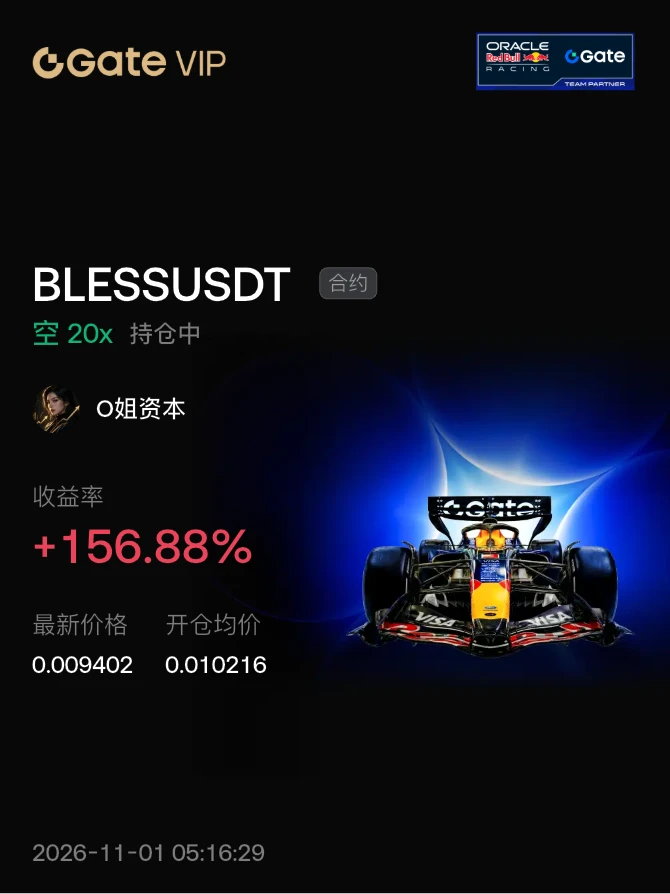
$STAMP Heavy resistance at the highs was clear. Around 0.001020, I flagged a short in the chatroom. Price and volume showed “bearish divergence + distribution”; after a long upper wick, consecutive down candles broke lower, and the primary downtrend began as expected.
The chart showed rising volume at the top without further gains, a high-volume sell-off on the breakdown, and a low-volume rebound confirming weakness. Buying pressure had dried up. Moving averages turned down. The 5x short had low leverage but captured the deep decline, precisely catching the main down leg.
Now at 0.000285, for
post-image
STAMP+52.30%
BTC-0.65%
  • 1
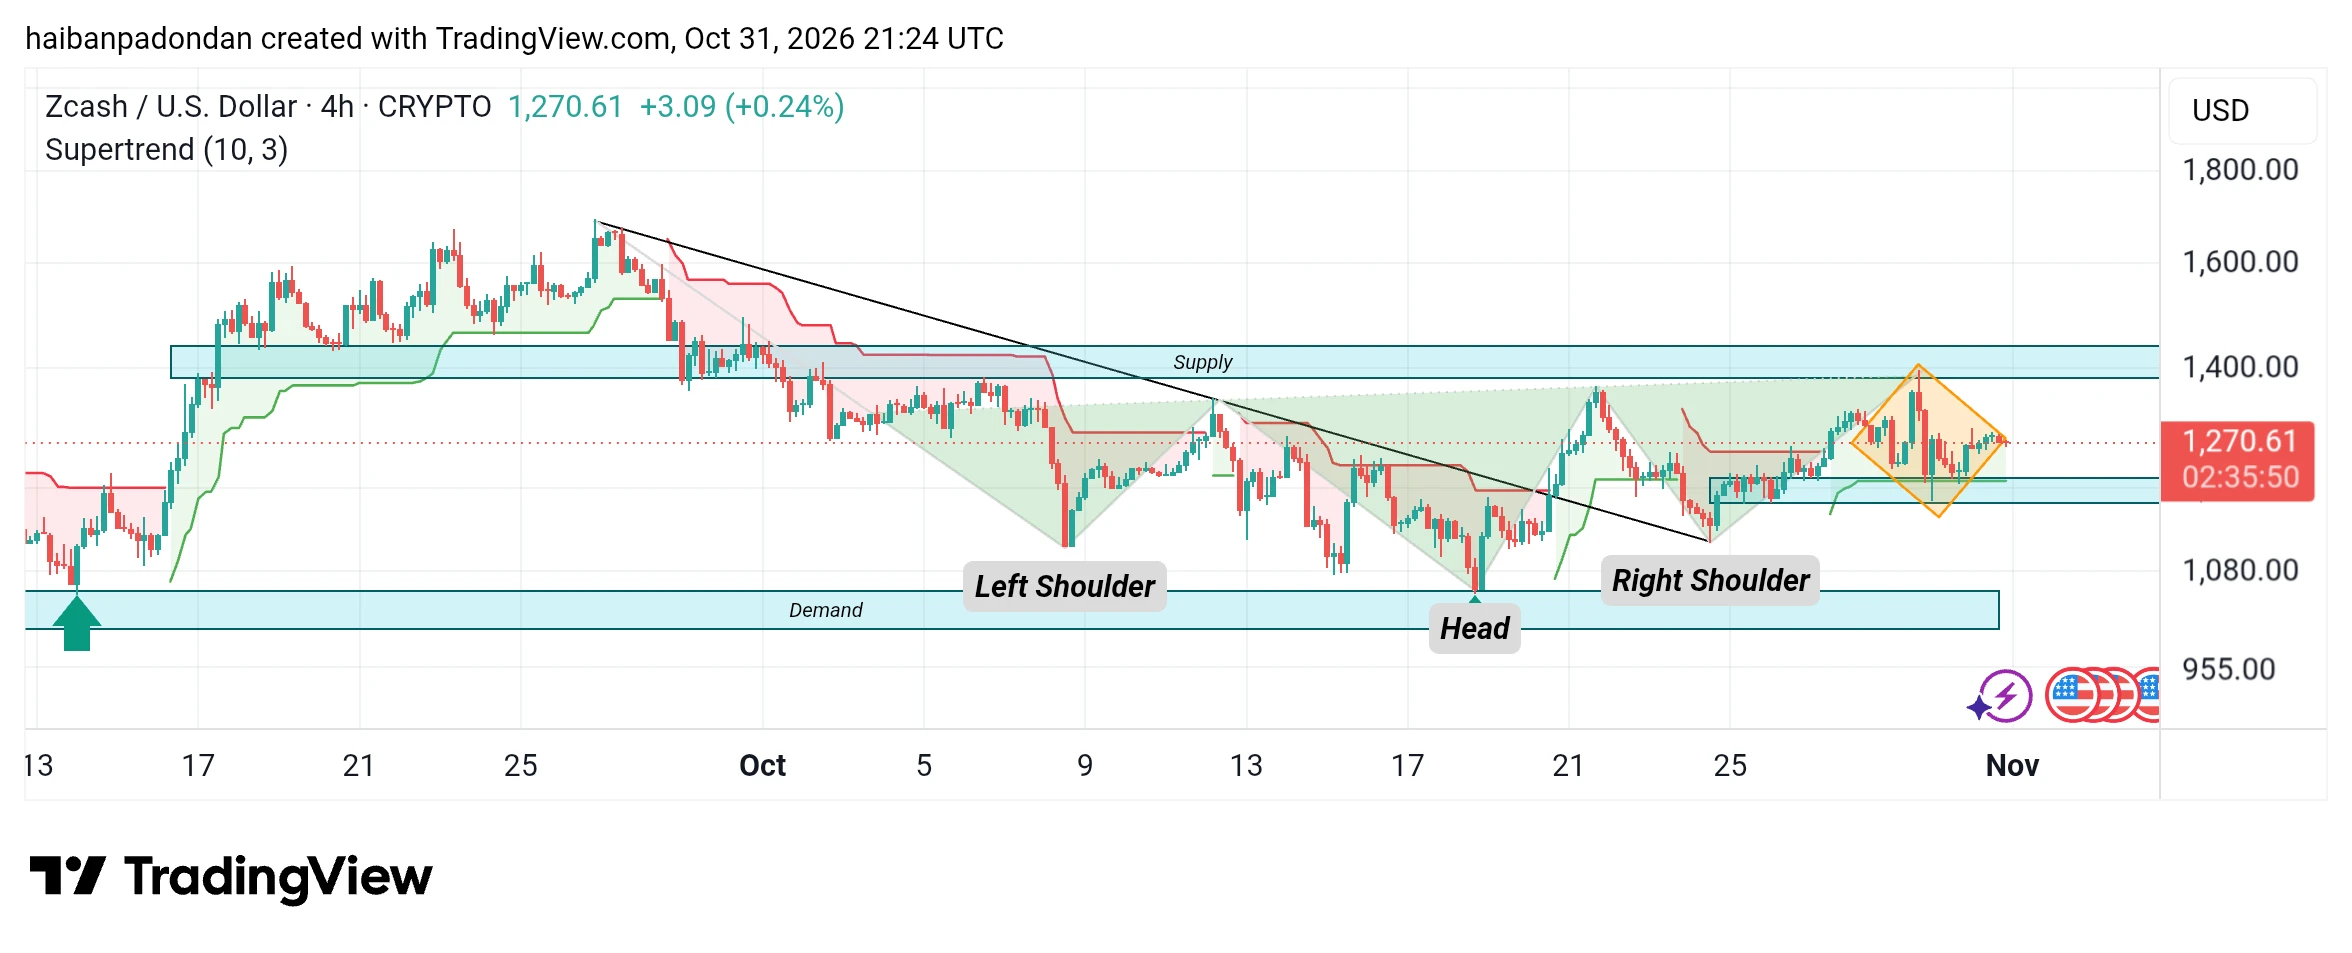
Let’s break down the price movement of Zcash $ZEC ‌on this 4-hour chart in a relaxed and easy-to-understand way:
1. Previous Price Action (Inverted Head and Shoulders)
Inverted Head and Shoulders: You can spot a pattern resembling an upside-down head and two shoulders (Left Shoulder, Head, Right Shoulder). This is a classic signal that bearish (selling) pressure is exhausting and buyers are beginning to take control of the market, setting the stage for an upward move.
Breaking the Downtrend Line: Previously, the price was trapped in a downtrend, marked by a slanted black line (trendline). Not
post-image
ZEC+1.16%
Trenches
Q
Q
bade
b
Q
0xc0...0589
Market Cap
$.
Change
.
24h Vol
$.
Holders
.
DESSA
D
bade
b
DESSA
npz2...pump
Market Cap
$.
Change
.
24h Vol
$.
Holders
.
GTA6
G
bade
b
GTA6
4kjr...zDnz
Market Cap
$.
Change
.
24h Vol
$.
Holders
.
ZIG
Z
bade
b
ZIG
0x8c...1145
Market Cap
$.
Change
.
24h Vol
$.
Holders
.
IDOL
I
bade
b
IDOL
0x3b...ab07
Market Cap
$.
Change
.
24h Vol
$.
Holders
.
btc market updates
live-cover
LIVE1,437
BULLS ARE TRAPPED — $HEMI USDT SHORT SETUP IS READY TO GO
$HEMI /USDT
Direction: SHORT
Entry Zone: 0.0046660
Take-Profit Targets:
TP1: 0.0045446
TP2: 0.0044636
TP3: 0.0043422
Stop-Loss: 0.0048279
$HEMI ‌
HEMI-2.79%
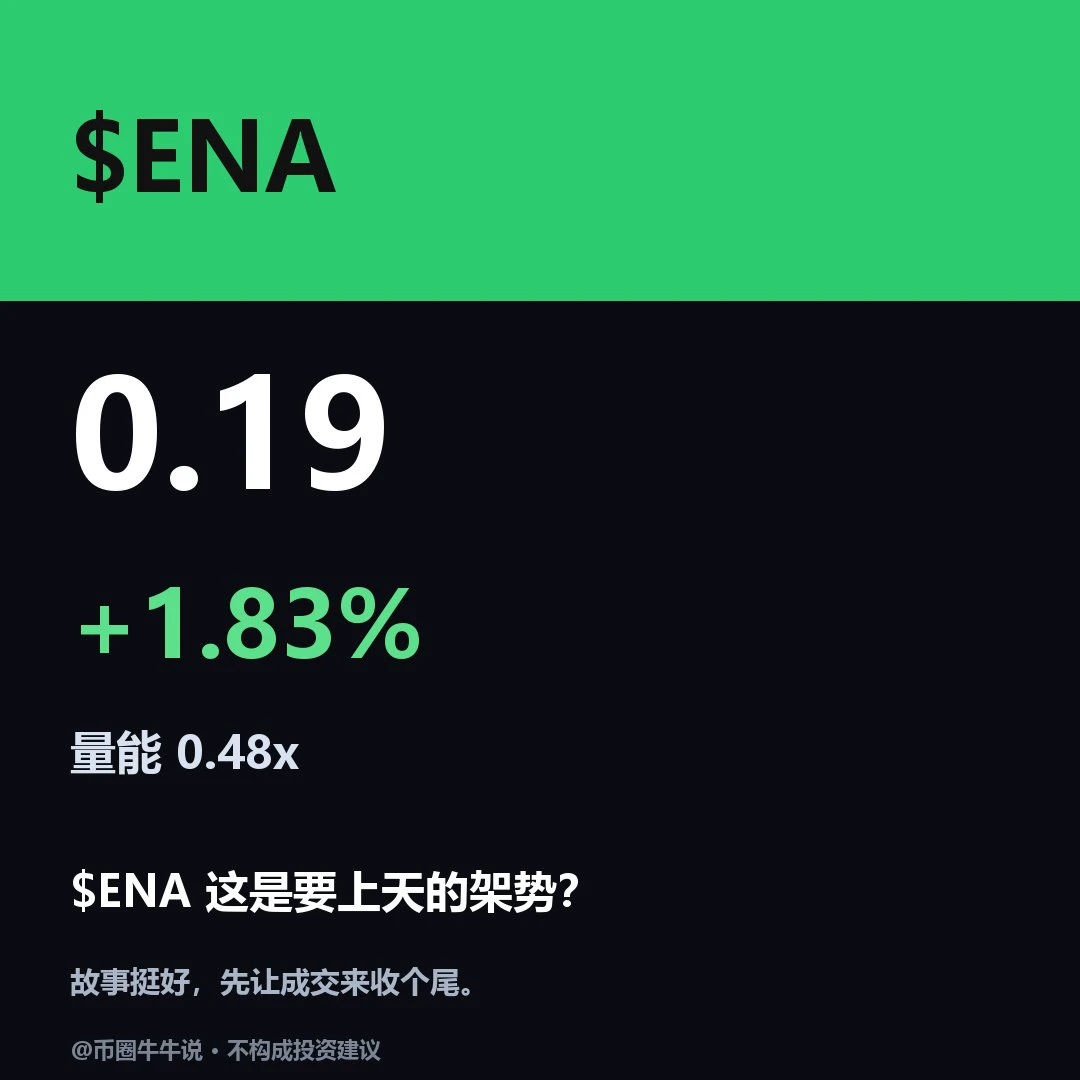
$ENA is currently at 0.1893, up 1.83% over 24H. Both the 1H and 4H time frames are weak, with RSI in the weak zone on both. If the price holds above the 0.1965 resistance level, watch for continuation; if it breaks below the 0.1854 support level, a pullback may follow. Going forward, focus on whether the price can hold above 0.1965 and recover after losing 0.1854; trading volume is only 0.48x the average, so participation needs confirmation. Market volatility is high; for observation only.
post-image
ENA+8.04%
$LIT This 15.86% rally is a classic bull trap; anyone chasing the price today is just here to hold the bag. The current price is 3.1482, with 24h trading volume of 52.6M. Volume has picked up, but the price hasn't reached the daily high of 3.1679—pay attention to this detail: the high came early in the session, and since then the price has been grinding sideways around 3.14, a classic pump-and-dump pattern. From the 24h low of 2.6867 to the current price, the range is 17%, with enough turnover for early holders to exit comfortably. My take: this move was driven by short-term funds making a qui
LIT-4.56%
  • 9
  • 2
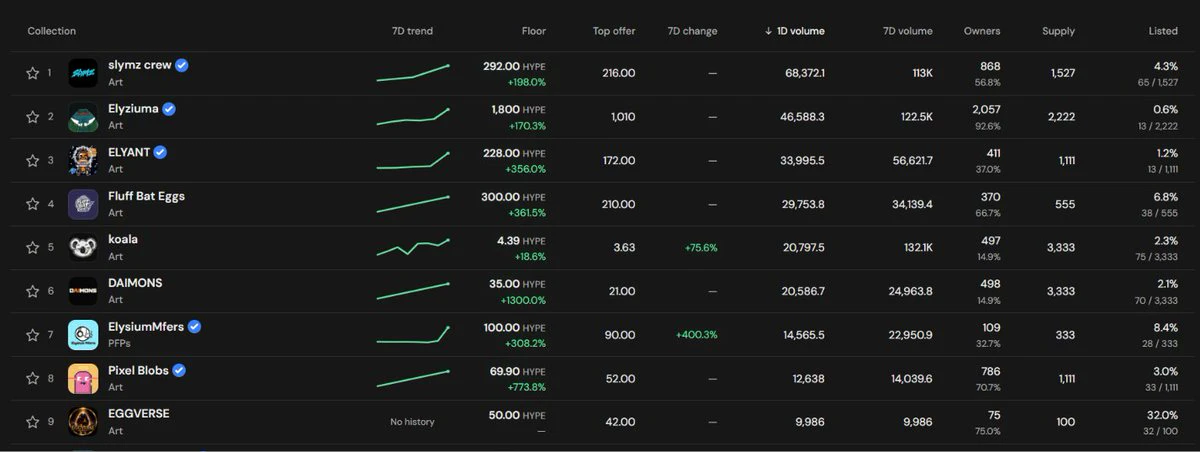
#晒出我的持仓收益 This dip looks pretty good. I'm going to sleep; ETH is up in the livestream room.#BTC大跌 #ETH回落 #HYPE逆市大涨 #谷歌云增长103%股价却跌近10%
post-image
BTC-0.67%
ETH-1.26%
HYPE+0.24%
I lost my principal just to earn a little interest. Damn it, a hacker hacked my account🤮$$TRX
post-image
TRX+0.42%
$PEPE ‌pepe A double-sided life, a legend remembered by countless crypto enthusiasts, and my lucky coin
post-image
PEPE+1.05%
  • 1
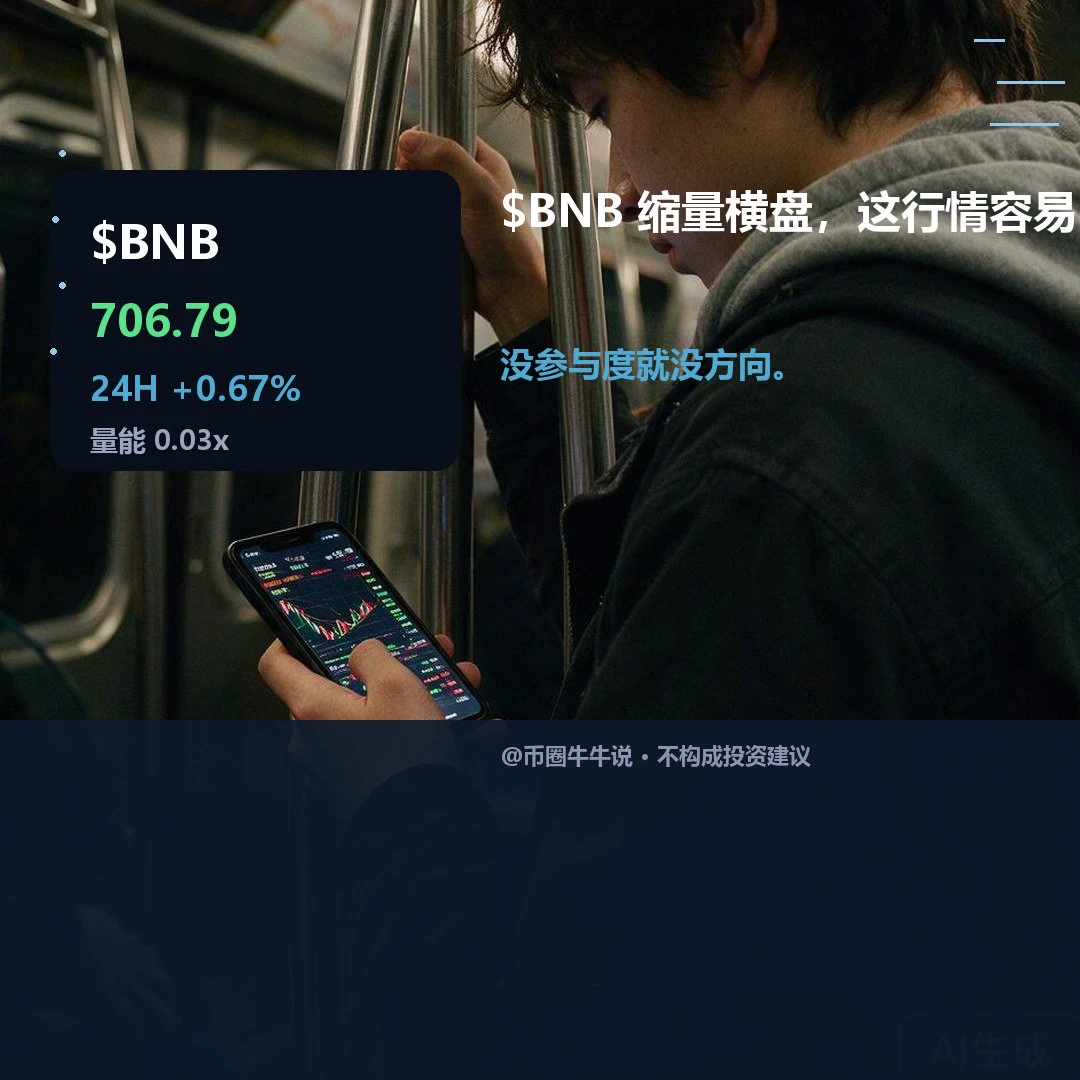
$BNB is currently trading at 706.79, up 0.67% in 24H. The 1H bullish and 4H bearish signals show a clear divergence. If the price holds above the 710.83 resistance, watch for continued upside; if it falls below the 696.33 support, a pullback is possible. Keep an eye on whether the price can hold above 710.83 and recover if it loses 696.33. The market is volatile; for observation only.
post-image
BNB-0.76%
SOL | Short 🔴 | Bearish | 15-minute, 24-hour: +0.52% | Volume: 636.2M USDT. Short rationale: Price is below EMA200; EMA20/50/200 are bearishly aligned; RSI14 is 38.9; MACD histogram is negative; ADX14 is 17.9; volume is 0.56x the 20-period average; trend pullback/continuation. Entry: 95.63 Stop-loss: 96.2163 Take-profit 1: 94.8971 | Take-profit 2: 94.4574 | Take-profit 3: 93.8711 Entry position is for reference only; do not chase the trade. The setup is invalidated if the stop-loss level is hit. Technical analysis only; this is not financial advice. $SOL $SOL
post-image
SOL-0.77%
$ETH $ETH still looks good… Bulls are trying to make a comeback. Long plan: Entry: 2255 – 2265 Take Profit 1: 2300 Take Profit 2: 2350 Final target: 2400 Stop loss: 2180 ETH has regained momentum well after bouncing off the 2172 support level. As long as the 2230 – 2210 range holds, I remain bullish, with a potential rise to 2300, 2350, or even 2400 in the coming days. A convincing breakout above 2270 could bring stronger buying momentum. There is still resistance ahead… Bulls need to hold these levels. Be sure to set a stop loss when trading. Trade ID: $ETH
post-image
ETH-1.26%
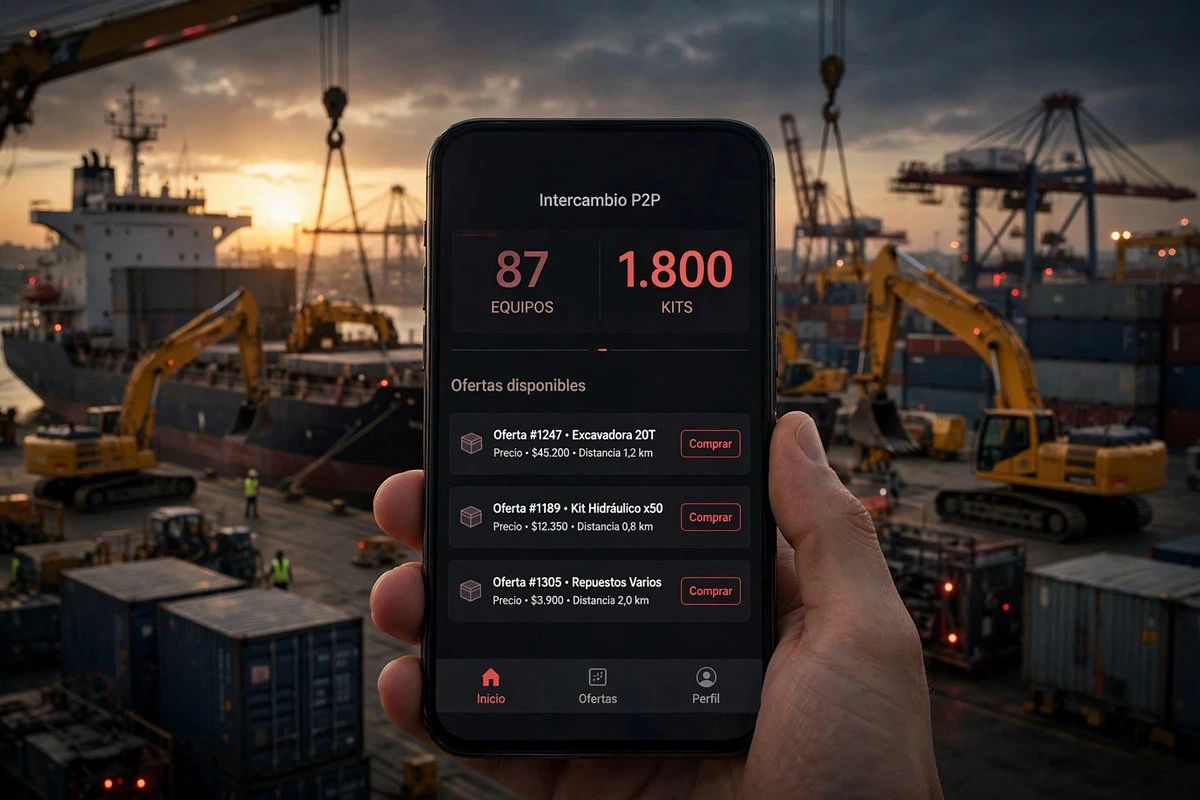
🚜 87 machines and 1,800 housing kits arrived from China to rebuild La Guaira. And behind every excavator is something that doesn’t show up in the port photo: contracts, freight charges, and payrolls that are often handled in USDT and P2P.
On Saturday, October 31, Puerto Cabello woke up to unusual activity: a shipment of strategic equipment bound for La Guaira. The exact breakdown:
• 40 Lovol excavators, 10 mini excavators, and 8 front-end loaders
• 6 mobile cranes, 5 XCMG bulldozers, and 2 Shantui bulldozers
• 2 motor graders, 6 dump trucks, 4 trucks with crane arms, and 4 generators
• 1,800
post-image
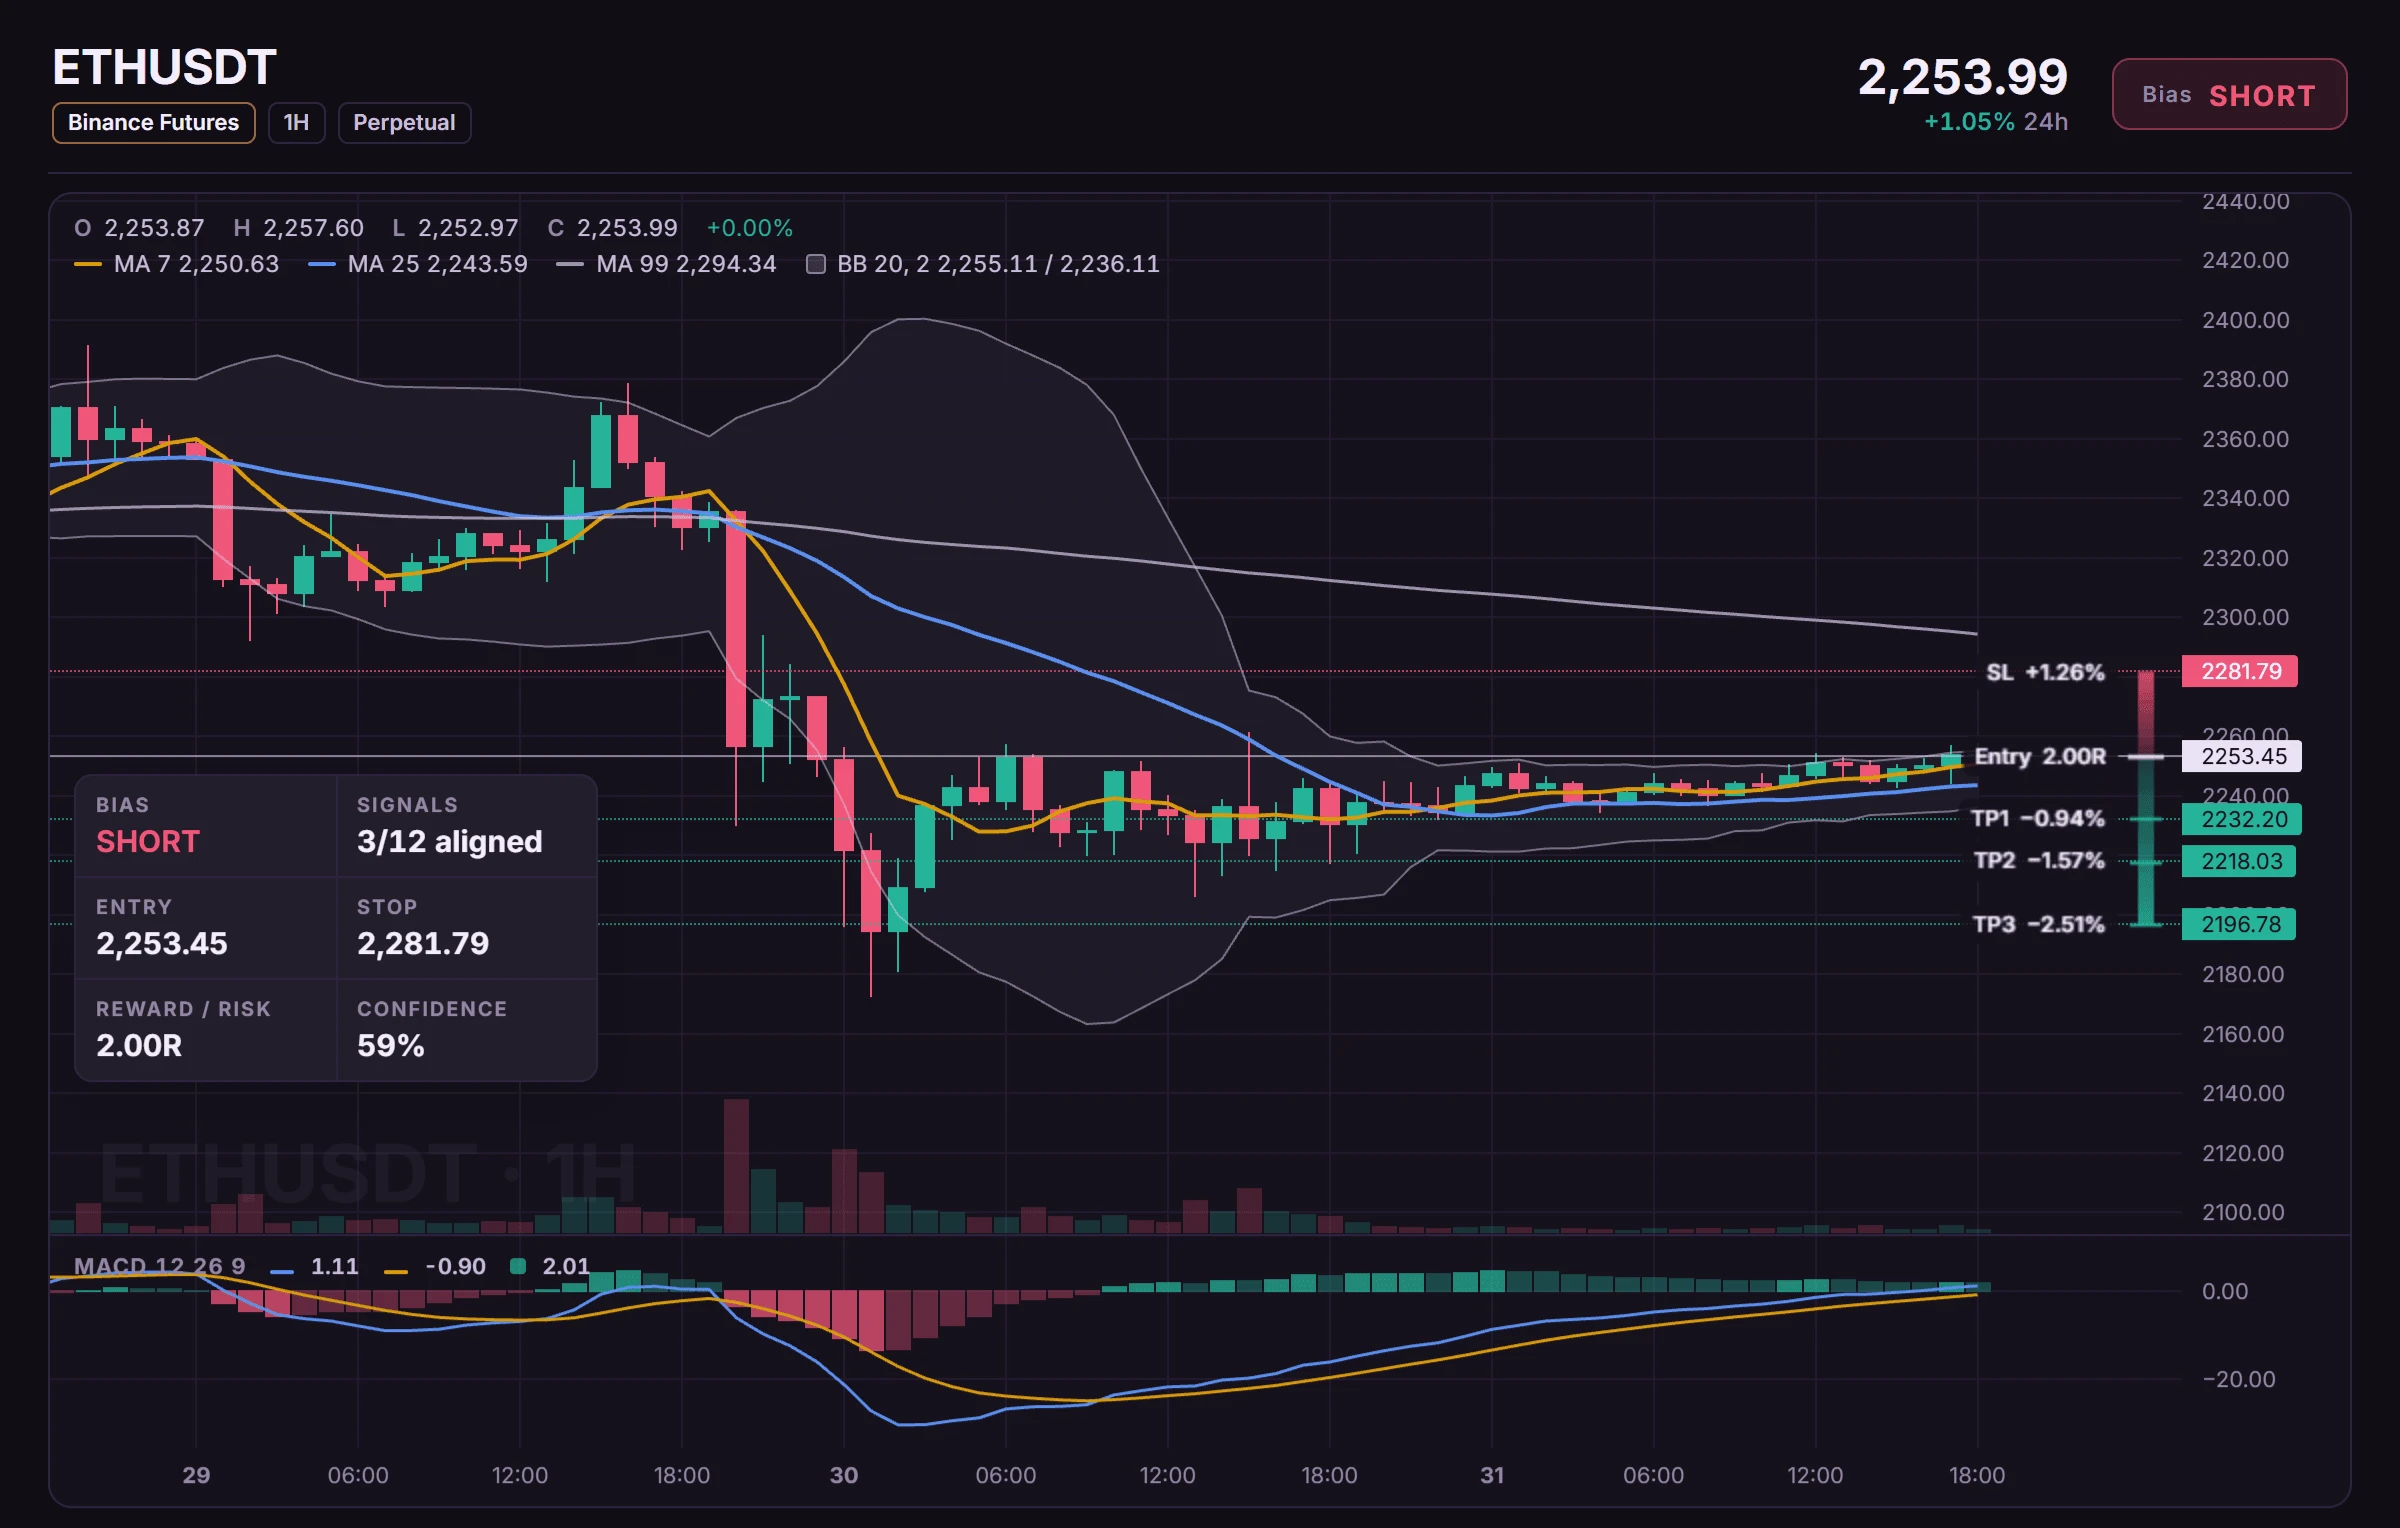
$ETH /USDT Short Trade Plan
Short Position
Entry Price: 2,253.45
Profit Targets:
TP1: 2,232.20
TP2: 2,218.03
TP3: 2,196.78
Stop-Loss Price: 2,281.79
$ETH ‌
post-image
ETH-1.23%
Anyone trading on Kalos fun or planning to?
Drop the wallet address you use on the @kalosfun testnet. No requirements just follow me and that is enough
I have a little surprise for you 🎁
post-image
FUN-0.44%
$FIL $FIL is holding firmly above those moving averages on the 1H chart. It feels like it’s just catching its breath before deciding what to do next. Let’s see whether buyers step in here or if the price continues to move sideways for a while. Take profit: 0.9083 Stop loss: 0.8383 Quick market check: $HYPE : Current price 88.029 - 24-hour change: -2.38%$ESPORTS : Current price 0.009989 - 24-hour change: +42.29%
post-image
FIL-2.00%
HYPE+0.24%
ESPORTS-5.30%
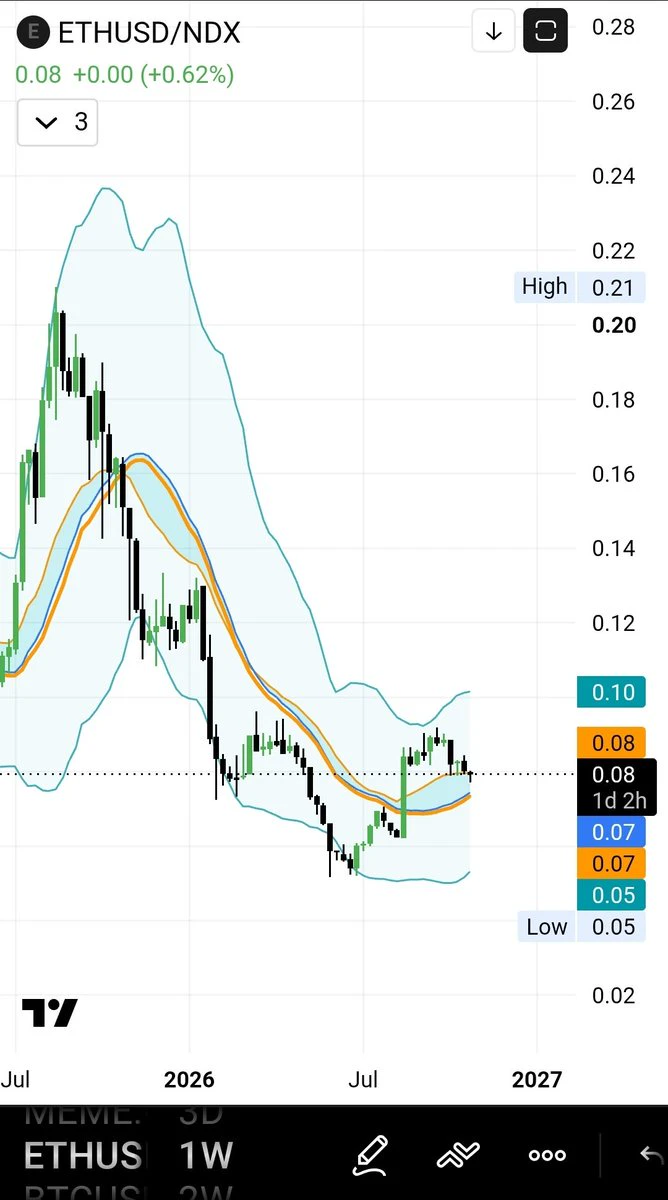
$ETH / NASDAQ 100 IS ABOVE THE BAND FOR THE FIRST TIME SINCE OCTOBER 100B LIQUIDATION EVENT...
DO YOU KNOW WHAT IT MEANS?
post-image
ETH-1.26%
NAS100-2.31%
Load More

Join 40 M users in our growing community

⚡️ Join 40 M users in the crypto craze discussion

💬 Engage with your favorite top creators

👍 See what interests you

Trending Topics

BTC大跌

359.58k Views39.68k Discussing

$BTC briefly fell below $77,000 and remains under pressure around the $77K zone, with its 24-hour decline still above 4%. With risk appetite weakening and Fed uncertainty rising, where is the next key support after losing $80K?

IntelBeatsEarningsButStockPlunges

28.51k Views907 Discussing

StrategySTRCNears100ParValue

34.48k Views4.12k Discussing

View More