Square
Following
Hot
News
Notifications
Profile
Share your thoughts
placeholder
Article
When the Fear and Greed Index falls to 28, the most common mistake is to take “be greedy when others are fearful” as a cue to buy the dip immediately. But sentiment indicators only show the degree of panic, not whether selling pressure has been exhausted—the real dip-buying opportunity requires structural confirmation, not just a single number.
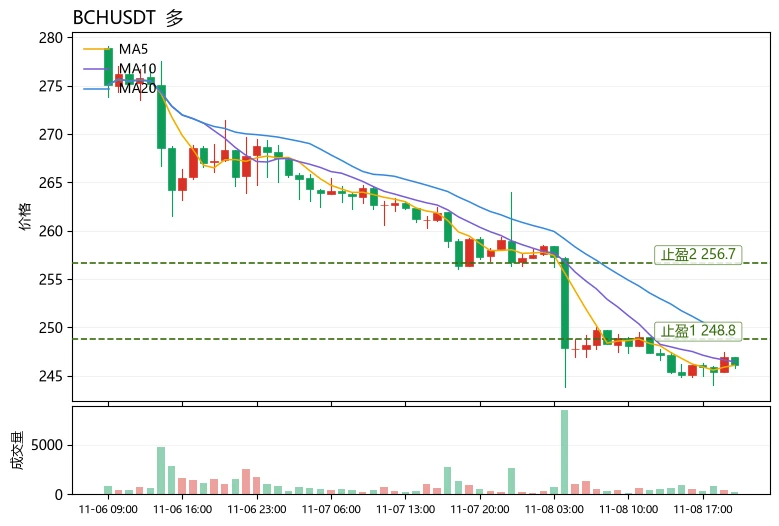
BTC weakness is currently dragging major coins lower. $BCH is down 4.94% over 24 hours to 246.1, with trading volume of just 5.7M USDT, indicating a low-volume grind down rather than panic selling on heavy volume. MA5=246.08 has fallen below MA20=248.8
post-image
BCH+1.05%
MET-0.33%
PUMP-1.06%
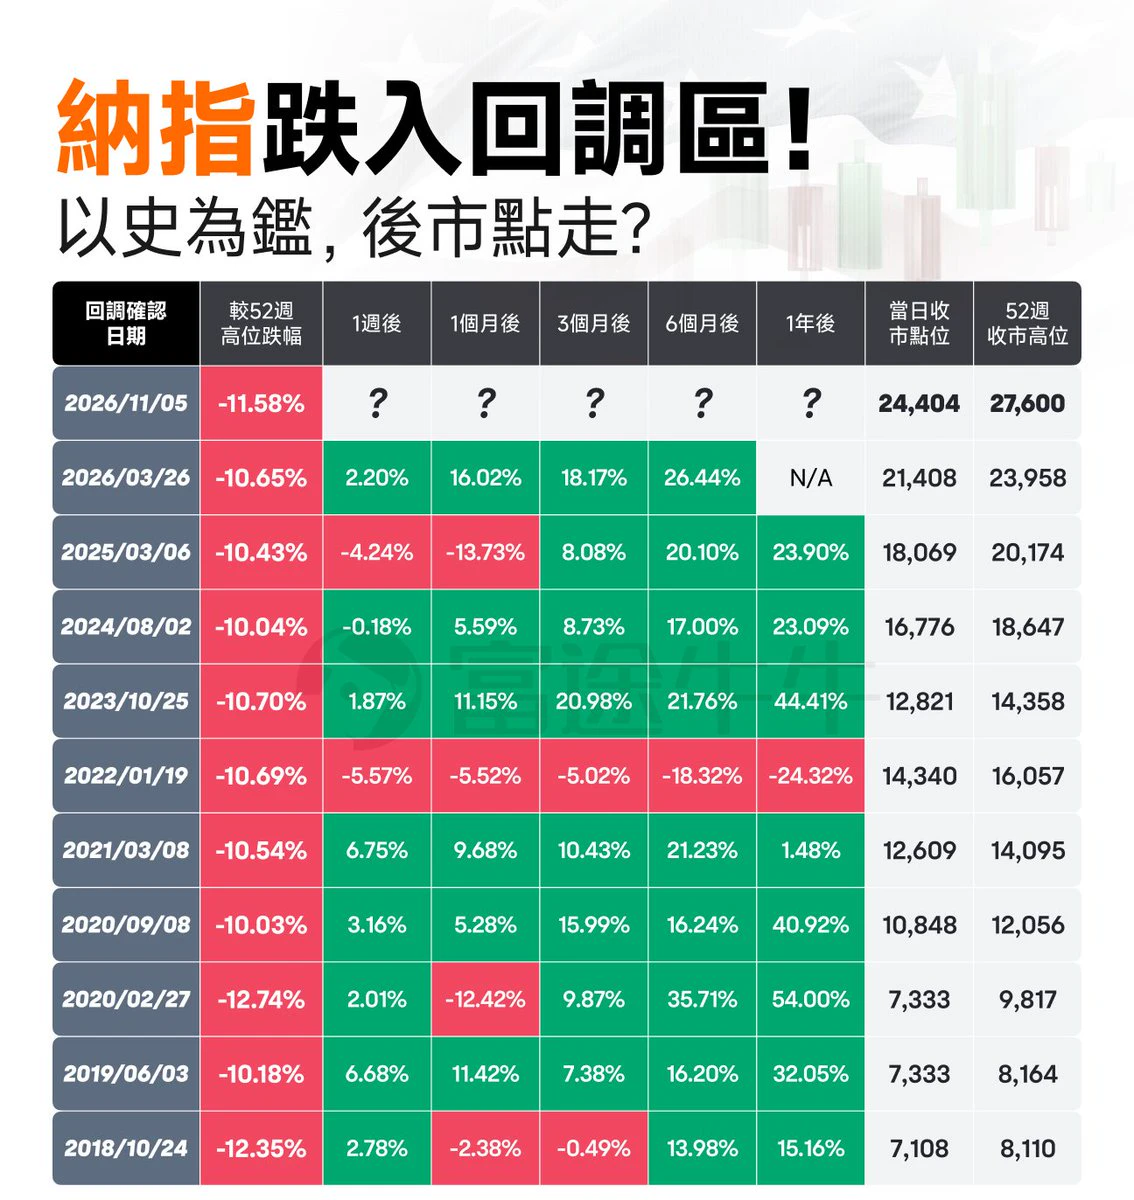
This statistic is very interesting: the last 10 times the Nasdaq fell 10% from its peak, how long did it take to recover
There was an 80% chance of recouping losses after 1 week and a 90% chance of being back in positive territory after 6 months
But the only exception was in January 2022, when it took a full 2 years. The reason sounds familiar: inflation led the Fed to raise rates, Treasury yields surged, and tech stocks were crushed
post-image
NAS100-0.07%
Trenches
ZIG
Z
bade
b
ZIG
0x8c...1145
Market Cap
$.
Change
.
24h Vol
$.
Holders
.
STONK
S
bade
b
STONK
6GmA...UNgx
Market Cap
$.
Change
.
24h Vol
$.
Holders
.
CLAUDIA
C
bade
b
CLAUDIA
2j5S...W2ZM
Market Cap
$.
Change
.
24h Vol
$.
Holders
.
IDOL
I
bade
b
IDOL
0x3b...ab07
Market Cap
$.
Change
.
24h Vol
$.
Holders
.
FLOAT
F
bade
b
FLOAT
Bv1a...BMmr
Market Cap
$.
Change
.
24h Vol
$.
Holders
.
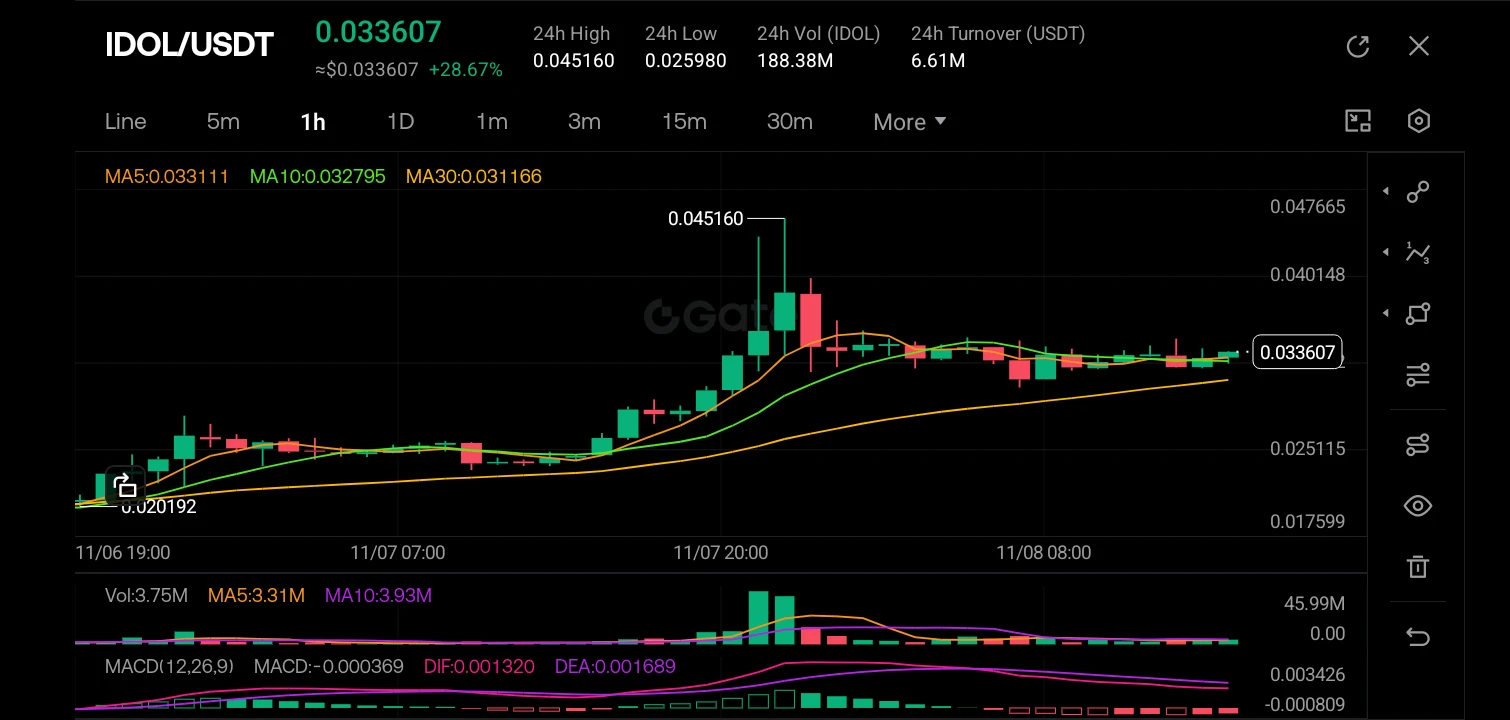
$IDOL ‌
The chart shows a classic "pump and consolidation" structure; IDOL exploded from a base of roughly 0.020 to a peak of 0.045160, marking a massive +28.67% gain for the day, but the current 1H candles show a cooling-off period with smaller bodies and wicks, indicating the buying momentum has paused. The price is currently trading at 0.033607, which is holding above the MA5 (0.033111) and MA10 (0.032795), suggesting immediate support is intact, while the MA30 (0.031166) acts as the stronger trend floor below. On the MACD, we see a bearish cross with the DIF (0.001320) dipping below the D
post-image
IDOL-7.01%
  • 1
I control the market, slaughtering both bulls and bears!
BTC and ETH fire in both directions: bait longs at the top and precisely lay in wait with shorts; once the bottom stabilizes, reverse course and go long. Every turning point is locked in ahead of time, price levels nailed down, and the market obediently follows the forecast.
A screen full of closed-position records is the best proof: returns of several times over are realized one after another, trade after trade, harvesting nonstop!$BTC ‌$ETH

#CPI数据前瞻
BTC-0.65%
ETH-1.23%
Boom—💰👇$KOMA All targets have been achieved. 🤑💰👇💆 has reached 0.017200. Keep an eye on it, lock in your profits, congratulations 🎉🤑💰👇
post-image
KOMA-3.91%
#每周来晒 #广场交易达人 #WCTCS9
How Will Gold Move Next Week? My Market Read and Trading Plan

I. Market Analysis

Gold had a particularly choppy week, rallying before pulling back. At its core, this was a tug-of-war between bulls and bears, with neither side gaining a clear upper hand.

The bears’ trump card is rate-hike expectations. The market is now pricing in roughly an 80% chance of a 25bp Fed rate hike in December. The U.S. Dollar Index is holding above 102, while the 10-year Treasury yield is hovering around 4.8%. Rising real rates naturally weigh on gold, a non-yielding asset. This is the fund
post-image
XAUUSD-0.45%
Bitcoin Doesn’t Need Banks, but Strategy Wants to Become a Bitcoin Bank
live-cover
LIVE2,319
#USCPIDataIncoming
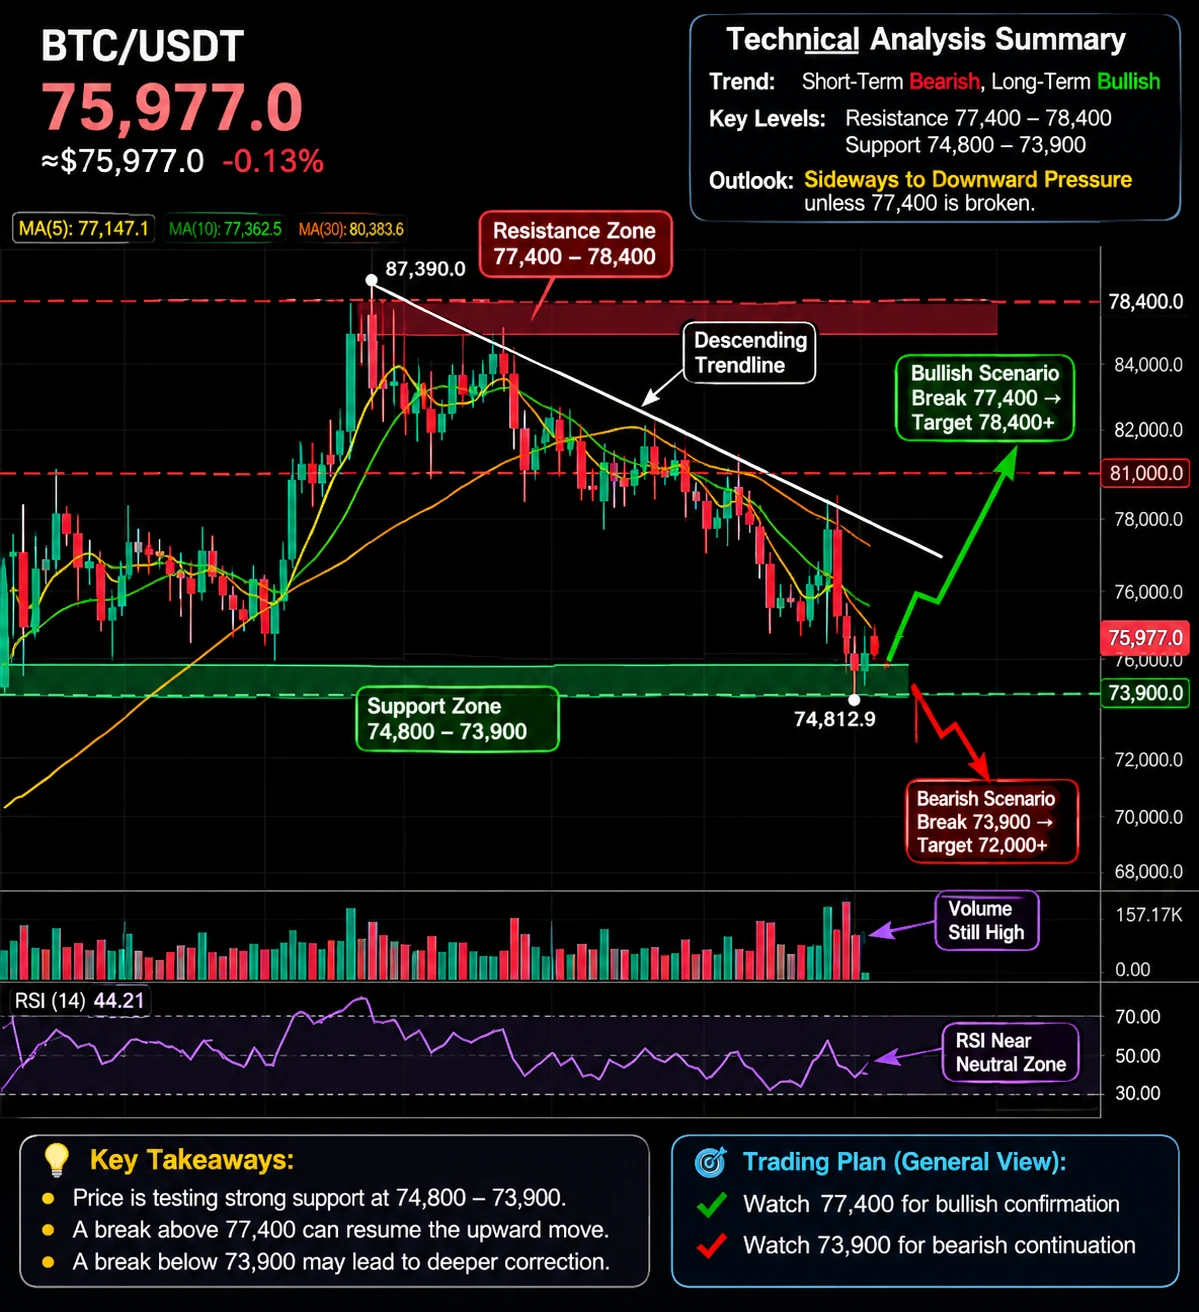
Today, I expect BTC to rebound; the 80-81k range will be tested again. After weeks of back-and-forth within the resistance/support range, I expect a nice transformation. If 81k breaks, the 84-86k range could be tested again. For now, I don't expect 90k in the near term, but I expect a rise toward the new year.
long position
entry level 75800
10x
close 81k
$NVDA $BTC ‌
post-image
NVDA+2.80%
BTC-0.65%
  • 3
In BTC trading, how can you develop a truly actionable trading plan?
Many BTC traders study the market every day, analyzing candlesticks, trading volume, and various technical indicators, and often discuss whether the market will rise or fall next. But when it comes time to trade, they often run into the same problem: no clear entry criteria, stop-loss decisions made on the fly, and no idea when to exit a profitable trade.
That’s why some people can study the market for a long time, yet their account performance remains inconsistent.
To build a truly actionable trading plan, you can start with
post-image
BTC-0.65%
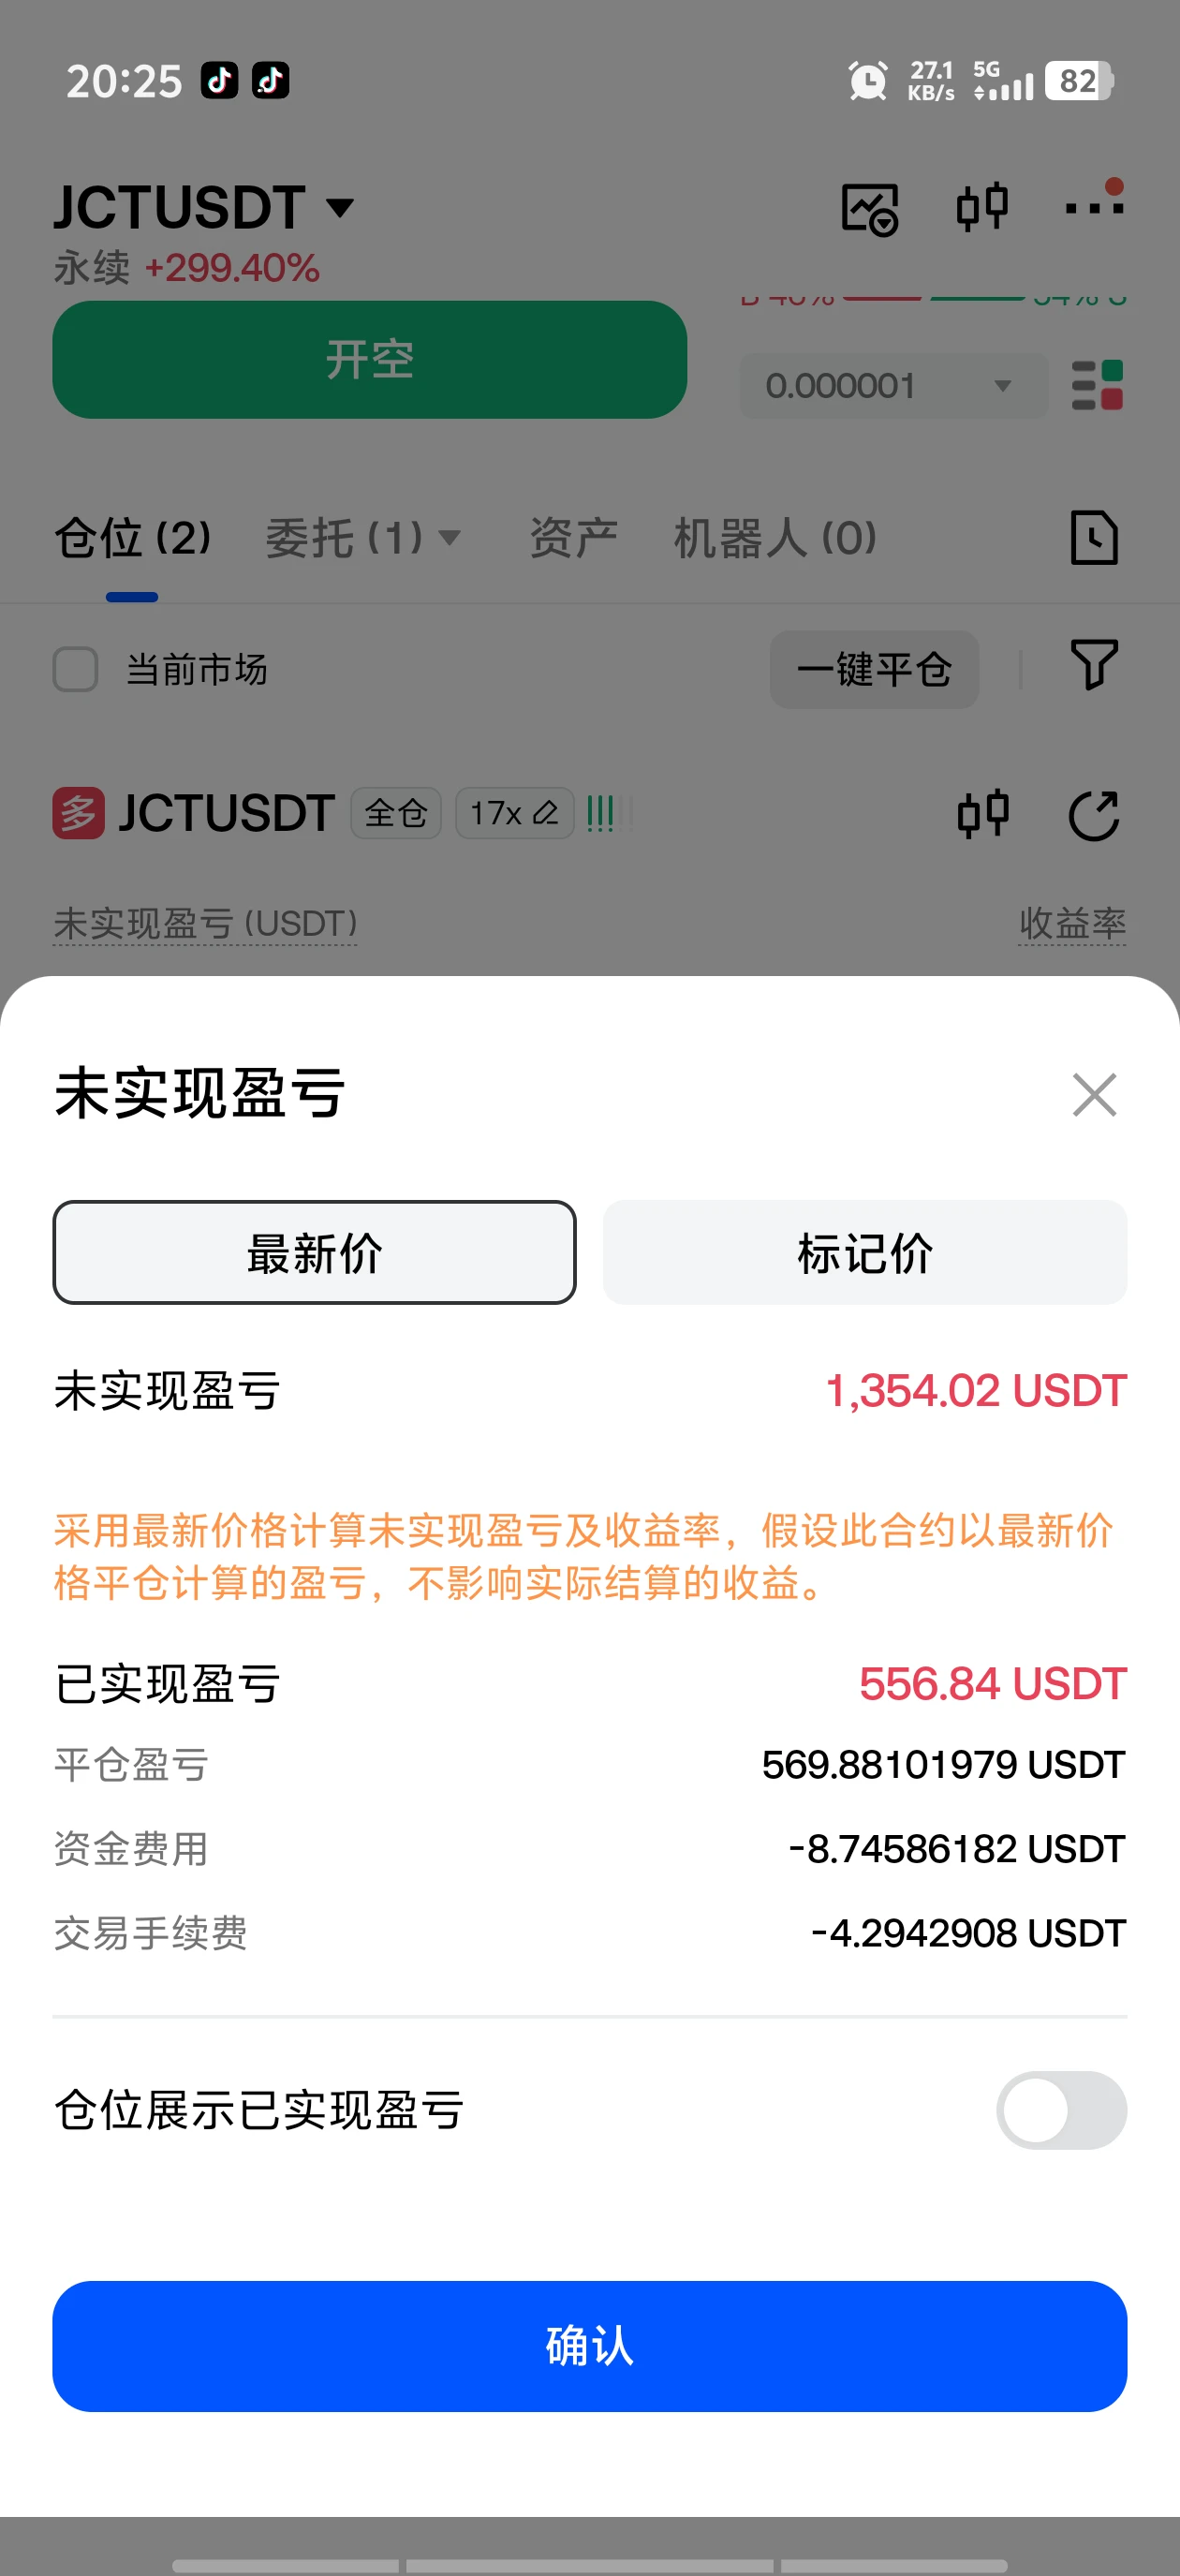
$JCT Guys, I'm done playing with you. I opened a position and lost 800 bucks
post-image
JCT-3.26%
$JCT This price action is very patterned. The previous few times, it plunged more than 40% without warning, then quickly rebounded. This is clearly the market manipulators playing a game of sharp drops and quick rallies. Just keep holding your short positions.

$JCT Futures
Risk warning: The above is only a personal opinion and does not constitute investment advice. Futures trading carries extremely high risk; please proceed with caution.
post-image
JCT-3.26%
  • 2
$ZEC ‌
🟢LONG · 15m ·🟢
R:R 1:1.5 ·
Entry
1,262.1
Stop
1,257.8 −0.34%

Take Profit 1 +0.5%
1,268.4
Take Profit 2 +0.98%
1,274.5
Take Profit 3 +1.51%
1,281.2

DYOR 🤔
PROFITS TO EVERYONE 💲💪💲🤝
ZEC+1.29%
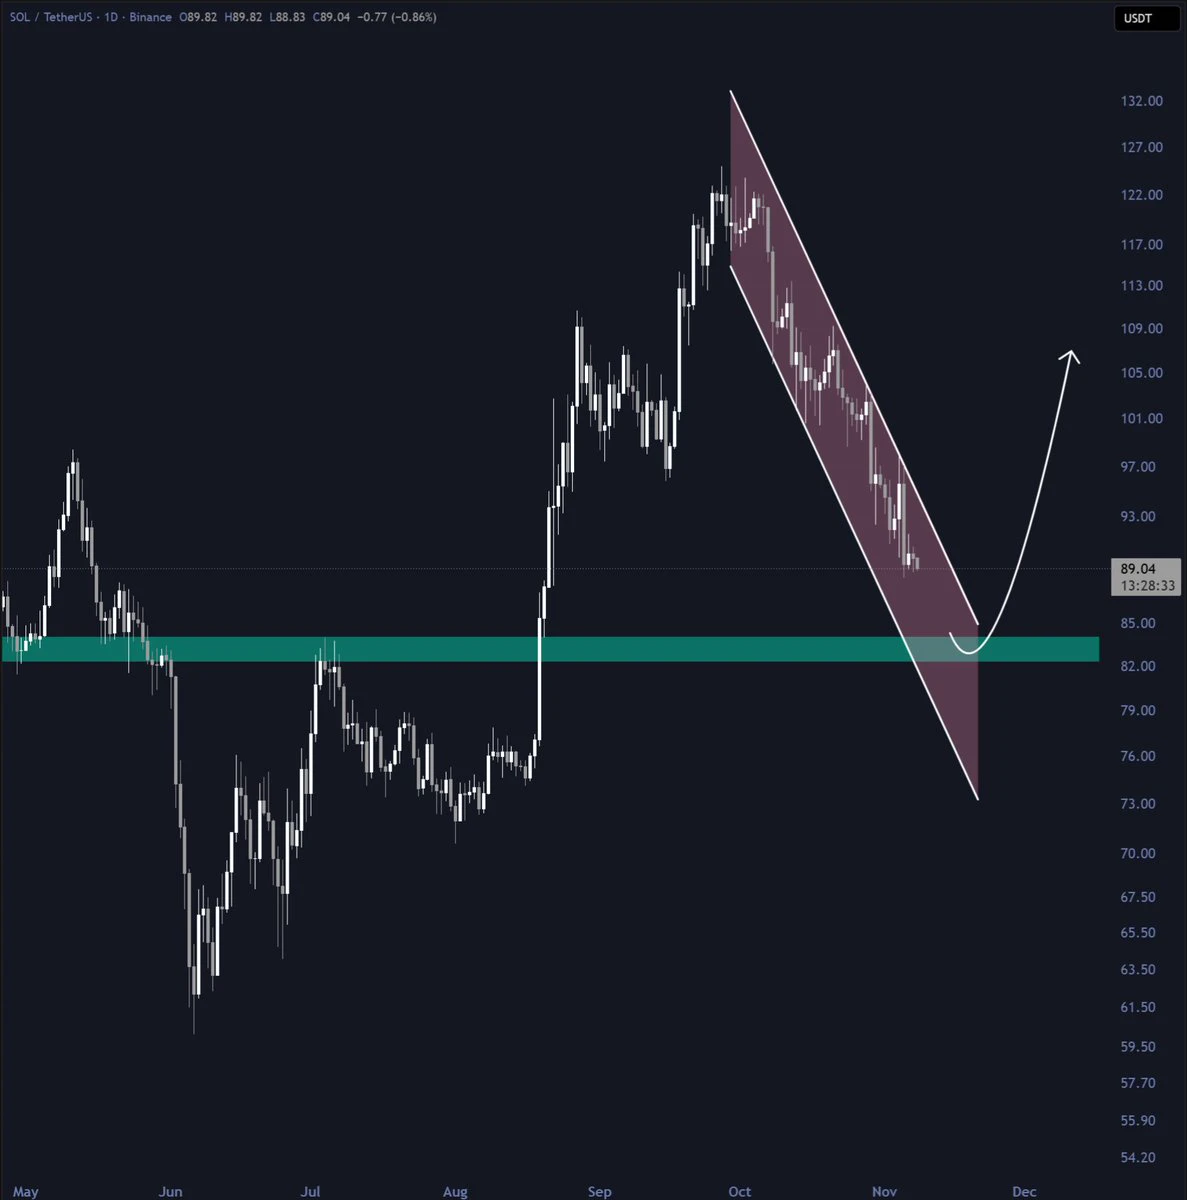
$SOL is approaching its July high
This is a level where we could see the strongest reversal
post-image
SOL-0.77%
#CPI数据前瞻 #作手分析 #WCTCS9
🔥 U.S. October CPI is coming up! Has all the bad news already been priced in? Can this inflation report still trigger a selloff?

Trading watchlist: $BTC $ETH $NVDA $GOOGL $XAU

At 21:30 Beijing time on November 10, the U.S. will release its October CPI data.

September CPI rose 3.7% year over year. The market expects headline CPI to rise about 0.24% month over month in October, and core CPI to rise about 0.2%.

I have a view on this CPI report that differs from the market consensus: If inflation comes in below expectations, the market could see a rebound; even
post-image
BTC-0.67%
ETH-1.26%
NVDA+2.80%
GOOGL+0.72%
XAU+0.38%
  • 9
  • 1
$ONE The direction is already very clear: plunge, plunge, plunge.
ONE-1.19%
$UAI — Short Entry: 0.08170 Take Profit 1: 0.07700 Take Profit 2: 0.07200 Stop Loss: 0.08750 The sharp drop on the daily timeframe has already damaged the bullish structure. Even if a temporary rebound occurs, it may be difficult to reverse the pressure.
post-image
UAI-7.58%
Shatter the illusion of perfection
Take off the filter and see life as it really is
Inner harmony is the ultimate destination
post-image
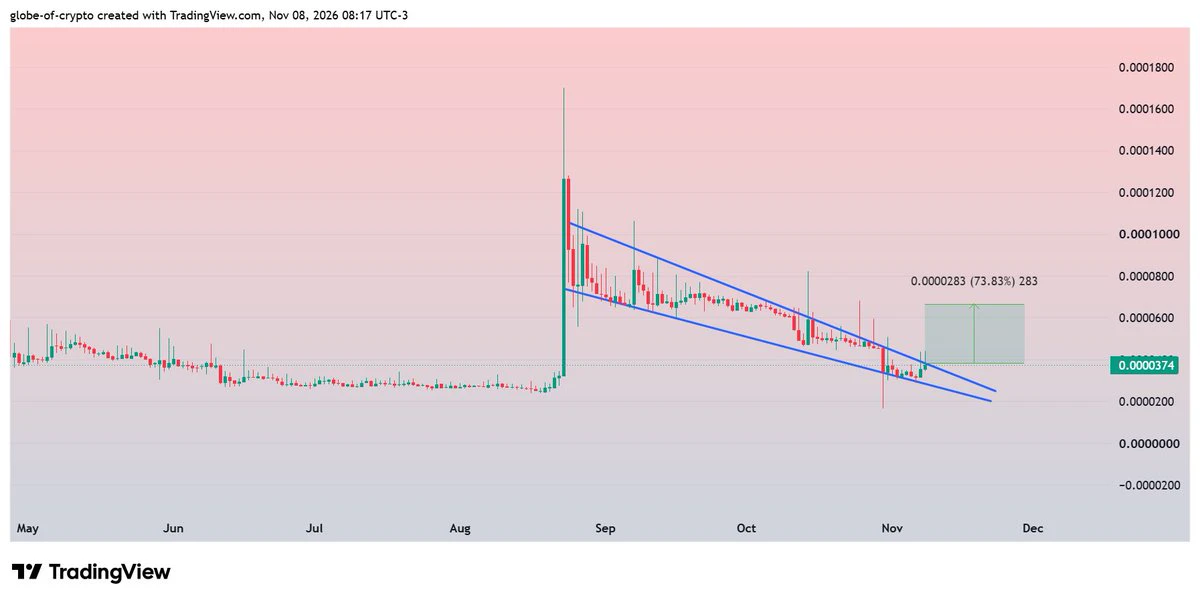
$DENT #DENT
Trying to break Falling Wedge on Daily Chart.
Successful breakout could trigger 60-70% bullish rally✍️
post-image
DENT-0.93%
From now on, I’m going to stay up less and smoke less.

Over the past year, especially these last six months, I’ve been staying up way too late—often not going to bed until two, three, or even four in the morning.

I went from smoking one cigarette a day at first to nearly a pack a day.

I can’t stand this pathetic version of myself anymore.

So what if I’m in debt? Worst case, my credit gets ruined and I pay it off slowly.

I’m getting by on the healthy foundation I built in the past. So far, there’s still nothing wrong with my health.

If I wreck my health too, then I’ll really be done for.
post-image
Load More

Join 40 M users in our growing community

⚡️ Join 40 M users in the crypto craze discussion

💬 Engage with your favorite top creators

👍 See what interests you

Trending Topics

USCPIDataIncoming

7.61k Views1.57k Discussing

The U.S. October CPI report will be released on November 10 at 8:30 a.m. ET. September CPI came in at 3.7% year over year, and markets will be watching closely for signs that inflation is cooling, especially in core CPI. A softer-than-expected reading could strengthen rate-cut expectations, while hotter inflation may pressure risk assets through higher Treasury yields and a stronger dollar. How do you think this CPI print will move $BTC, U.S. stocks and gold?

USAIStocksHitHard

26.63k Views3.72k Discussing

USNonfarmPayrolls

49.41k Views4.46k Discussing
View More