






Square
Following
Hot
News
Notifications
Profile
Share your thoughts
placeholder
Article
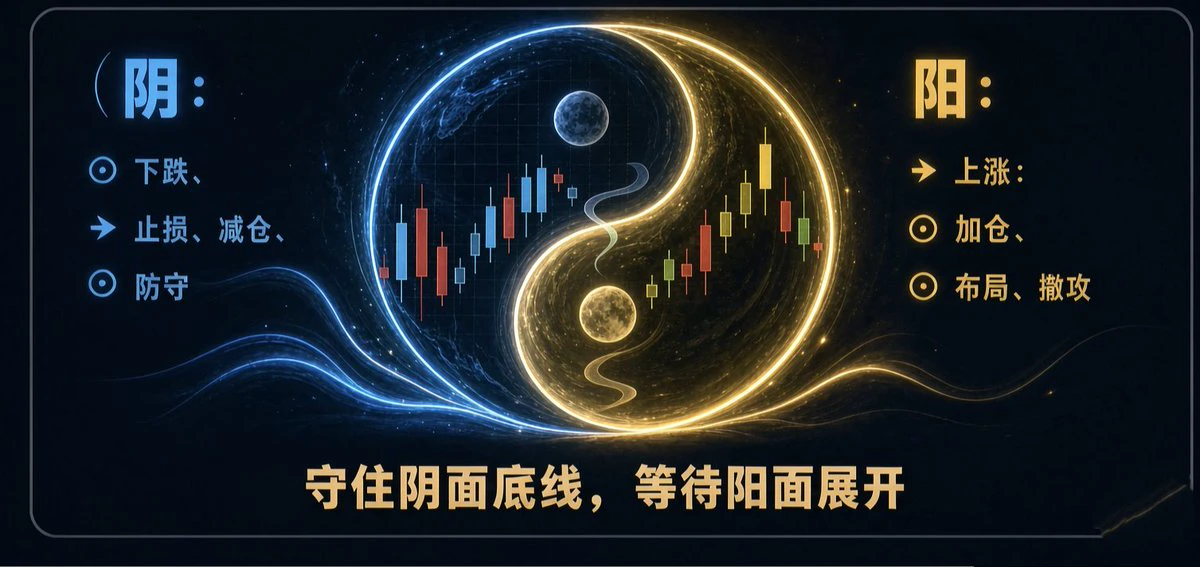
🤔A sudden realization hit me: I think trading is just like tai chi☯️.
In the yin-yang symbol, black contains white and white contains black—the yin reaches its extreme, and yang is already being nurtured; yang reaches its extreme, and yin has already begun to grow.
BTC price action has repeatedly confirmed this pattern:
In 2022, after FTX collapsed and the Fear Index dropped into single digits, yin was at its extreme, yet the 15,500 bottom was quietly forming;
At the end of 2024, breaking above 73,000 with everyone in FOMO was yang at its extreme, and a 30%+ pullback followed right on schedul
post-image
BTC-0.67%
GLDX-0.40%
PAXG+0.37%
10kU Trading Rules: Remember These Principles—they’re More Useful Than Memorizing Price Levels
10kU is a watershed. Below this level, the question is whether your account can survive; at this level, it’s whether you can keep from losing control.
Let me sum up what I’ve said so far and give you a set of rules you can follow:
I. Risk management: Control losses first, then think about profits
Risk no more than 2% per trade (200U). After five consecutive losses, you’ll still have 9,000U—that’s your cushion.
Lose at most twice in a day, then stop trading. Not because the market is bad, but because
post-image
BTC-0.65%
Trenches
牛逼
牛
bade
b
牛逼
0x96...7777
Market Cap
$.
Change
.
24h Vol
$.
Holders
.
ZIG
Z
bade
b
ZIG
0x8c...1145
Market Cap
$.
Change
.
24h Vol
$.
Holders
.
BTC
B
bade
b
BTC
C5xp...pump
Market Cap
$.
Change
.
24h Vol
$.
Holders
.
STONK
S
bade
b
STONK
6GmA...UNgx
Market Cap
$.
Change
.
24h Vol
$.
Holders
.
ANSEM
A
bade
b
ANSEM
9cRC...pump
Market Cap
$.
Change
.
24h Vol
$.
Holders
.
Entering at the current price, crushing the market once again!
This morning, we locked in short entries at 75,500 for BTC and 2,160 for ETH, giving the bulls no chance to catch their breath!
The market pulled back on cue, with BTC plunging to 73,700 and ETH dipping to 2,081, capturing 1,800 points and 80 points respectively. The bears continue to dominate the market!#美国10月CPI即将公布 $BTC ‌$ETH ‌
BTC-0.65%
ETH-1.23%
$UNITREE Looks like it’s about to bounce back. Gotta hand it to Unitree—everyone was bearish on it, but it’s the one that came through. Long! ⬇️
post-image
UNITREE+4.35%
  • 1
For intraday ETH long positions, watch your profits and set a stop-loss at breakeven; if it moves up, continue shorting
ETH-1.23%
$PEPE Can it reach $0.010? $PEPE holders, congratulations 😉 you will soon become millionaires 🤑🤑
post-image
PEPE+0.97%
Life is insanely busy rn but I would still like to take a moment and say that
$crypto looks good here
post-image
solana market predictions
live-cover
LIVE2,270
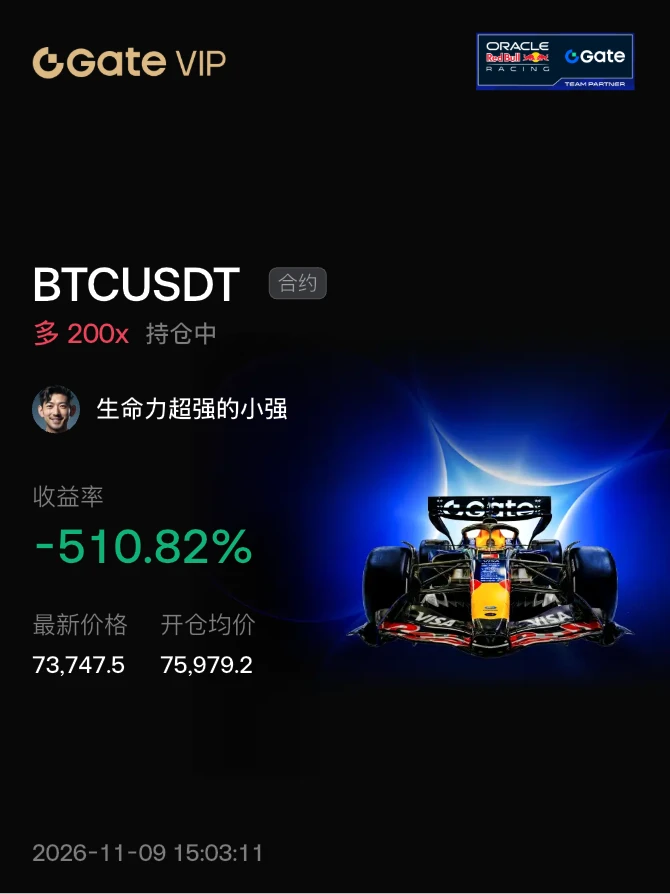
#晒出我的持仓收益 Hurry up and liquidate my position, I really don't want to play anymore
post-image
🔥 Gate Live Weekly Competition | Nov 9–15 Starts TODAY

A new week, a new chance to earn! Go live, climb the leaderboard, and earn guaranteed cash rewards

✅ Complete 3+ valid streams this week to qualify
💰 Eligible streamers receive guaranteed cash rewards
🏆 Top 100 streamers can earn up to 30 USDT this week

🚀 Don't miss out! Start streaming today and compete for this week's rewards

👉 Go Live: https://www.gate.com/live?type=apply
📢 Program Details: https://www.gate.com/announcements/article/102064
‍#GateLive #WeeklyCompetition #StreamerRewards
post-image
  • 9
BTC UPDATES
live-cover
LIVE1,904
No orders over the weekend
The first trading day of the week
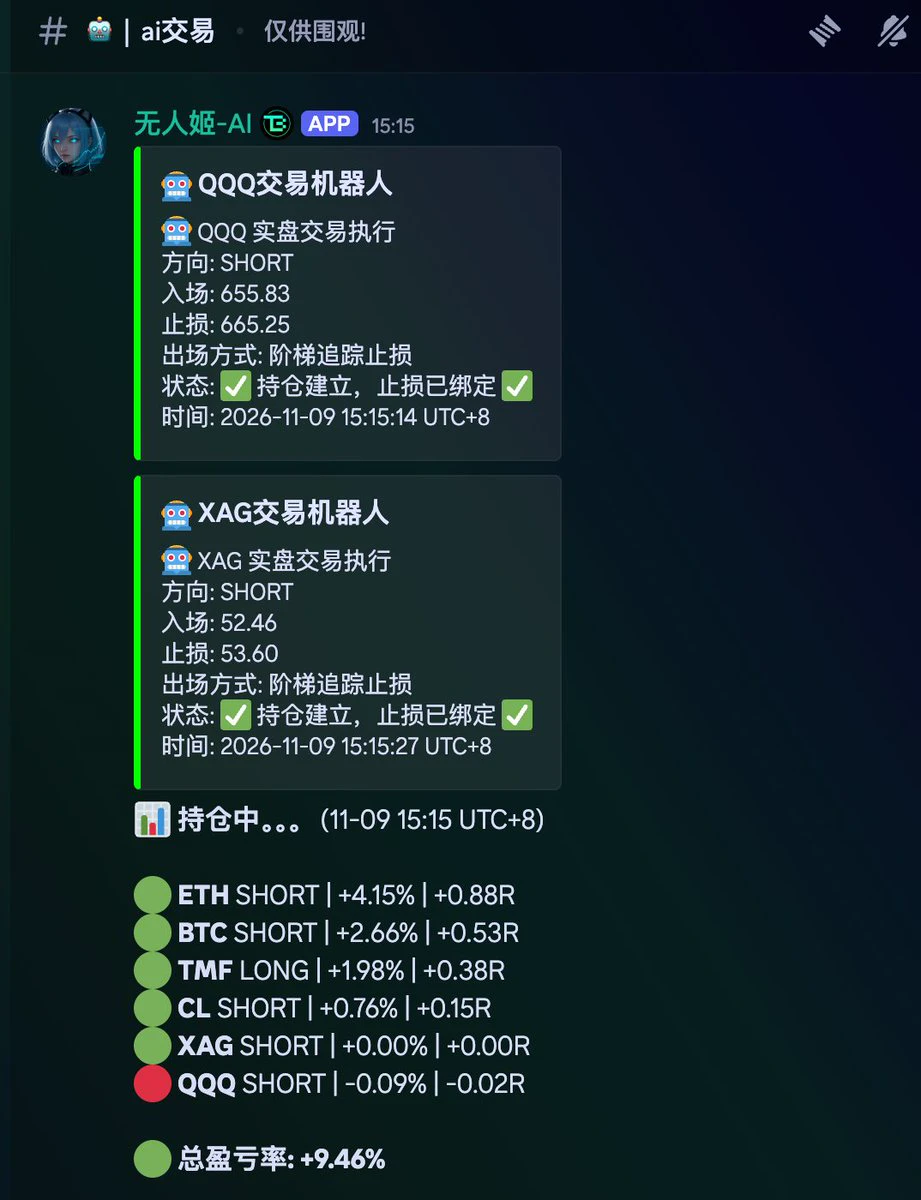
The bot that had been holding back for two days
Opened several orders in a row
post-image
Others are guessing, we're in control! $ETH
“The rebound volume can't keep up, and the moving averages are turning down—keep shorting.”

What does it mean to trade with the trend? What does volume-price analysis mean?
This is textbook-level harvesting! $GT

Here with Sister U, trading isn't about luck, but absolute skill and exceptional insight into the market. $XRP

Those who understand can keep going; those who don't can only kick themselves!
ETH-1.26%
GT-2.41%
XRP-1.12%
How Did the Account That Rode Musk Trends to a 3,200% Gain Win?
On-chain data shows that a deployer of a certain meme coin repeatedly launched tokens at just the right moments by capitalizing on Musk-related buzz, earning more than 3,200% in total.
This is a sophisticated attention-arbitrage playbook: trend → token launch → liquidity → sell-off. The entire process is repeatable.
Pricing power in the meme coin market is shifting from “who can shout the loudest” to “who can get ahead of the money flows”—from storytelling to on-chain data monitoring and launch timing.
Army Outlook:
In the future,
post-image
MEME-0.94%
A second bottom test, got 🥩 again
[Position Opening Analysis]:
$BTC Morning market watch: After a sharp drop, the market formed a pullback with a W-shaped structure. The upside breakout potential appears limited, while a second bottom test is more likely. A decisive break below 737-740 would make that range support for the second bottom. Market depth shows large short orders concentrated intraday, but they have not been fully released. The rise is judged to be a technical pullback. Long positions were closed for small profits. Overall, the view is to try a small short position. The second bo
BTC-0.65%
ETH-1.23%
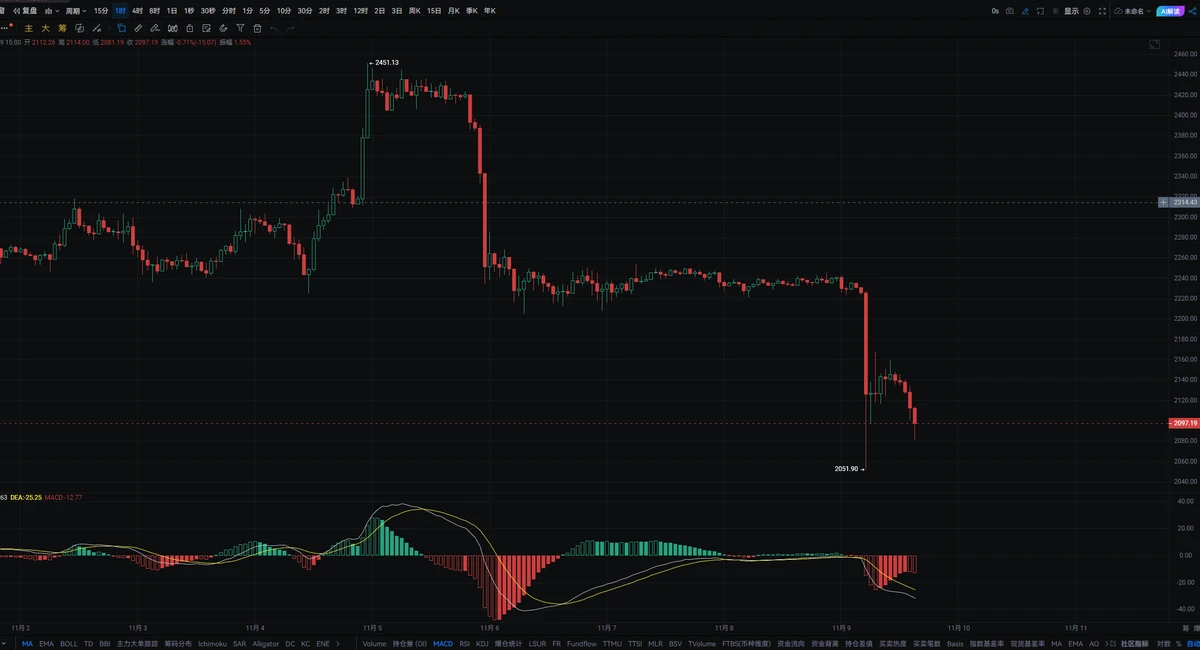
#ETH The current price is 2100, and price action continues to closely track BTC without making an independent move. It is now sitting at a key boundary between bullish and bearish territory, and the overall market setup is weak. The first resistance above is around 2170, where recent rebounds have repeatedly run into pressure. To reverse the weakness, ETH must break above this level on strong volume and hold there before it can make a further attempt at the strong resistance around 2250. The nearest support below is 2070, a key level for bulls to defend. If ETH falls below it alongside a BTC b
post-image
ETH-1.26%
BTC-0.67%
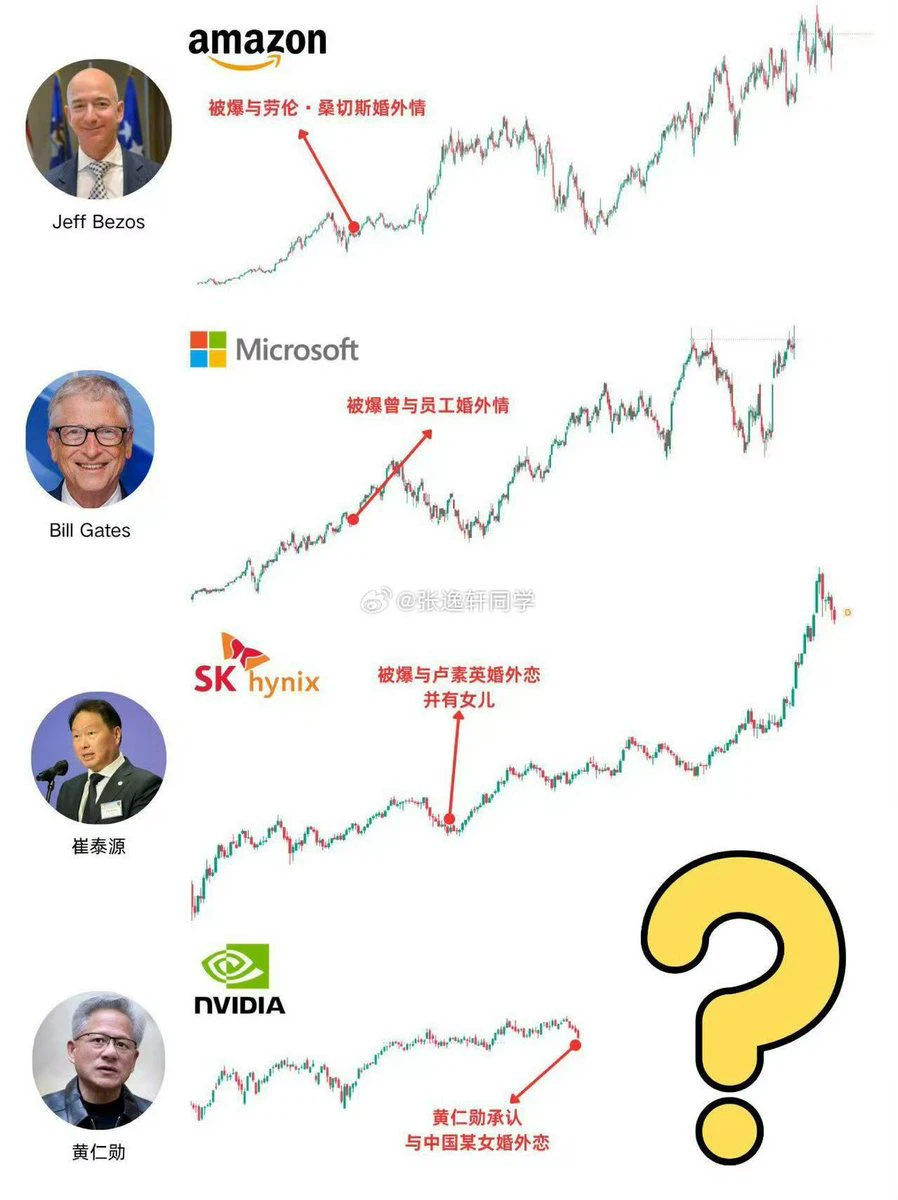
After Jensen Huang’s affair, where will Nvidia stock go from here?
post-image
NVDA+2.80%
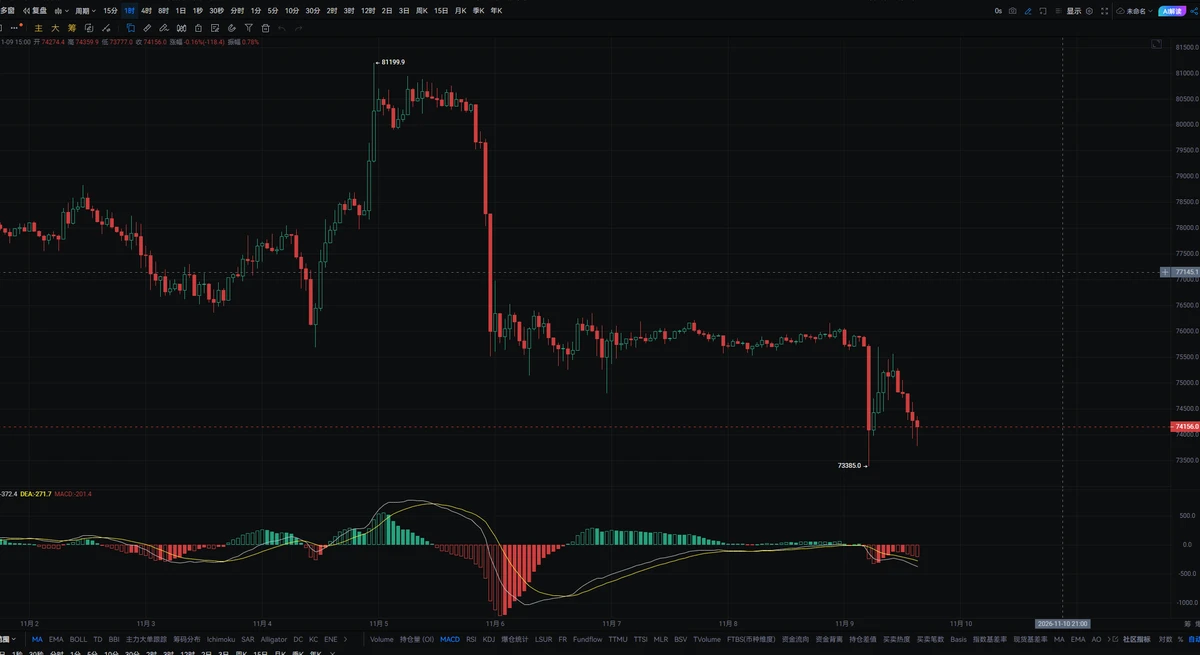
#BTC The current price is 74150, and the market remains in a relatively weak, choppy pattern, with prices sitting right near the recent support zone. The battle between bulls and bears is heating up. The first resistance above is around 75880. This level has capped prices several times before, and a rebound and recovery will need to hold above it to create room for a further move higher. Beyond that is a strong resistance zone around 77600. The nearest support below is 73980, which is the current dividing line. A high-volume break below it could trigger another wave of selling pressure, with 7
post-image
BTC-0.67%
After the breakdown, the bearish structure was confirmed. The rebound was merely a correction during the decline, not a reversal. Once the rebound met resistance, selling pressure continued to build, and the market extended its decline, validating the trend-based outlook.
post-image
XiaoXinBit
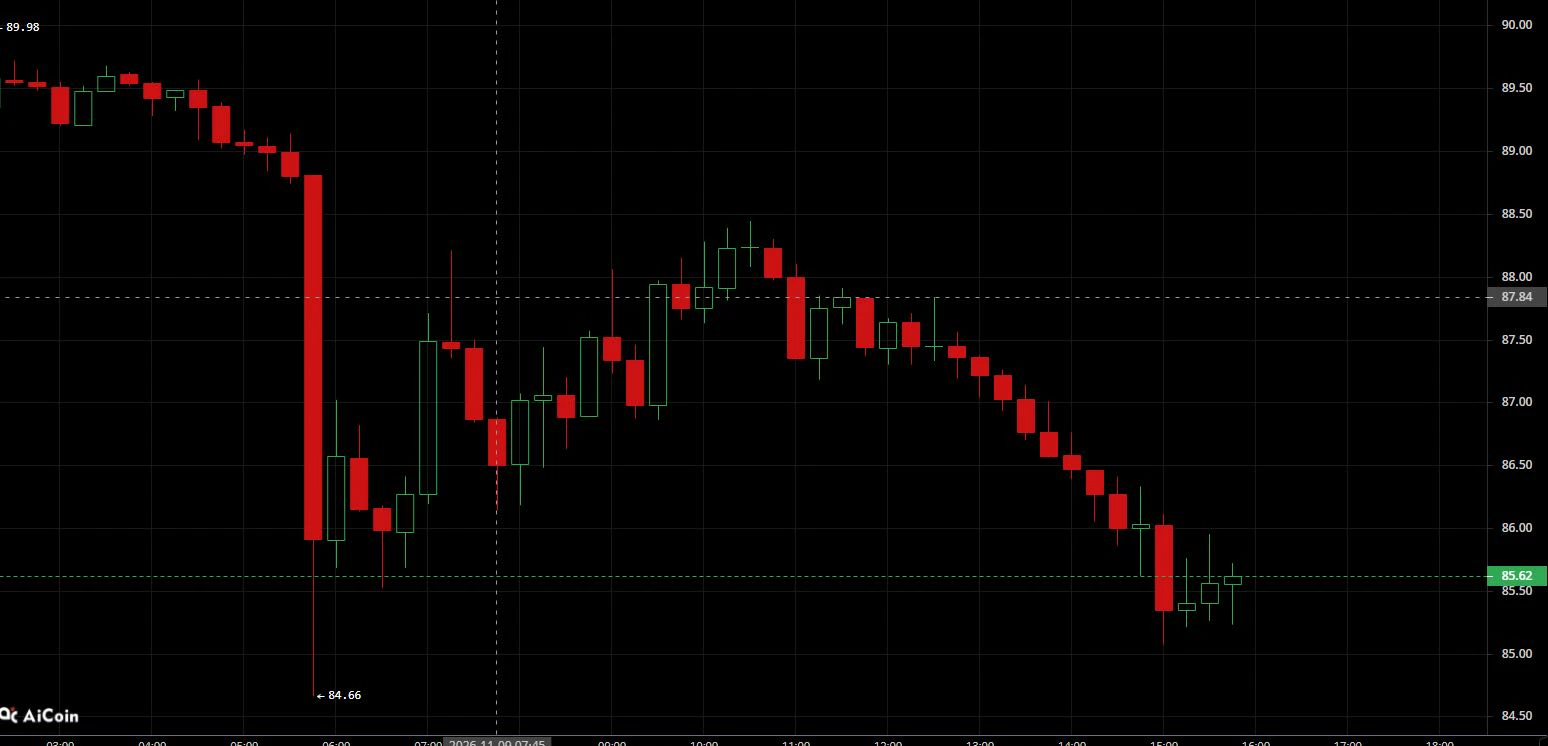
Xiaoxin | 11.9 Solana Strategy$SOL

Entry: Short near 87.6–87.8, with a stop-loss above 88.3. Watch for stabilization around 86.4–84.6 to try a long.

Trend breakdown: The previous high was 90.11. After consolidating near the highs, the market saw a sharp, high-volume drop and set a new low of 84.66. The previous trading range broke to the downside, shifting the short-term trend to bearish control. The current rebound from the low is an oversold recovery after a sharp drop, not a trend reversal.
Selling pressure at resistance: 87.60–87.80 is where the rebound from this decline is meeting resistance. Trapped positions accumulated in this area during the drop, so a rebound into this range could trigger selling pressure and cap gains.
Key level separating strength from weakness: 88.30 is the bears’ defense line. Only a high-volume move that holds above 88.30 would break the downtrend structure. Until then, all rebounds are considered countertrend bounces and opportunities to short at higher levels with the trend.
#70%山寨币跌破200日均线
Load More

Join 40 M users in our growing community

⚡️ Join 40 M users in the crypto craze discussion

💬 Engage with your favorite top creators

👍 See what interests you

Trending Topics

USCPIDataIncoming

30.01k Views1.86k Discussing

The U.S. October CPI report will be released on November 10 at 8:30 a.m. ET. September CPI came in at 3.7% year over year, and markets will be watching closely for signs that inflation is cooling, especially in core CPI. A softer-than-expected reading could strengthen rate-cut expectations, while hotter inflation may pressure risk assets through higher Treasury yields and a stronger dollar. How do you think this CPI print will move $BTC, U.S. stocks and gold?

RedBullDoublePodiumInBrazil

2.28k Views30.52k Discussing

BTCFlashCrash

86.66k Views66.26k Discussing

View More