Square
Following
Hot
News
Notifications
Profile
Share your thoughts
placeholder
Article
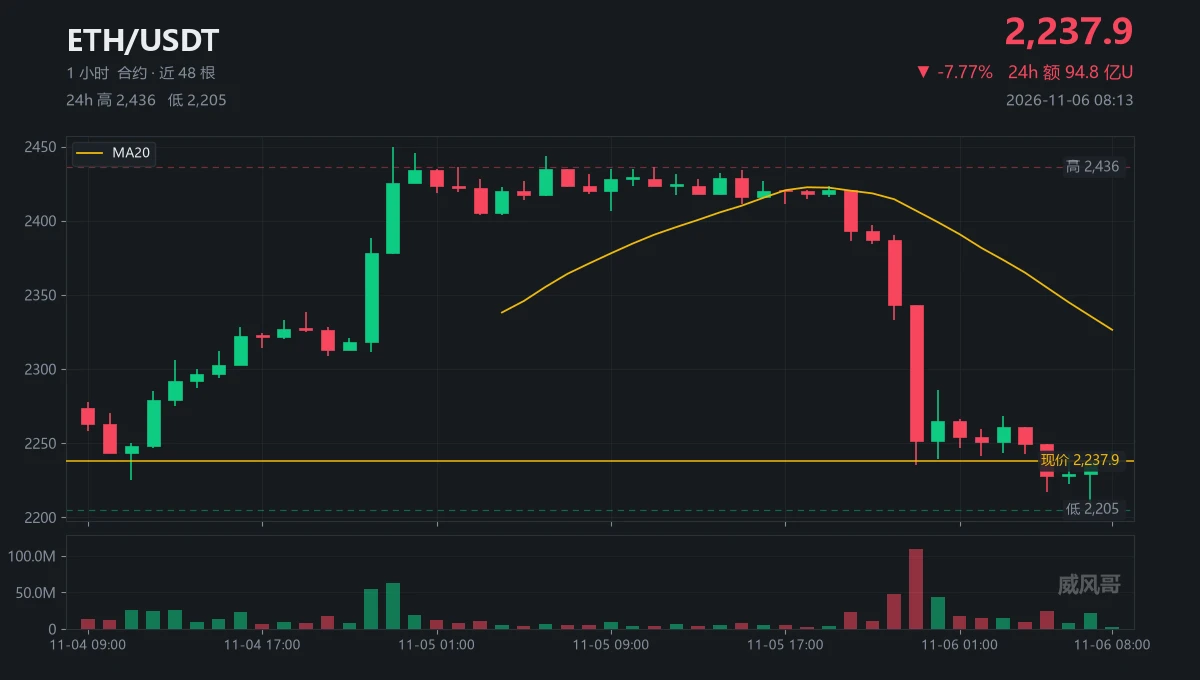
At 7:58 a.m., I went through all 48 hourly ETH candles from start to finish
My eyes were dry, and I never touched the keyboard
Someone asked: It’s down more than 7%—can we buy in?
I answered: First, let’s see how many times 2205.02 showed up today
They asked again: Isn’t that just one low?
I answered: At 07:00, it plunged to 2205.02 and closed at 2237. I got in, but only at 2237
They asked again: What about above?
I answered: 2251.4—the first gate for a rebound is wherever last night’s 23:00 candle closed
They asked: What if it can’t get above it?
I answered: If it can’t, keep looking lower; i
post-image
ETH-1.23%
  • 8
  • 2
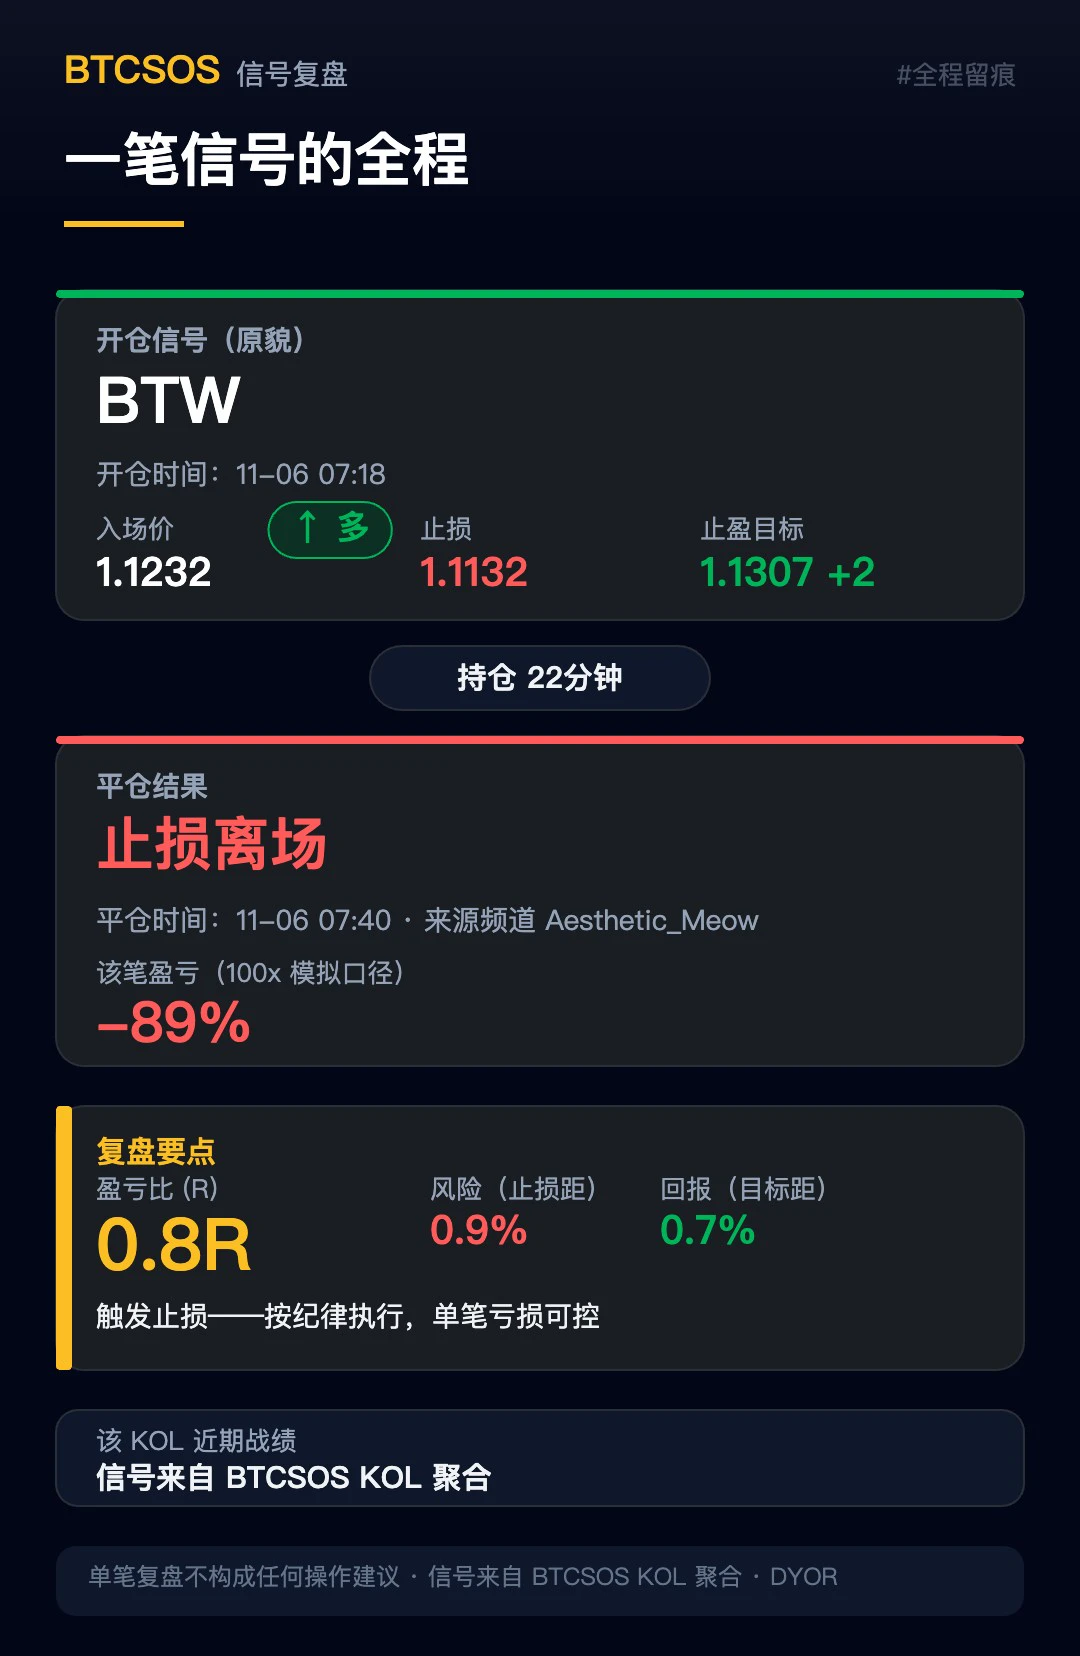
**Aesthetic_Meow · $BTW Long Position Recap 🛑**
Opened a long at 07:18 on 11-06, entry 1.1232, stop loss 1.1132, targets at 1.1307 / 1.1346.
So how did it go? 22 minutes later, at 07:40, the stop loss was triggered and the position exited immediately, for a -89% loss on a 100x simulated basis. This trade had a risk/reward ratio of about 0.8R (0.9% risk / 0.7% reward), which wasn’t great to begin with. The market didn’t cooperate, and that’s that.
Just saying: there’s no shame in losing. Exiting when the stop is hit instead of holding on—that execution gets a passing grade 💪. Only with contro
post-image
BTW-7.75%
ZEC+1.16%
Trenches
ZIG
Z
bade
b
ZIG
0x8c...1145
Market Cap
$.
Change
.
24h Vol
$.
Holders
.
BTC
B
bade
b
BTC
C5xp...pump
Market Cap
$.
Change
.
24h Vol
$.
Holders
.
CORLA
C
bade
b
CORLA
0xba...7777
Market Cap
$.
Change
.
24h Vol
$.
Holders
.
STONK
S
bade
b
STONK
6GmA...UNgx
Market Cap
$.
Change
.
24h Vol
$.
Holders
.
DESSA
D
bade
b
DESSA
npz2...pump
Market Cap
$.
Change
.
24h Vol
$.
Holders
.
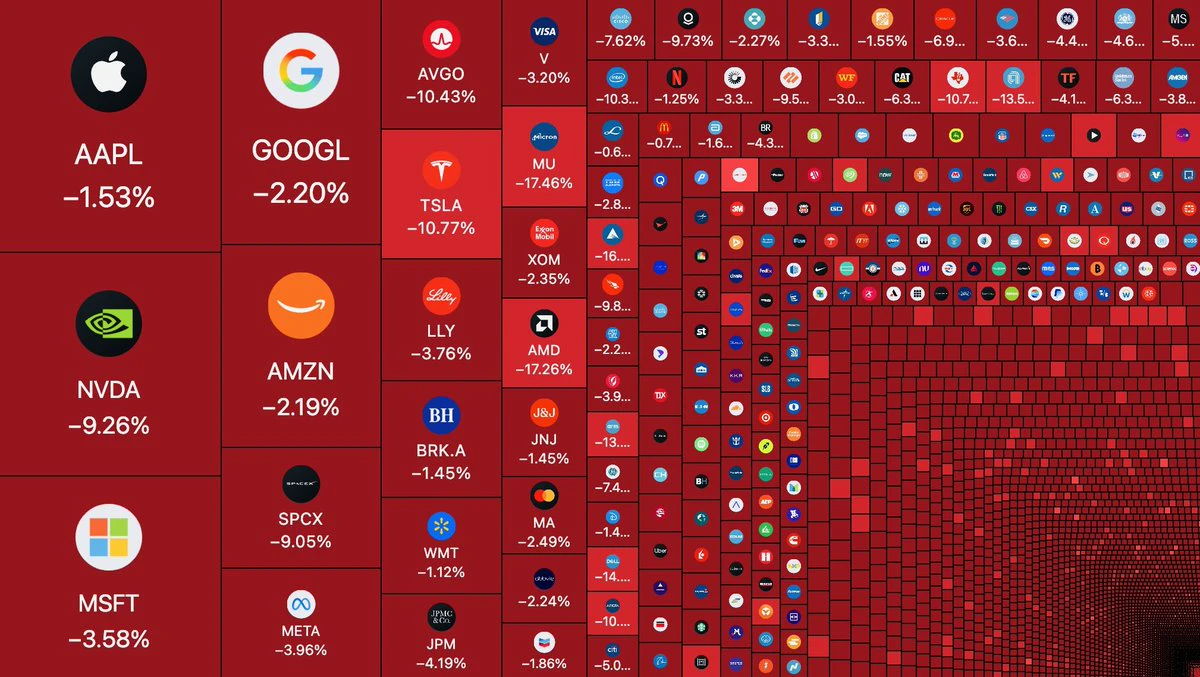
U.S. stocks lost $3 trillion in a single day.
The U.S. stock market just replayed last April’s tariff day.
The Nasdaq fell 5.52%, and the S&P 500 fell 4.36%—
their worst day since the tariff-fueled crash in April 2025.
The fear gauge, the VIX, surged 70% in a day to 28, its highest level since the Iran war began.
I hid out in U.S. stocks to avoid a market crash, only to find that U.S. stocks were the epicenter of one. Sorry, my crypto-native family 😭.
post-image
NAS100+1.19%
SPX+0.33%
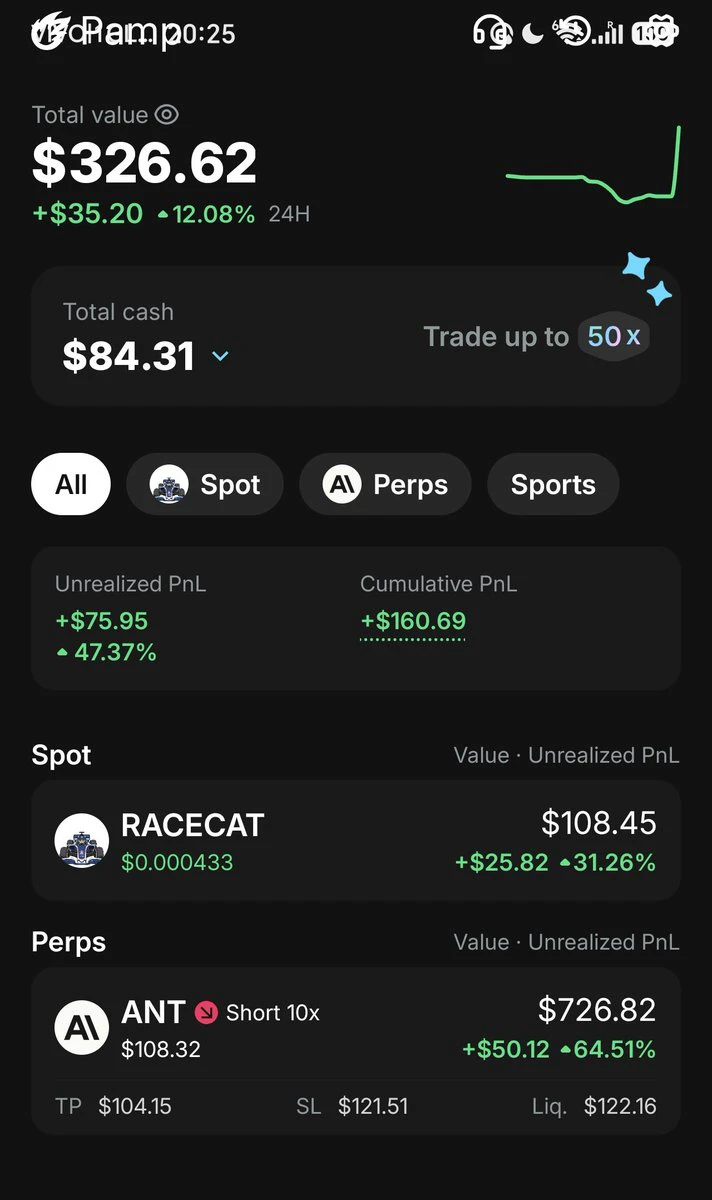
Shorted the newly added @AnthropicAI on @UltApp .
Opportunities everywhere
post-image
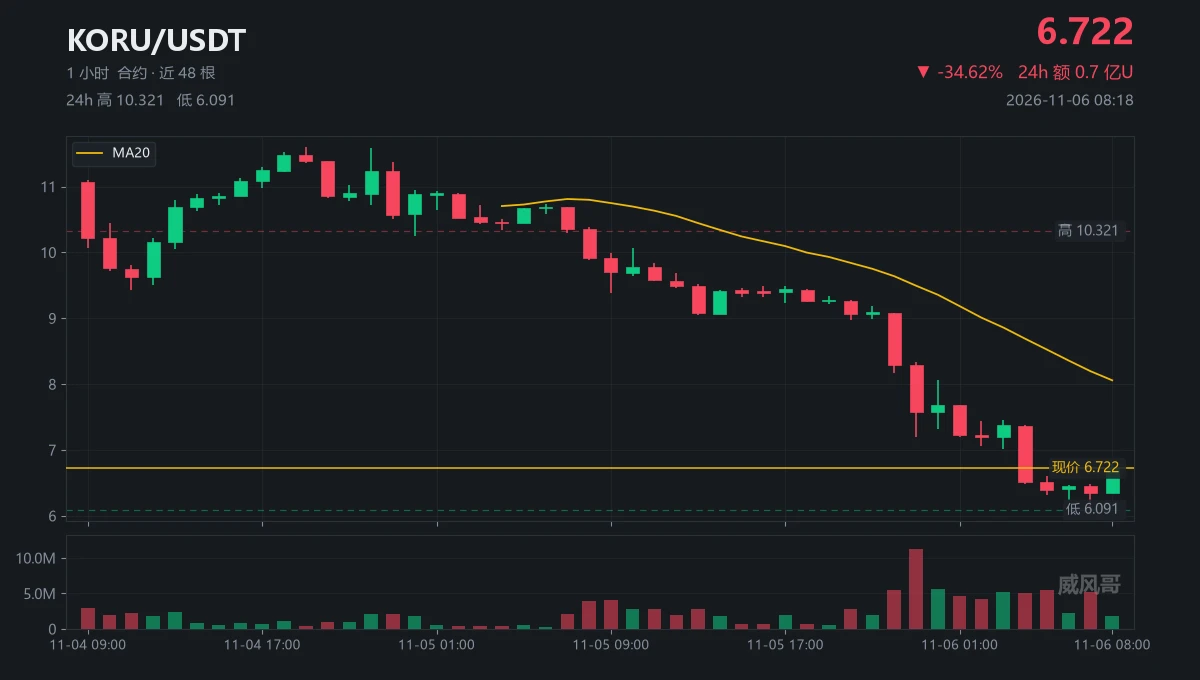
Veterans call three-times leveraged tokens elevators: one ride up, three rides down
I’m not touching this one; I’ll stand outside and run the numbers twice
Entry math: short again if the bounce fails at 7.19, stop-loss at 7.46, target 6.09
Risk-reward is 4 to 1 (looks like a giveaway, but I know it isn’t)
No-entry math: if 7.19 gets taken out, the next door is at 7.69
The most I miss out on is 0.5 points (I’ve made this trade before; losing looks worse than missing out)
In thirty-six hours, it plunged from 11.602 to 6.091, down 47.5 points—that’s a building coming down
Last night at 23:00, tha
post-image
KORU-1.22%
  • 12
  • 3
Anthropic’s AI Verification Tool Has a Costly Catch
FlashProve could help verify model computation, but its benchmark takes roughly 70 to 95 times the GPU work of ordinary inference.
Quick Take
⚠️ Personal market analysis only. NFA — manage risk and DYOR.
Educational content, not investment advice or a recommendation to buy, sell, deposit, or withdraw any asset. No paid promotion or referral/affiliate links.
post-image
Layout: Bitcoin, Ethereum, Dogecoin
live-cover
LIVE900
  • 1
Before crypto vs after crypto
before crypto vs after crypto
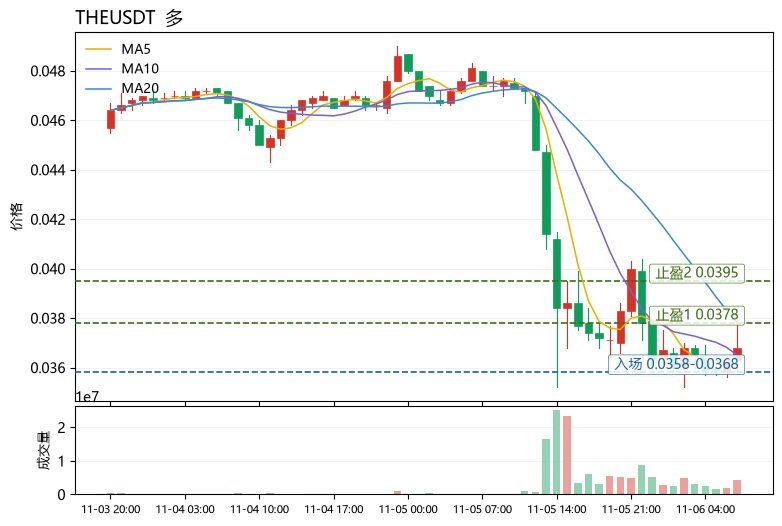
Chasing shorts after a sharp drop is one of the most common trading mistakes among retail traders—the price has already fallen 22%, and the RSI is often in a relatively weak zone by this point. Continuing to chase shorts can mean selling just as a rebound begins. $THE is currently showing exactly this structure: the current price is 0.0368 and has moved back above MA5=0.03628. Although it remains below MA20=0.037795, the short-term moving average is starting to flatten. The MACD histogram is +0.0001454; while the price has made a new low, the histogram has turned positive, suggesting the earl
post-image
HUMA-1.99%
#WCTCS9 #BTC
Bitcoin Market Analysis – November 2026 Update

Bitcoin is currently trading in the $75,800–$76,400 range after a sharp drop from levels above $80,000. As of the latest data around November 5–6, 2026, BTC sits near $76,000–$76,200, reflecting a decline of approximately 5% to 6% in a single session from highs near $80,800–$81,000. The 24-hour range has stretched from roughly $75,000–$75,600 lows to $80,800–$81,000 highs, with trading volumes elevated during the sell-off.

Market capitalization remains around $1.52–$1.53 trillion. Over the past week the move is roughly flat to mil
  • 2
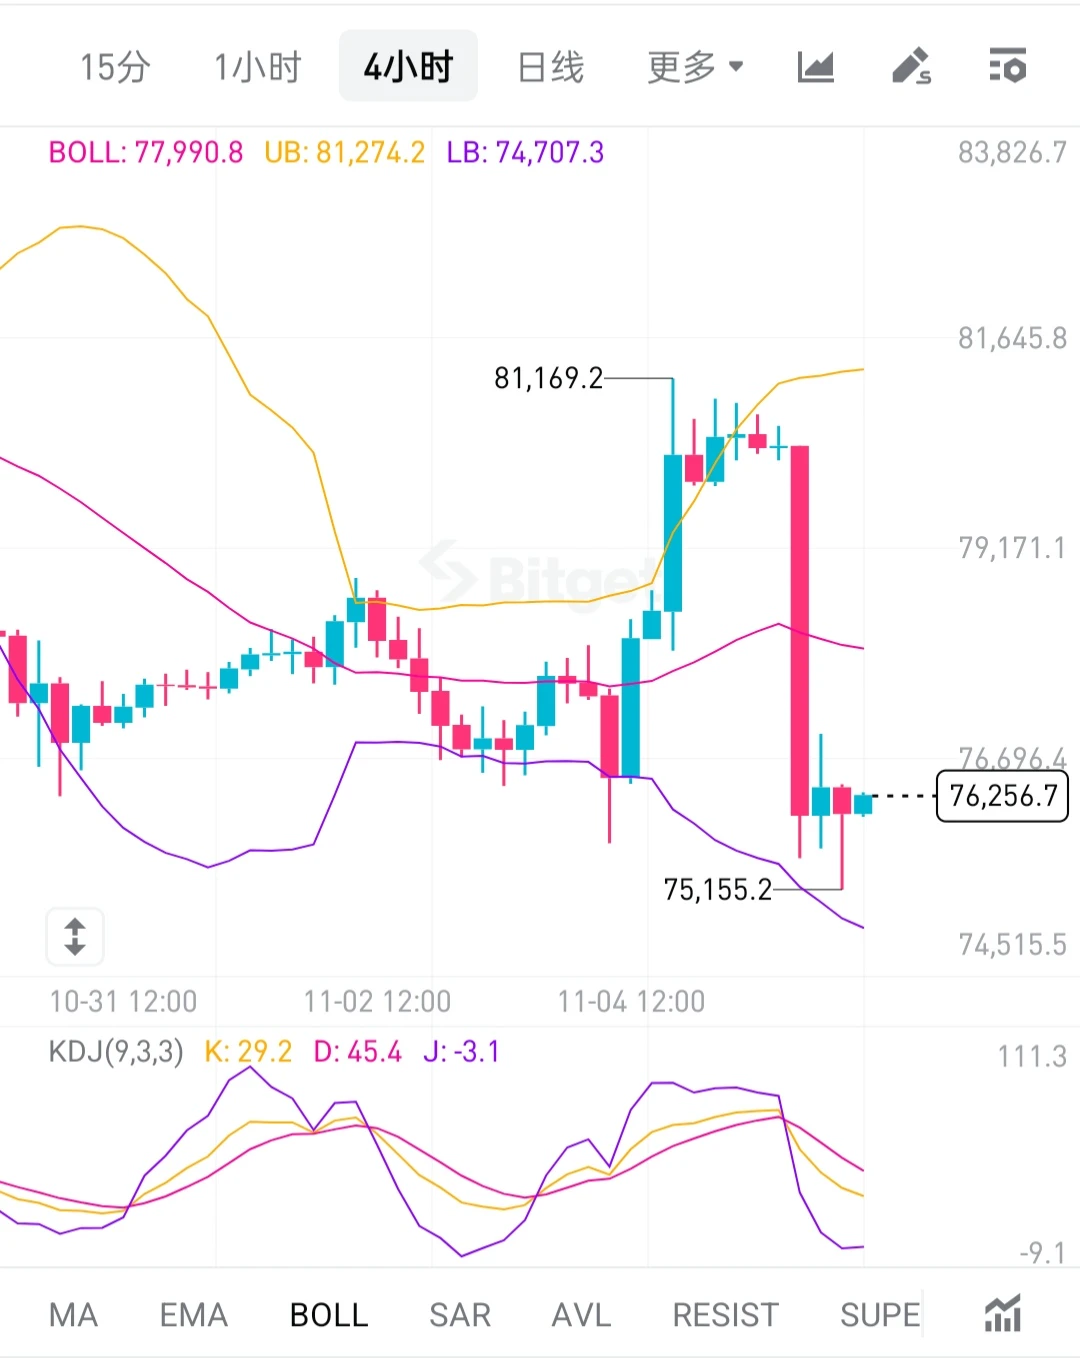
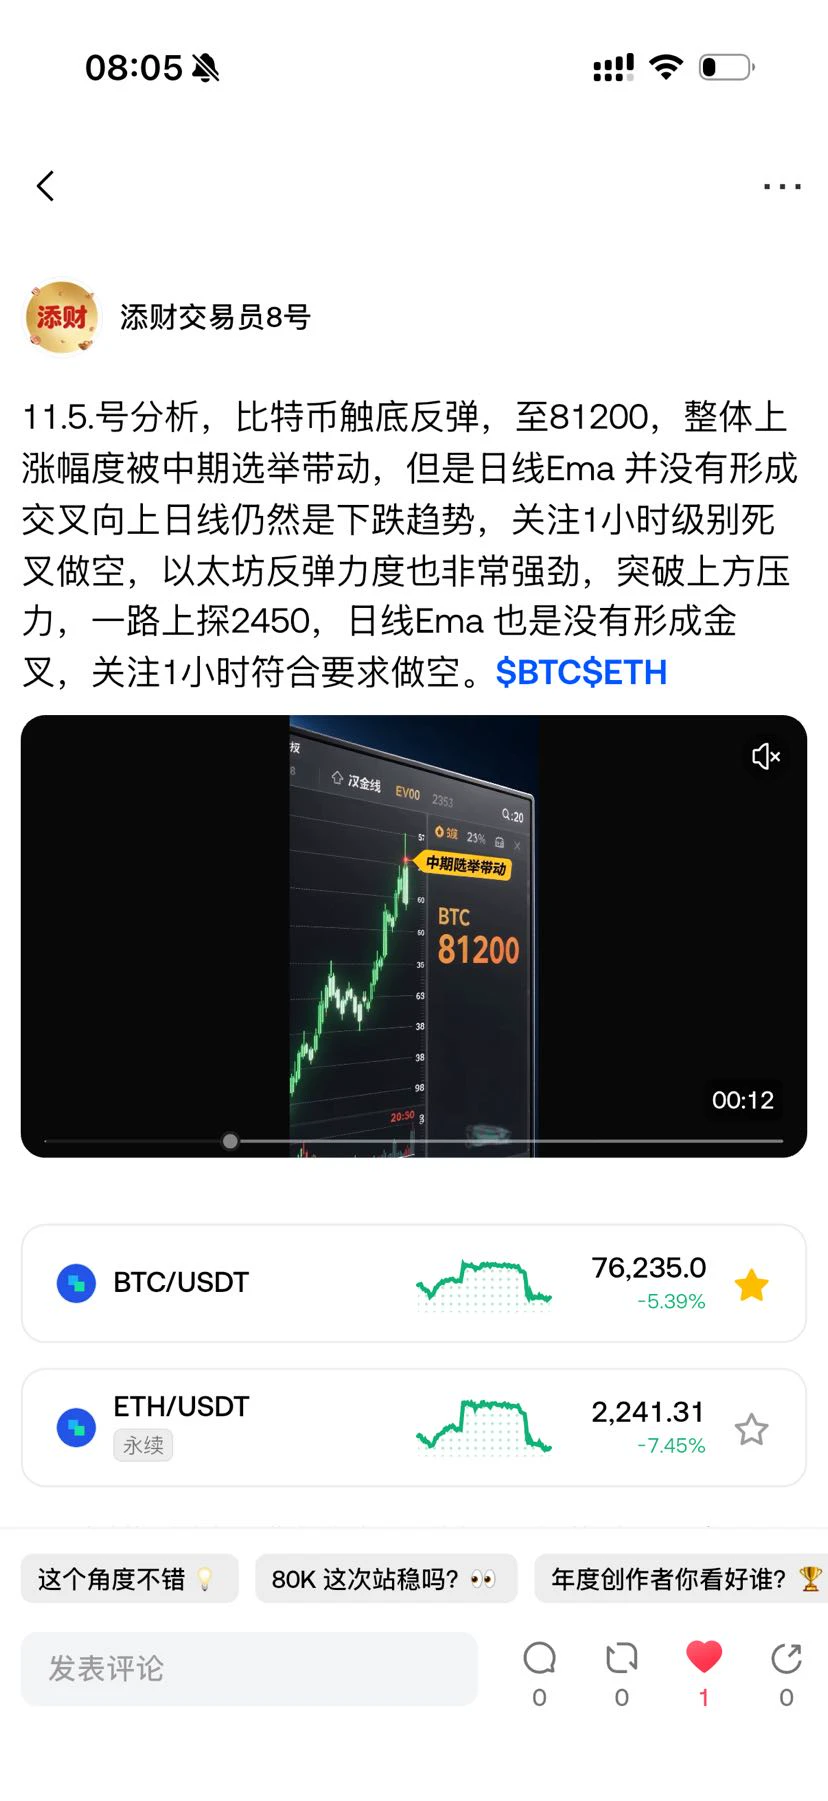
Bitcoin on 11/6:

On the 4-hour chart, the price surged to around 81170, met resistance, and pulled back. A large bearish candle broke through the Bollinger middle band, weakening the short-term trend. The price is now consolidating near the lower Bollinger Band. The KDJ J value has reached -3.1, entering oversold territory, so a short-term rebound may be due.

Watch the Bollinger middle band as short-term resistance and the recent low as support. After a bullish run, selling pressure has been released all at once. Oversold conditions can easily trigger a rebound, but the trend can only return
post-image
BTC-0.67%
New streamer bts market
live-cover
LIVE1,094
Stay in awe; be cautious, be cautious, and even more cautious
We’re here to make money, not to prove a point
Make sure to keep your emotions under control
post-image
  • 3
Exclusive Perks for New and Existing Users, Share $25,000 in SPCXG https://www.gate.com/campaigns/6724?ref=VLARBF1YAG&ref_type=132
post-image
SPCXG+0.22%
The short-selling strategy on November 5 was very clear. Even during last night's livestream, the view remained bearish and focused on shorting, $BTC $ETH
post-image
BTC-0.67%
ETH-1.23%
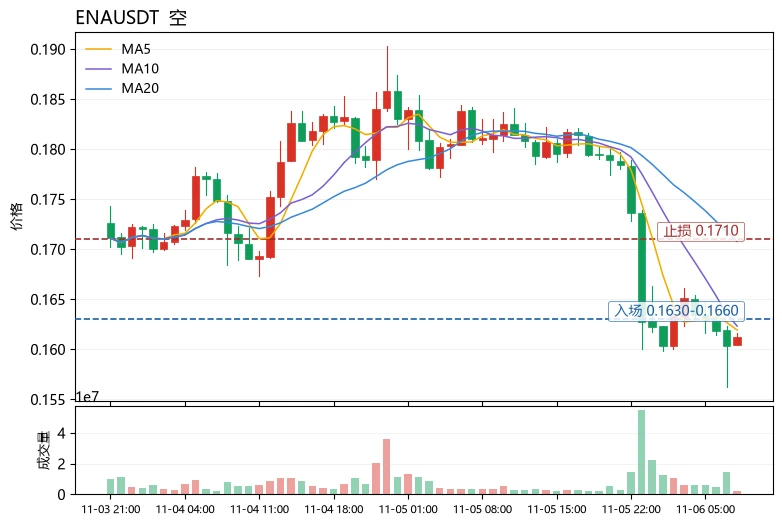
Fear & Greed Index at 28, with the market in the fear zone; $ENA is currently at 0.1612, down 10.94% in 24h, with a trading volume of 33.9M USDT. MA5=0.16192 is below MA20=0.170775, RSI=30.6 is nearing oversold territory, the MACD histogram at -0.0009821 remains bearish, and the Bollinger lower band is at 0.153481. With the broader market weak and the sector broadly declining, funds are unlikely to flow back into altcoins before BTC stabilizes. ENA remains under moving-average pressure in the short term, but its price is near the Bollinger lower band and RSI is close to 30, creating potential
post-image
SPCXB
SPCXBSpaceX
Four.meme
MC:$3.12KHolders:2
0%
ENA+8.04%
#GateLaunchesPoSECProofOfSecurity
Gate Introduces PoSEC: Taking Crypto Security and Transparency to the Next Level
Security and transparency are two of the most important foundations of the cryptocurrency industry. As more people enter the digital asset market, they need confidence that their funds are properly managed, stored and protected.

This is why I appreciate Gate's introduction of Proof of Security (PoSEC). In my opinion, this is an important step toward making exchange security more transparent and measurable.

Gate is showing that protecting customer assets is not only about mainta
BTC-0.67%
ETH-1.26%
GT-2.41%
DOGE-0.22%
SOL-0.77%
$FIL The massive faucet that had been running for six years has finally been shut off completely. The amount of tokens flowing into the market each day has been cut by three quarters. With supply tightening, the market responded immediately: when the price retested 0.85, trading volume fell noticeably, and the price simply wouldn’t go lower. Shorts desperately tried to push it down but couldn’t shake out much supply. In the past, even a slight sell-off was like opening the floodgates; now, a drop barely makes a ripple. The circulating spot supply at the bottom had already been almost completel
post-image
FIL-2.00%
$TRUMP Those 200-plus whale shorts in the futures market are basically taking punches to the face now.

The funding rate has plunged to -80%, so short sellers wake up every day and have to pay interest just to hold on. This market has long been tightly controlled, and there’s practically no selling pressure on the spot side.
Their entry prices are all clustered around 1.83. It would only take a small spark to push the price to that level. The forced buy orders from more than 200 traders getting liquidated in succession would instantly take over the market, and the market maker wouldn’t even ne
post-image
TRUMP-0.90%
#黄金突破4100美元 #WCTCS9 $4,100 reclaimed, then lost again; bulls and bears await one result before nonfarm payrolls

In early Asian trading, gold was range-bound near $4,097, with last night's pullback after a sharp rally leaving the suspense for tonight.
Spot gold briefly hit a two-week high of $4,147 during Thursday's US session, then retreated as the sell-off in US stocks intensified, eventually closing at $4,088.33, with gains narrowing to 0.69%. Early today, gold repeatedly swung between $4,085 and $4,100,
reclaiming $4,100 only to lose it again, as neither bulls nor bears dare to make a move
XAUUSD-0.02%
  • 5
Load More

Join 40 M users in our growing community

⚡️ Join 40 M users in the crypto craze discussion

💬 Engage with your favorite top creators

👍 See what interests you

Trending Topics

GateLaunchesPoSECProofOfSecurity

10.07k Views551 Discussing

Beyond Proof of Reserves, Gate has introduced PoSEC, a new Proof of Security framework focused on how user assets are stored and protected. By disclosing the distribution of assets across cold storage and hot wallets, users can directly understand Gate’s storage structure and risk coverage under extreme scenarios. Gate’s latest cold storage coverage ratio stands at 104.58%, meaning cold-storage assets alone are sufficient to cover all user assets. PoR verifies whether reserves are sufficient, while PoSEC shows how assets are stored and how risks are covered — together forming a more complete asset security framework. Share your results and experience! [👉 Learn more](https://gate.com/proof-of-security)

BTCBackAbove80K

156.78k Views41.63k Discussing

DemocratsWinBothChambers

32.96k Views550 Discussing

View More