Square
Following
Hot
News
Notifications
Profile
Share your thoughts
placeholder
Article
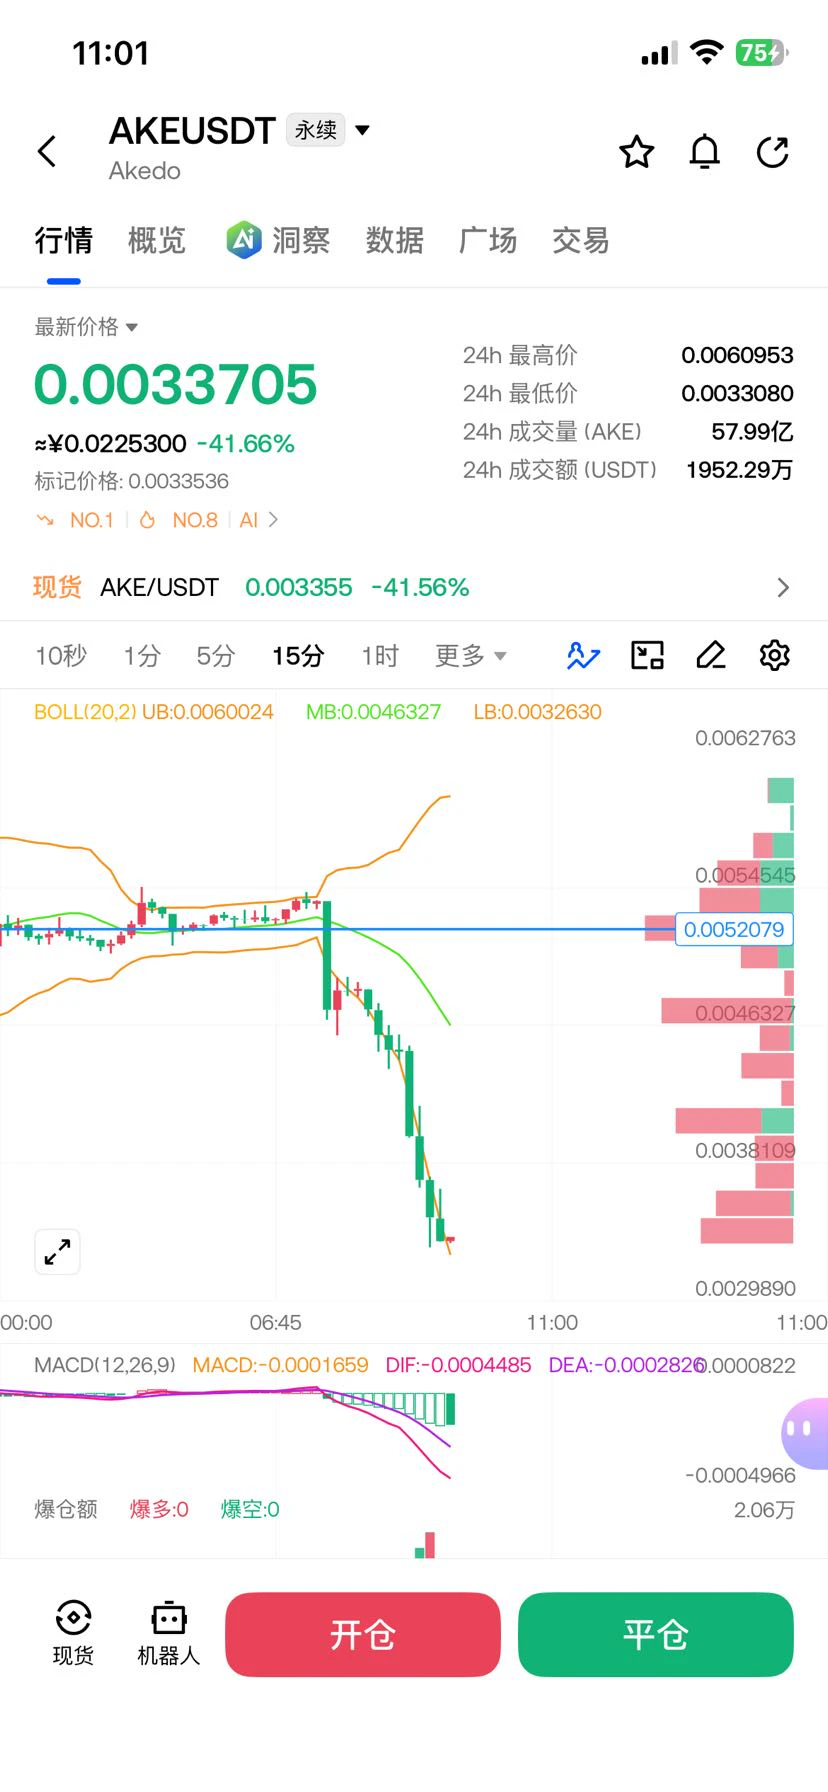
$AKE These people who secretly engineer market dumps make more money
AKE+6.07%
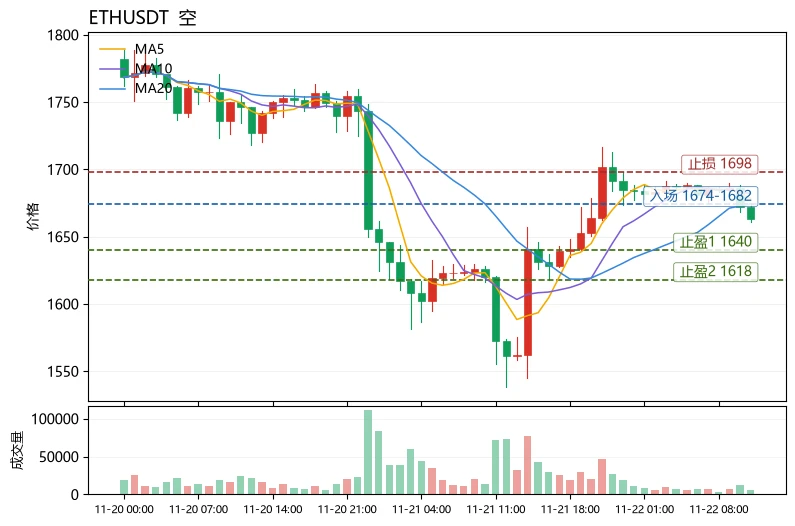
$ETH Current price 1663.24, 24h +3.34%, trading volume 957.8M USDT. In terms of moving averages, MA5=1678.41 remains above MA20=1674.33, but the price has fallen below both lines; short-term averages are flattening and the bullish alignment is weakening. The MACD histogram at -0.03976 is in bearish territory, with weak momentum. RSI=46.1 is in the neutral-to-weak range and has not reached oversold levels. The Bollinger Bands are [1635.6, 1713.07], with the current price tracking near the lower band and bandwidth at around 4.7%; the 30-candle amplitude is 10.74%, indicating weak consolidation
post-image
DODO+11.43%
BNB-0.76%
Trenches
IDOL
I
bade
b
IDOL
0x3b...ab07
Market Cap
$.
Change
.
24h Vol
$.
Holders
.
JAGENT
J
bade
b
JAGENT
0x8e...ae15
Market Cap
$.
Change
.
24h Vol
$.
Holders
.
PIEVERSE
P
bade
b
PIEVERSE
0x0e...25a9
Market Cap
$.
Change
.
24h Vol
$.
Holders
.
FIONA
F
bade
b
FIONA
B34n...pump
Market Cap
$.
Change
.
24h Vol
$.
Holders
.
CLAUDIA
C
bade
b
CLAUDIA
2j5S...W2ZM
Market Cap
$.
Change
.
24h Vol
$.
Holders
.
$MAGMA There is strong resistance above, and it's time to sell and open a short position 📉
post-image
MAGMA-0.57%
$IDOL It’s fallen so much—buy the dip, buy the dip! Let’s go for it and see if we can strike it rich?
IDOL-6.71%
#下周PCE与GDP数据将揭晓 #美联储理事库克支持进一步加息 #ARK申请撤回两只加密指数ETF There’s no oversight from the relevant authorities for fraud now. Listing tokens is just a scam money-printing machine
post-image
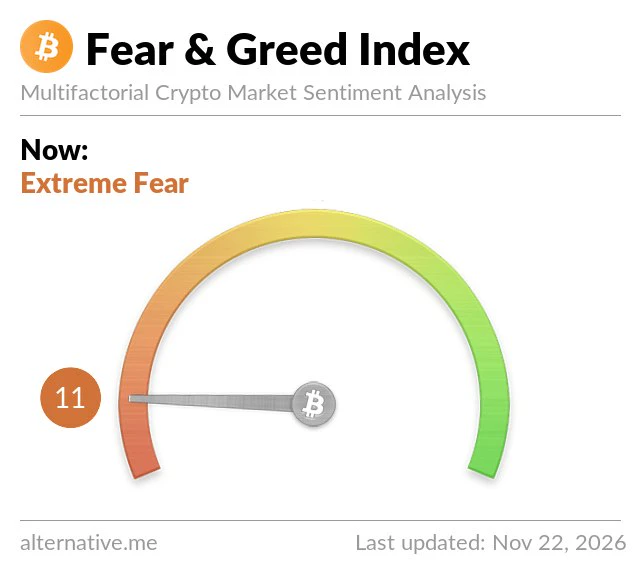
𝗕𝗜𝗧𝗖𝗢𝗜𝗡 𝗦𝗘𝗡𝗧𝗜𝗠𝗘𝗡𝗧 𝗛𝗜𝗧𝗦 𝗘𝗫𝗧𝗥𝗘𝗠𝗘 𝗙𝗘𝗔𝗥
$BTC Price: $60,224
Fear & Greed Index: 11
Market Sentiment: Extreme Fear

Crypto market sentiment remains deeply negative as the Fear & Greed Index drops to 11.

Extreme fear reflects uncertainty, caution, and reduced confidence among market participants. Bitcoin is trading around $60,224, keeping traders focused on whether buyers can defend current levels.

Historically, extreme fear can create opportunities, but it does not guarantee an immediate market recovery.

Market Focus: Watch Bitcoin's price stability, trading volum
post-image
BTC-0.65%
#ThreeLaunchpoolProjectsNowLive 🚀 Three Launchpool Projects Now Live on Gate – New Opportunities to Earn Crypto Rewards!

The crypto ecosystem continues to expand, and Gate is bringing users another exciting opportunity with three Launchpool projects running simultaneously! This latest development highlights Gate's continued commitment to supporting emerging blockchain projects, expanding staking opportunities, and providing users with more ways to participate in the growing digital asset market.

With three different projects available, users can explore multiple reward pools and choose oppo
post-image
VLX+0.00%
BTC-0.67%
ETH-1.26%
GT-2.41%
I saw a meme and it killed me
Found the reason for this downturn
Turns out it’s GTA 6
Every time GTA comes out, the economy is bad
’97 Asian financial crisis, ’08 financial crisis
’13 European debt crisis, and now 2026 is another streak of declines
Hahahaha
post-image
🔹Crypto Fear and Greed Index drops to 11, market sentiment plunges to freezing point.
live-cover
LIVE1,713
NVDA-13.84%
TSLA-7.56%
SPCX-7.38%
MU-13.88%
SNDK-15.99%
Closed profit $ETH $EVAA $BTC HOT if you follow my system every day
Super high win rate: 4 wins, 0 losses
Do you want to join TF Premium Signal?
post-image
EVAA-0.49%
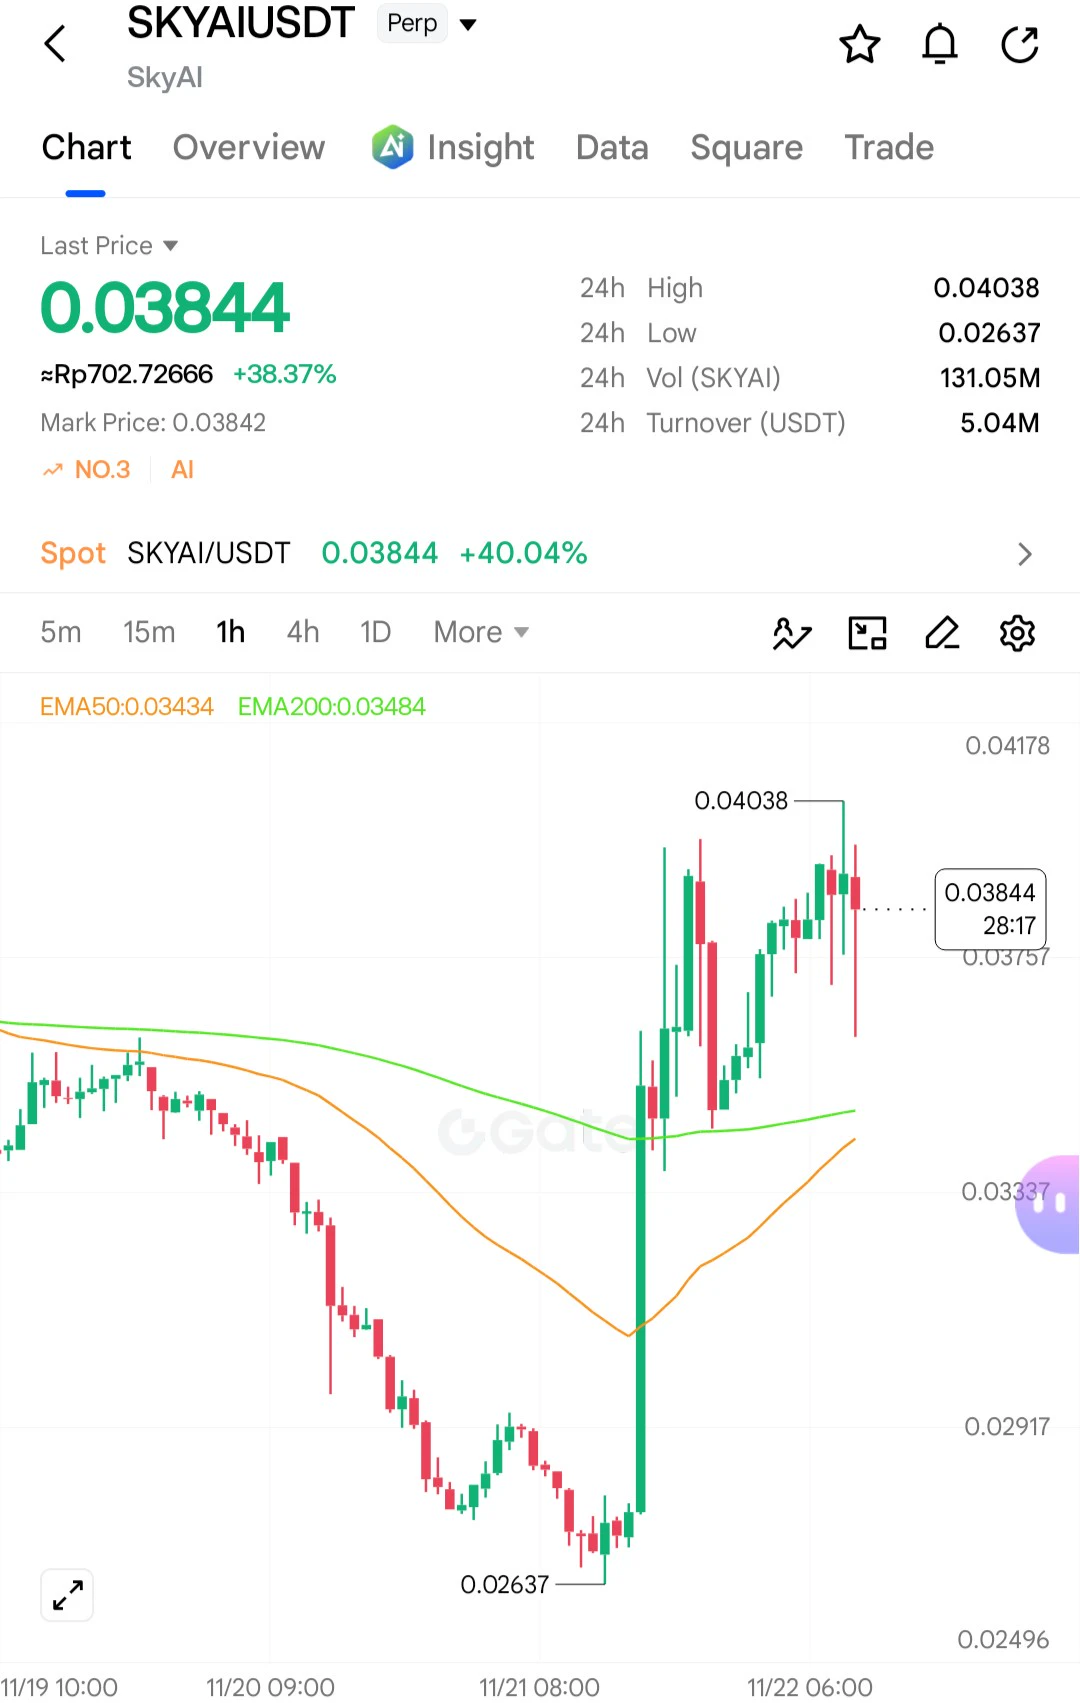
SKYAI has rebounded again over these past 2 days; perhaps the Market Makers and whales are preparing fuel to go to the moon.
$SKYAI ‌$AKE ‌
post-image
SKYAI-7.69%
AKE+6.39%
Join the Gate 2026 Annual Gala: register to get 100 boost points and vote for your favorite stars of the year. For every 100 boost points you use, you get 1 draw chance(s) for a shot at surprise prizes. https://www.gate.com/competition/Annual-Gala?ref_type=165&ch=9940&ref=BVVEVQ9c
post-image
A brief analysis of BTC’s short-term trend using Dow Theory, Chan Theory, Elliott Wave Theory, volume-price relationships, order flow, and price action (strategy recommendations)
综合研判
Dow Theory confirms 55,130 as the ultimate abyss, followed by a strong rebound after 13 successive lower lows
Chan Theory: A bottom fractal is emerging at 55,130, pending confirmation
Elliott Wave Theory: Wave C’s fifth subwave ③ hit the 4.236× target of 55,479 (actual low: 55,130); a subwave ④ rebound may be starting
Volume-price relationship: Nov 21 capitulation with a high-volume candle and long lower wick = c
BTC-0.67%
$SUI 0.6379, up 6.25% over 24H. It’s climbing fast, but the 1h/4h trend is still weak, volume is only 0.5x average, and RSI is still near oversold. 0.6551 above is the 24H high; don’t expect it to hold without a volume surge. 0.5882 below is the real support—if it breaks, the short-term momentum will be completely disrupted. Keep an eye on these two levels and wait for the market to pick a direction. Not investment advice.
#SUI #Sui
post-image
SUI-1.05%
MARKIT UPDATE
live-cover
LIVE1,688
DOGE-0.22%
BTC-0.67%
ETH-1.26%
USDC+0.01%
SOL-0.77%
My wife made plans with a friend to go buy gold this afternoon
post-image
GLDX-0.40%
PAXG+0.37%
  • 1
  • 1
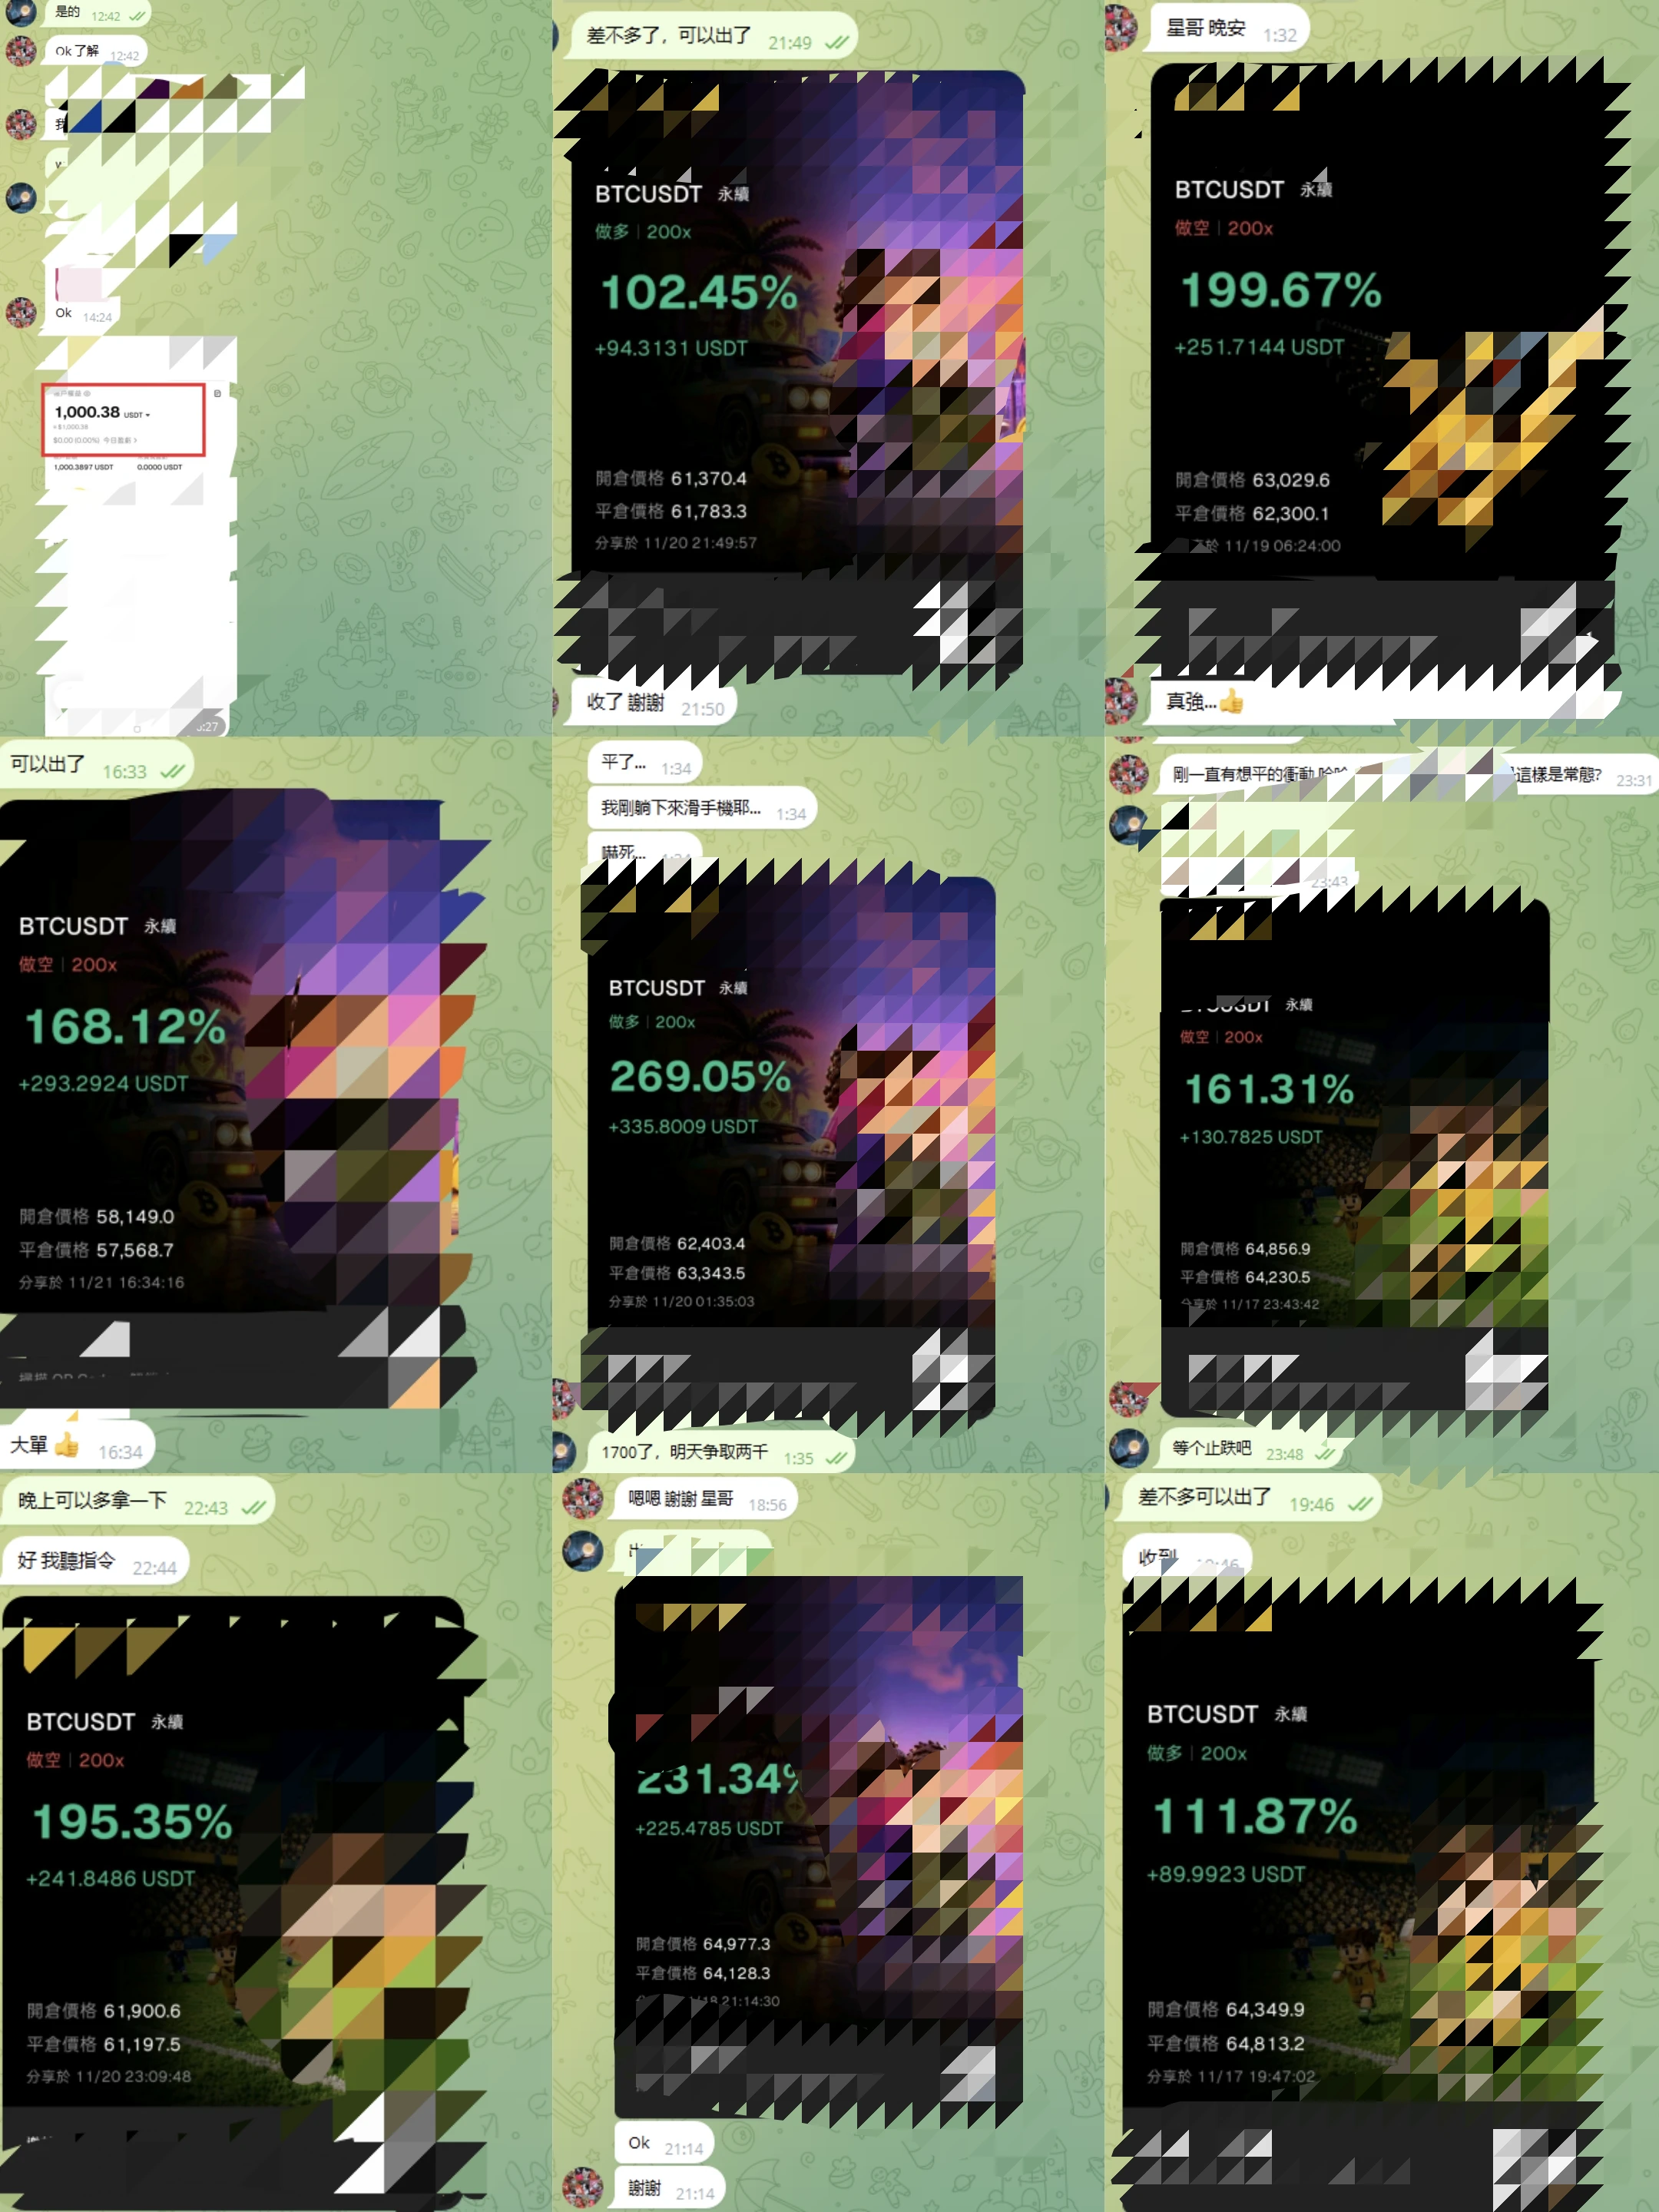
In the sharp sell-off, some held losing positions until liquidation, while others followed the strategy and seized opportunities!

The market has been tough lately, with consecutive declines and sharp wicks in both directions. Many people have lost money, and some even held on until they were liquidated.

But during this period, Xing still doubled his account. Starting with just over 1,000 in capital, he doubled his account returns in less than a week.

I’ve compiled the live trading records from the past few days, covering both shorts and longs, with every entry and exit documented.

Actually
post-image
BTC-0.65%
ETH-1.23%
SOL-0.74%
The current ETH/USDT market presents a complex picture when combining on-chain metrics with technical price action.

According to Coinglass data, the order books show a stark asymmetry. There is a large bid concentration near 1650 dollars acting as local support, but significant sell orders are stacked at 1700, 1800, and 1900 dollars. This creates a major barrier for upward movement. Liquidation maps indicate that a move above 1841 dollars could trigger short liquidations, while a drop below 1668 dollars threatens long positions. The funding rate is negative, pointing to bearish sentiment, yet
ETH-1.26%
$NVDA ‌🔷️ NVDA Structural Breakdown: Navigating Liquidity Pools for a High-Probability Reversal

Current Market Situation

NVIDIA (NVDA) is currently experiencing a significant corrective phase, trading at $130.01 after failing to sustain its previous highs. The market structure has shifted bearish in the short term, evidenced by the price trading below all major moving averages (MA5 through MA500) on both the 1-hour and 4-hour timeframes. The MACD on both charts is deeply in negative territory, confirming strong selling momentum. However, the asset has just tapped a critical demand zone nea
NVDA-13.84%
  • 2
Load More

Join 40 M users in our growing community

⚡️ Join 40 M users in the crypto craze discussion

💬 Engage with your favorite top creators

👍 See what interests you

Trending Topics

BTCReboundFaces60KTest

2.1M Views30.1K Discussing

BTC rebounded from around $55,300 on November 21, briefly reclaiming $60,000 before pulling back to around $59,300. The $60K level is back in focus as traders assess whether the recovery can last. Is this rebound a sign of stabilization or a short-lived recovery? Would reclaiming and holding $60K be enough, or do you need confirmation from trading volume and fund flows?

PCEAndGDPDataNextWeek

257.8K Views2.6K Discussing

GateDirectIPOPhase3ANTAllocates92100Shares

811.6K Views5K Discussing

View More