ForestCrypto

vip
Peak Tier 0
Crypto Market Researcher
Airdrop Hunter
Crypto Trader | Market Analysis | Live Trading
Pin
#GateStreamers
Gate.io Pakistani Top Streamers
The Pakistani Gate.io streaming community continues to grow with talented creators bringing different styles, personalities, and perspectives to the crypto space. Today, I want to highlight five unique profiles that represent this growing community:
Dragon Fly Offical
A distinctive profile with a powerful dragon-inspired identity, representing strength, focus, and a fearless approach to the crypto world. The visual identity gives Dragon Fly 2 a memorable presence among the Gate.io streaming community.
2In1
A modern and energetic identity built a
post-image
  • 6
  • 2
BTC Update
live-replay-cover
402 views09-21 16:03
00:35:19
Market Update For Today
live-replay-cover
455 views09-21 14:15
00:32:56
📺 What to watch this week? The Gate Live schedule has been updated!
This week’s popular livestreams are all set! Different guests and perspectives to help you track market trends, hot sectors, and market opportunities 👉 https://www.gate.com/live
💡 Open the Gate APP and search for “Gate Live” to book in advance and receive an automatic reminder when the stream starts.
📢 What would you like to watch next week?
BTC / ETH, altcoins, US stocks, gold, macro, or a specific host? Tell us in the comments~
BTC+7.19%
ETH+5.54%
  • 7
🚀 BTC breaks above $84,000, with market enthusiasm continuing to heat up
BTC briefly broke above $84,000, rising approximately 4.6% in 24H to reach a new high since the end of January 🔥
From the price breakout to the recovery in trading sentiment, BTC has once again become the market focus.
Next, whether 84K can hold, whether 86K can be broken again, and whether 90K will become the next target are all worth watching.
📈 Watch the trend: After breaking above 84K, how much further upside is there?
💰 Watch the funds: Can ETF inflows continue to provide support?
🔥 Watch the sentiment: Will the
GateSquare
🚀 BTC breaks above $84,000, with market enthusiasm continuing to heat up
BTC briefly broke above $84,000, rising approximately 4.6% in 24H to reach a new high since the end of January 🔥
From the price breakout to the recovery in trading sentiment, BTC has once again become the market focus.
Next, whether 84K can hold, whether 86K can be broken again, and whether 90K will become the next target are all worth watching.
📈 Watch the trend: After breaking above 84K, how much further upside is there?
💰 Watch the funds: Can ETF inflows continue to provide support?
🔥 Watch the sentiment: Will the recovery in market activity attract more capital?
🎯 Watch the target: If 86K is broken again, will you start looking toward 90K?
Vote:
Bring #BTC突破84000美元 to Gate Square to share your market outlook, trading ideas, or holding plans.
✨ High-quality content may also receive 3 days of Gate Square traffic support, giving more people the chance to see your valuable insights.
👉 https://www.gate.com/post.
BTC+7.19%
  • 7
  • 1
#DOGELong
#DOGE
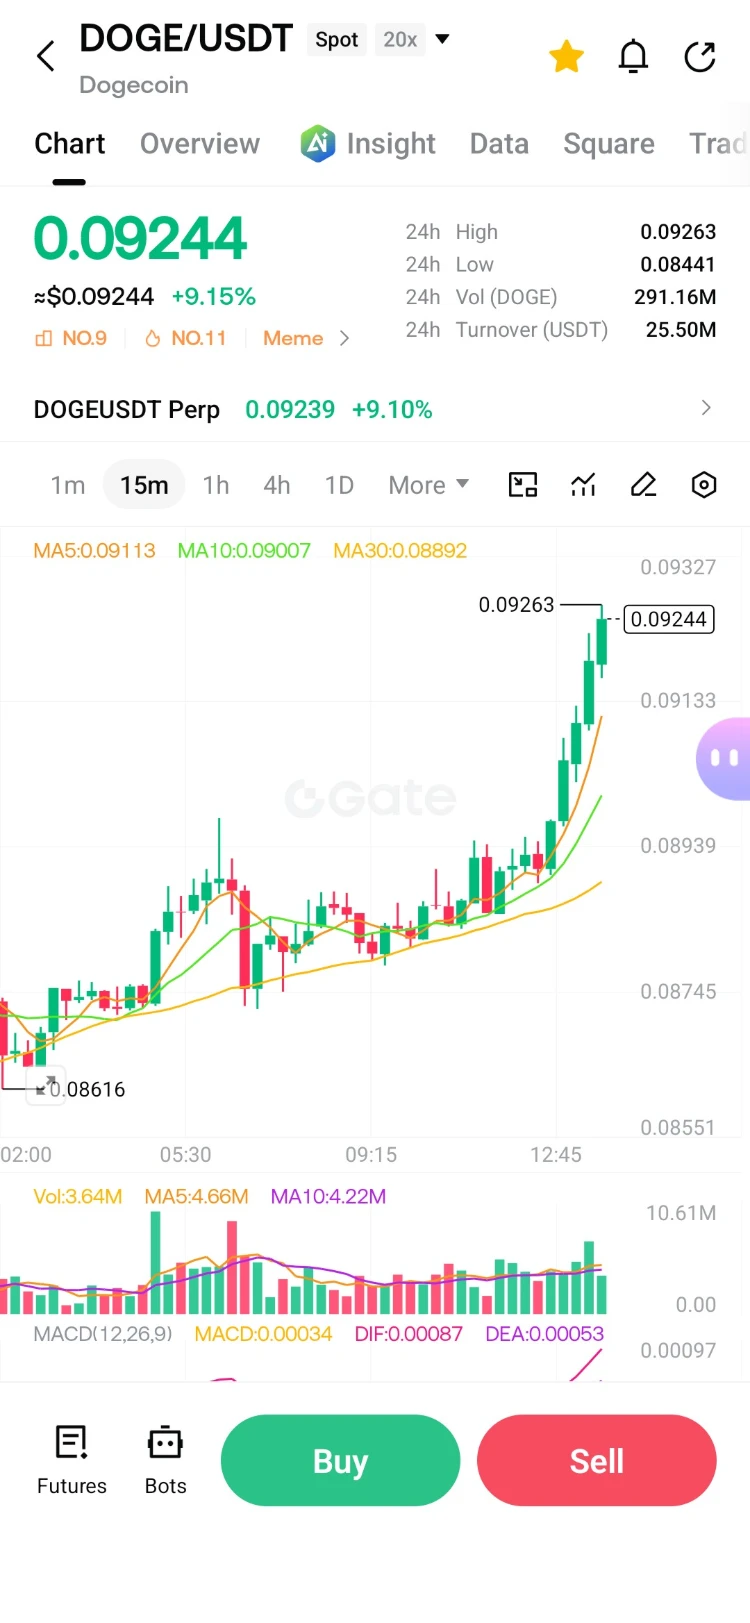
DOGE is showing renewed strength after defending the recent support zone, and the current structure is starting to look interesting for a long-position setup.
Dogecoin is trading around the $0.088–$0.09 area, with momentum improving after last week’s recovery. Recent market data also shows renewed spot DOGE ETF inflows, while technical indicators have turned more constructive. DOGE is currently holding above several short- and medium-term moving averages, which keeps the short-term structure tilted toward recovery.
For a long setup, I would watch the $0.086–$0.088 zone closely
BeautifulDay
#DOGELong
#DOGE
DOGE is showing renewed strength after defending the recent support zone, and the current structure is starting to look interesting for a long-position setup.
Dogecoin is trading around the $0.088–$0.09 area, with momentum improving after last week’s recovery. Recent market data also shows renewed spot DOGE ETF inflows, while technical indicators have turned more constructive. DOGE is currently holding above several short- and medium-term moving averages, which keeps the short-term structure tilted toward recovery.
For a long setup, I would watch the $0.086–$0.088 zone closely. Holding this area after a pullback could provide a reasonable entry region, while a clean move above $0.090 would strengthen the breakout structure.
Entry Zone: $0.086–$0.089
TP1: $0.093
TP2: $0.098
TP3: $0.103–$0.106
Stop Loss: Below $0.082
The first major challenge is around $0.093, where the 200-day EMA is currently positioned. A sustained breakout above that level could shift attention toward the $0.098–$0.106 area. On the downside, losing the $0.082–$0.083 support region would weaken the setup and increase the risk of a deeper pullback.
I would not chase a sudden green candle here. The cleaner approach is to watch for either a controlled retest of support or a confirmed breakout with volume. DOGE remains highly sensitive to broader market momentum, so BTC direction and overall altcoin liquidity should also be part of the trade plan.
For me, the key levels are simple: hold $0.086–$0.088, reclaim $0.090, then challenge $0.093. If buyers can turn that resistance into support, the next upside levels become much more interesting.
Trade with a defined stop and manage leverage carefully. This is a technical setup, not a guarantee of future price movement.
#DOGE #Dogecoin #CryptoTrading
repost-content-media
DOGE+14.32%
BTC+7.19%
  • 3
#KashkariSaysInflationStillTooHigh
U.S. inflation is back at the center of the market conversation, and Minneapolis Fed President Neel Kashkari's latest comments add another layer of uncertainty for traders watching the Federal Reserve and risk assets.
The message is important: inflation remains too high across the economy, and the problem cannot simply be explained by higher oil prices.
That matters because the Federal Reserve has just raised the federal funds target range by 25 basis points to 3.75%–4.00%. The September decision was unanimous, while the Fed's statement said inflation remain
BeautifulDay
#KashkariSaysInflationStillTooHigh
U.S. inflation is back at the center of the market conversation, and Minneapolis Fed President Neel Kashkari's latest comments add another layer of uncertainty for traders watching the Federal Reserve and risk assets.
The message is important: inflation remains too high across the economy, and the problem cannot simply be explained by higher oil prices.
That matters because the Federal Reserve has just raised the federal funds target range by 25 basis points to 3.75%–4.00%. The September decision was unanimous, while the Fed's statement said inflation remains elevated and that the latest action is intended to support a return toward its 2% inflation goal.
Why Kashkari's Comments Matter
The market is now focused on one major question:
Is the latest hike enough, or could policymakers need to tighten further?
Kashkari's comments reinforce the idea that inflation remains an important constraint for monetary policy.
The bigger issue is that inflationary pressure is broader than energy. If services and other parts of the economy continue experiencing elevated price growth, a decline in oil prices alone would not necessarily solve the Fed's inflation problem.
That is why traders need to look beyond crude oil and focus on the broader inflation data.
The Fed Has Already Tightened Again
The September 16 FOMC decision lifted the target range to:
3.75%–4.00%
The Fed simultaneously described economic activity as expanding at a solid pace, with resilient domestic spending, strong productivity growth and robust capital investment.
The latest projections also show how uncertain the policy path remains. The September projections put median PCE inflation at 3.7% for 2026, falling to 2.3% in 2027 and 2.1% in 2028. The median projected federal-funds rate was 3.9% at the end of 2026.
So this is not simply a weak-economy story.
It is a more complicated combination:
Resilient growth + elevated inflation + restrictive monetary policy + uncertainty over the next move.
What This Means for BTC
For Bitcoin, the connection comes through rates, liquidity and broader risk appetite.
Higher interest rates can make yield-bearing assets relatively more attractive and can tighten financial conditions. But BTC does not mechanically fall every time the Fed sounds hawkish.
The market can still rally if spot demand, institutional flows, liquidity or other catalysts are strong enough.
That is why I would focus on price confirmation rather than headlines alone.
If BTC holds major support despite hawkish Fed commentary, that would show resilience.
If BTC loses support while Treasury yields and the dollar strengthen, the macro pressure becomes more important.
BTC Levels I’m Watching
$82,000 — immediate upside zone
$80,000 — key psychological level
$78,000 — important support
$75,000 — deeper structural support
A sustained move above $82K with strong volume would strengthen the short-term upside structure.
A rejection near $82K followed by a loss of $80K would put $78K back into focus.
If $78K breaks with expanding selling pressure, $75K becomes an important level to monitor.
These are market levels, not guaranteed outcomes.
What About ETH?
Ethereum is facing the same macro environment.
ETH's move around the $2,700 area makes that level important for the current structure.
I would watch:
$2,700 — key near-term level
$2,650 — first pullback area
$2,600 — stronger support
$2,750–$2,800 — upside resistance
A hawkish rate environment can make breakouts harder to sustain, which is why volume and successful retests matter more than simply touching a resistance level.
My Trading Approach
I would not automatically short BTC simply because Kashkari's comments sound hawkish.
At the same time, I would not blindly chase a breakout while monetary-policy conditions remain restrictive.
For me, the framework is straightforward:
Watch BTC support.
Watch breakout volume.
Monitor Treasury yields and the dollar.
Track incoming inflation data.
Watch ETH and major altcoins for confirmation.
Keep leverage controlled.
The Federal Reserve's own data shows PCE inflation at 3.7% for July 2026, still materially above the Fed's 2% longer-run objective.
That leaves inflation as one of the most important variables for the next phase of the market.
The Bigger Picture
Kashkari's message highlights a difficult environment for traders.
The economy remains resilient.
Inflation remains elevated.
Rates have moved higher again.
Energy prices add another source of uncertainty.
And markets must now assess how long restrictive policy may remain necessary.
That combination can create significant volatility across Bitcoin, Ethereum, stocks, bonds, gold and the U.S. dollar.
For crypto, I think the most useful approach is to separate the macro headline from the actual market reaction.
If BTC holds support and breaks resistance with volume, the chart will provide confirmation.
If BTC loses major support while yields and the dollar strengthen, the macro pressure deserves greater attention.
Until then, I would rather let the market confirm the direction than chase every Fed headline.
Inflation is still the key variable.
Rates remain important.
And BTC now needs to prove its strength on the chart.
#FederalReserve #Kashkari #Inflation
BTC+7.19%
ETH+5.54%
  • 2
  • 2
#StriveHoldingsSurpass25000BTC
$BTC is becoming an increasingly important corporate treasury asset, and Strive Holdings has just reached a major milestone: 25,000 BTC.
According to the company’s latest SEC filing, Strive added 469 BTC between September 8 and September 11, spending approximately $36.6 million at an average purchase price of around $77,954 per BTC. The acquisition increased its Bitcoin treasury from 24,531 BTC to exactly 25,000 BTC.
At recent Bitcoin prices, that treasury represents roughly $1.95 billion in BTC exposure.
What makes the milestone particularly interesting is the
BeautifulDay
#StriveHoldingsSurpass25000BTC
$BTC is becoming an increasingly important corporate treasury asset, and Strive Holdings has just reached a major milestone: 25,000 BTC.
According to the company’s latest SEC filing, Strive added 469 BTC between September 8 and September 11, spending approximately $36.6 million at an average purchase price of around $77,954 per BTC. The acquisition increased its Bitcoin treasury from 24,531 BTC to exactly 25,000 BTC.
At recent Bitcoin prices, that treasury represents roughly $1.95 billion in BTC exposure.
What makes the milestone particularly interesting is the speed of Strive’s accumulation.
Back in April, the company reportedly held approximately 14,557 BTC. Reaching 25,000 BTC means its reported treasury has expanded by more than 10,000 BTC in just a few months, putting Strive among the largest publicly traded corporate Bitcoin holders.
And the latest purchase was not an isolated transaction.
During the previous week, Strive reportedly acquired another 1,375 BTC for approximately $109 million, at an average price near $79,281 per BTC. Before that, the company purchased another 1,800 BTC for roughly $143 million.
The bigger story is therefore not simply one 469 BTC purchase.
It is the pace of accumulation.
The $77,954 Purchase Price
The latest 469 BTC were acquired at an average of approximately $77,954 per BTC.
That price gives traders an interesting institutional reference point, but it should not be treated as a guaranteed technical support level.
Corporate treasury purchases and chart support are two different things.
What matters more is how Bitcoin behaves around the broader upper-$70K region, together with spot volume, liquidity and institutional flows.
How Was It Funded?
This is arguably the most important part of the transaction.
Strive stated that 100% of the capital used for the latest Bitcoin purchase came from SATA, its Variable Rate Series A Perpetual Preferred Stock.
SATA's notional value outstanding reportedly moved above $1 billion, reaching approximately $1.04 billion after the period's increase in shares outstanding.
That means the Bitcoin accumulation strategy is closely connected to Strive's capital structure.
The company also reported an amplification ratio of 53.5%, a measure it uses in relation to preferred equity, debt and Bitcoin net asset value.
For investors, this is an important reminder:
25,000 BTC does not automatically equal 25,000 BTC of unencumbered economic exposure for common shareholders.
Preferred obligations, financing costs, operating expenses, capital structure and the relationship between Strive's market valuation and its Bitcoin holdings all matter.
The Corporate Bitcoin Race
Strive is also becoming a major participant in the rapidly expanding corporate Bitcoin treasury market.
Recent reports have placed the company around the top tier of publicly traded corporate Bitcoin holders, alongside companies pursuing similarly aggressive treasury strategies.
That makes the race increasingly interesting because these companies are not simply competing on Bitcoin ownership. They are also experimenting with different methods of financing accumulation.
Strive's ability to continue adding BTC will therefore depend not only on Bitcoin's price, but also on its access to capital and the economics of its preferred-stock structure.
Bitcoin Remains the Key Variable
Strive's balance sheet contains more than Bitcoin.
As of September 11, the company reported approximately $204.2 million in cash and cash equivalents, along with roughly 505,000 shares of Strategy's STRC preferred stock, valued at approximately $49.8 million at the reporting date.
Still, Bitcoin remains the central asset around which the treasury strategy is being built.
And this is where the market needs to separate the headline from the actual trading implications.
A company accumulating thousands of BTC can contribute to the broader institutional adoption narrative, but one corporate purchase does not guarantee that BTC will rise.
The financing mechanism matters.
The purchase price matters.
The company's obligations matter.
And ultimately, Bitcoin's price action remains the market's final confirmation.
BTC Levels I’m Watching
The latest Strive purchase around $77,954 makes the upper-$70K region an interesting reference area.
But rather than treating that exact number as support, I would watch whether BTC can maintain the broader zone while building higher highs and higher lows.
If BTC holds the upper-$70K region with improving volume, attention can remain focused on the next major resistance areas.
If BTC loses important support with expanding selling volume, corporate accumulation alone should not be expected to stop a broader correction.
For me, confirmation remains more important than the headline.
Price structure + volume + liquidity + institutional flows tell a much more complete story than any single treasury purchase.
The Bigger Picture
Strive reaching 25,000 BTC is another clear example of how quickly corporate Bitcoin treasury strategies are evolving.
The latest 469 BTC acquisition, approximately $36.6 million in spending, an average purchase price near $77,954, SATA's notional value above $1 billion, and a reported 53.5% amplification ratio all show that the story is about much more than simply accumulating Bitcoin.
It is about building an entire capital structure around BTC exposure.
The key question now is not just how much Bitcoin Strive owns.
It is whether the company can continue accumulating at this pace — and how Bitcoin itself responds as corporate treasury demand becomes a larger part of the market narrative.
25,000 BTC is a milestone. The next chapter will be determined by price, liquidity, capital and continued accumulation.
#BitcoinTreasury #CryptoMarket #InstitutionalBitcoin
BTC+7.19%
ASST+0.84%
SATA+0.10%
STRC+0.19%
  • 4
  • 2
#GarrettJinClosesZECShortWith36MillionLoss
Garrett Jin has finally closed his ZEC short after holding the position for roughly three months — and the result is a realized loss of approximately $36 million.
According to recent on-chain monitoring, Jin closed the entire short position of roughly 38,000 ZEC, realizing a reported loss of about $36.13 million. Another tracker estimated the realized loss at approximately $35.44 million, with the difference reflecting calculation and execution-cost methodology.
The trade is significant because ZEC moved dramatically higher while the short remained o
BeautifulDay
#GarrettJinClosesZECShortWith36MillionLoss
Garrett Jin has finally closed his ZEC short after holding the position for roughly three months — and the result is a realized loss of approximately $36 million.
According to recent on-chain monitoring, Jin closed the entire short position of roughly 38,000 ZEC, realizing a reported loss of about $36.13 million. Another tracker estimated the realized loss at approximately $35.44 million, with the difference reflecting calculation and execution-cost methodology.
The trade is significant because ZEC moved dramatically higher while the short remained open.
Jin had built the position as Zcash continued to rally, eventually reaching roughly 38,000–40,000 ZEC in short exposure. Instead of reversing lower, ZEC pushed through major psychological levels and eventually traded around the $1,500–$1,600 region.
The closing itself also became part of the market story.
Reports indicate that Jin covered the position through market orders over approximately 90 minutes. During that execution window, ZEC moved from around $1,490 toward $1,530, adding another layer of forced buying pressure as the large short was removed.
But there is another side to this story that is just as important.
The same tracked wallet still holds approximately 202,078 ZEC in spot, worth more than $300 million at recent prices. That means the $36 million derivatives loss should not be viewed in isolation from the much larger spot exposure.
This is why I would not simply describe the trade as a trader “betting against Zcash.”
A large short position can also function as a hedge against a much larger spot position. Public blockchain data can show the positions, but it cannot tell us the trader's complete private strategy or risk-management plan.
What the market can clearly see is the impact on ZEC.
A major short has now been removed after the token delivered an extraordinary rally. That reduces one source of potential selling pressure from the derivatives side and also demonstrates how dangerous it can be to maintain a large leveraged position while price continues moving against it.
The bigger question now is what happens after the short is gone.
ZEC recently approached the $1,600 area, making that the key psychological and technical level to watch.
If ZEC can establish acceptance above $1,600 with strong spot volume, attention could shift toward:
$1,650 → $1,700 → $1,750 → $1,800
But if the market rejects $1,600 and falls back below $1,500, traders could start watching:
$1,450 → $1,400 → $1,330–$1,350
The important lesson from this trade is not simply the size of the loss.
It is the relationship between price momentum, leverage, hedging and position size.
ZEC's rally has shown that a strong spot trend can remain powerful for much longer than a leveraged short thesis expects. At the same time, the existence of a large spot position alongside the short demonstrates why position data needs context before drawing conclusions.
Jin's ZEC short is now closed.
The market has absorbed a roughly $36 million realized loss, while the much larger spot ZEC position remains.
Now the focus shifts back to price.
Can ZEC turn $1,600 into support, or will the failed breakout send the market back toward $1,500?
That is the level I will be watching next.
#Zcash #ZEC #CryptoMarket #GateSquare
ZEC-2.06%
  • 7
#ETHBreaks2700
#EthereumSpotETFsSee144MNetInflow
$ETH is back in focus after U.S. spot Ethereum ETFs recorded approximately $143.7 million in net inflows on September 18, marking a clear reversal after three consecutive sessions of net outflows.
The most interesting part is where the capital went.
BlackRock’s iShares Ethereum Trust ETF (ETHA) led the inflows with approximately $114.3 million, accounting for close to 80% of the day’s total. Fidelity’s FETH added another $26.2 million. ETHA’s cumulative historical net inflows have now reached roughly $12.96 billion, while cumulative net inflows
BeautifulDay
#ETHBreaks2700
#EthereumSpotETFsSee144MNetInflow
$ETH is back in focus after U.S. spot Ethereum ETFs recorded approximately $143.7 million in net inflows on September 18, marking a clear reversal after three consecutive sessions of net outflows.
The most interesting part is where the capital went.
BlackRock’s iShares Ethereum Trust ETF (ETHA) led the inflows with approximately $114.3 million, accounting for close to 80% of the day’s total. Fidelity’s FETH added another $26.2 million. ETHA’s cumulative historical net inflows have now reached roughly $12.96 billion, while cumulative net inflows across U.S. spot Ethereum ETFs are around $13.25 billion based on the latest reported data.
ETF flows matter because they provide another window into demand beyond exchange trading activity. Sustained positive flows can indicate that investors are increasing their exposure to ETH through regulated investment products.
But one positive session does not confirm a trend reversal.
The recent sequence makes that very clear. Ethereum ETFs saw approximately $121.1 million of inflows on September 14, followed by $142.3 million of outflows on September 15, $224.1 million of outflows on September 16, and another $39.3 million of outflows on September 17. Then September 18 brought the $143.7 million reversal.
Now the real question is whether this inflow continues.
ETH is trading around the $2,570 area in the latest market data, putting price directly around an important technical zone. For me, $2,600 is the key level to watch.
A decisive move above $2,600 supported by strong spot volume could bring $2,650–$2,700 into focus, followed by the $2,750–$2,800 region.
On the downside, failure to reclaim $2,600 would keep $2,500 as the first important support. A break below that level could expose $2,440–$2,450, while $2,400 remains a major structural area. A deeper correction could eventually bring $2,300–$2,350 into focus.
ETH levels I’m watching:
Current area: ~$2,570
Resistance: $2,550–$2,600
Breakout confirmation: Above $2,600
Next resistance: $2,650–$2,700
Higher resistance: $2,750–$2,800
First support: $2,500
Next support: $2,440–$2,450
Major support: $2,400
Deeper support: $2,300–$2,350
Another important detail is the size of the Ethereum ETF market. One tracker reports approximately $23.45 billion in assets across tracked Ethereum ETF products, with around 5.91 million ETH held by those funds. Different providers can report different figures depending on methodology and product coverage, so I would focus more heavily on the direction and persistence of flows than on any single AUM headline.
The broader ETF picture is also notable. On September 18, U.S. spot Bitcoin ETFs reportedly attracted around $433 million in net inflows while Ethereum ETFs added roughly $144 million. Both major crypto assets therefore saw positive ETF demand during the same session.
For ETH, that creates an interesting setup: institutional flows have turned positive, price is approaching major resistance, and the broader market remains sensitive to macroeconomic developments and interest-rate expectations.
I would not treat the $144 million inflow alone as a reason to chase ETH. The stronger confirmation would be several consecutive sessions of positive ETF flows combined with ETH holding higher support levels.
From a trading perspective, I’m more interested in how price behaves around $2,600. If ETH breaks above that level and successfully retests it as support, continuation becomes a much more interesting scenario to monitor. If price repeatedly rejects the zone, waiting for a better risk/reward setup around support may make more sense than entering directly underneath resistance.
The invalidation level is equally important. If ETH loses $2,400 under strong selling pressure and fails to reclaim it, the short-term structure would weaken significantly and the setup would need to be reassessed.
The bigger picture is simple: $143.7 million is encouraging, but the next few ETF sessions matter more than one headline number.
Now I’m watching three things closely:
ETF flows → ETH around $2,600 → volume confirmation.
If institutional demand continues while ETH builds higher supports and breaks resistance with confirmation, the market structure could strengthen considerably. If flows turn negative again and ETH loses $2,500–$2,400, patience becomes more important than chasing the narrative.
For #ShareWeekly market tracking, this is the key takeaway: don’t just watch the $144 million. Watch what happens next.
#Ethereum #CryptoMarket
ETH+5.54%
BTC+7.19%
  • 5
#CryptoMarketCapBackAbove2.8T
The global crypto market is back above the $2.8 trillion mark, signaling a strong recovery in overall market momentum.
According to recent market data, total crypto market capitalization climbed to around $2.87–$2.89 trillion, with Bitcoin trading above $81,000 and Ethereum holding above $2,600. The rebound comes after the market had briefly pulled back below $2.8 trillion following last week’s volatility.
What makes this move interesting is that the recovery is not being driven by Bitcoin alone. Altcoins have also participated, with the broader market seeing ren
BeautifulDay
#CryptoMarketCapBackAbove2.8T
The global crypto market is back above the $2.8 trillion mark, signaling a strong recovery in overall market momentum.
According to recent market data, total crypto market capitalization climbed to around $2.87–$2.89 trillion, with Bitcoin trading above $81,000 and Ethereum holding above $2,600. The rebound comes after the market had briefly pulled back below $2.8 trillion following last week’s volatility.
What makes this move interesting is that the recovery is not being driven by Bitcoin alone. Altcoins have also participated, with the broader market seeing renewed activity across major Layer-1s, DeFi, tokenization-related assets, and other sectors.
The $2.8 trillion level is now an important psychological area. If the market can continue holding above it while trading volume remains healthy, attention could shift toward the $2.9 trillion zone and potentially higher levels. On the other hand, a quick rejection back below $2.8 trillion would show that buyers still need to prove they can defend the breakout.
For traders, the key signals to watch now are BTC stability above $80K, ETH maintaining the $2.6K area, total market volume, and whether altcoin participation continues to expand.
The market has regained momentum — now the question is whether this recovery can turn into sustained strength.
#CryptoMarket #Bitcoin #Altcoins
BTC+7.19%
ETH+5.54%
  • 4
  • 2
#GTSurges4.3%ToBreak10
#GT #Gate广场中秋团圆局
GT has crossed the $10 line now the market is testing how strong the breakout really is.
At around $10.90, GT has moved well beyond the level that was acting as psychological resistance only a few sessions ago. From approximately $9.35 on September 17 to $10.90 now, the move is close to 17%, while the token has also pushed its market capitalization back above $1.1 billion.
What I find more useful here is to separate the move into three stages rather than looking at the percentage gain alone.
Stage 1 — Reclaim
GT first had to establish itself above $10.
BeautifulDay
#GTSurges4.3%ToBreak10
#GT #Gate广场中秋团圆局
GT has crossed the $10 line now the market is testing how strong the breakout really is.
At around $10.90, GT has moved well beyond the level that was acting as psychological resistance only a few sessions ago. From approximately $9.35 on September 17 to $10.90 now, the move is close to 17%, while the token has also pushed its market capitalization back above $1.1 billion.
What I find more useful here is to separate the move into three stages rather than looking at the percentage gain alone.
Stage 1 — Reclaim
GT first had to establish itself above $10. The September sequence of closes around $9.95, $10.37 and $10.43 showed that the market was gradually accepting prices above the old psychological barrier rather than immediately rejecting it.
That makes $10.00–$10.20 the most important area underneath the current price. If GT returns there and buyers defend it, the old resistance starts functioning as a potential support base.
Stage 2 — Momentum
The current $10.90 price puts GT only about $0.10 below $11. That psychological level is therefore the immediate battlefield.
The interesting part is that GT's strongest recent participation came around the initial breakout. Daily trading activity moved from roughly $3.6 million on September 17 to about $4.8 million on September 19. The next move above $11 would be more convincing if volume expands again rather than price simply drifting higher on lighter activity.
This is where I would watch the difference between price momentum and participation.
Stage 3 — Confirmation
The market-cap data provides another useful confirmation layer. GT has recovered from roughly $964 million around September 15 to above $1.1 billion now. That is approximately $150 million of additional market value compared with that earlier reference point.
So the breakout is not just a move from one round number to another. Liquidity and market capitalization have expanded alongside the price recovery.
Technically, the next confirmation comes from momentum indicators. A healthy continuation would ideally keep RSI in a strong but controlled zone, maintain a positive MACD structure, and keep price above the rising 20-day and 50-day EMA. If RSI begins making lower highs while GT pushes toward $11, that would be a divergence worth respecting rather than chasing.
The levels I am tracking now are simple:
$11.00 — immediate psychological resistance
$10.70–$10.90 — current momentum area
$10.30–$10.45 — first breakout acceptance zone
$10.00–$10.20 — major support/retest area
The bullish continuation setup would be GT holding above $10.30–$10.45, followed by increasing spot volume and a decisive move through $11. The bearish invalidation would be a loss of the $10 area after repeated rejection near $11, especially if volume expands on the downside.
One thing I would avoid here is judging the breakout only from the +13% to +17% price move. The better confirmation is whether the market continues to show three things together: higher price acceptance, expanding capitalization and renewed trading participation.
GT has already completed the difficult psychological move from below $10 to above $10. At $10.90, the market is now approaching the next round-number test. The reaction around $11, followed by what happens on any retest of the $10.00–$10.20 region, should reveal much more about the strength of this breakout than the headline percentage gain itself. @Gate_Square
GT+7.21%
  • 7
  • 1
#GateVoyage
#
Gate Voyage: Understanding BTC3L Before Chasing the Reward
Gate Voyage is bringing a new opportunity into focus for users exploring ETF trading, with the current ETF Newcomer Voyage campaign running from September 16, 2026 at 15:00 UTC+8 until September 23, 2026 at 15:00 UTC+8.
What makes this campaign interesting is that it is specifically designed for users who have never traded ETFs before.
But for me, the most important part is not simply the reward. It is understanding how leveraged ETFs work before trading them.
The campaign currently highlights BTC3L, a 3x long ETF produc
BeautifulDay
#GateVoyage
#
Gate Voyage: Understanding BTC3L Before Chasing the Reward
Gate Voyage is bringing a new opportunity into focus for users exploring ETF trading, with the current ETF Newcomer Voyage campaign running from September 16, 2026 at 15:00 UTC+8 until September 23, 2026 at 15:00 UTC+8.
What makes this campaign interesting is that it is specifically designed for users who have never traded ETFs before.
But for me, the most important part is not simply the reward. It is understanding how leveraged ETFs work before trading them.
The campaign currently highlights BTC3L, a 3x long ETF product linked to Bitcoin's price performance. According to Gate's campaign information, eligible newcomers can qualify for the first-order reward after completing their first ETF trade with at least 1 USDT of trading volume, while higher benefits can reach up to 50 BTC3L after completing the specified cumulative trading milestones.
But there is a very important distinction:
A campaign reward is not the same thing as trading profit.
BTC3L remains exposed to Bitcoin's volatility, leverage and rebalancing mechanics. It should not be treated as simply holding BTC spot.
That distinction becomes even more important when Bitcoin is moving quickly.
BTC has recently recovered from the $75K–$76K area and moved back toward $82K, meaning a leveraged BTC product can experience significantly larger percentage fluctuations than the underlying asset.
If BTC moves higher, leveraged exposure can amplify the move.
If BTC reverses sharply, losses can also develop much faster.
And when BTC moves sideways while volatility remains elevated, daily rebalancing can cause the product's performance over multiple sessions to differ from simply multiplying Bitcoin's overall move by three.
That is why I think the most valuable part of Gate Voyage is simple:
Understand the product first. Think about the reward second.
Before trading a leveraged ETF, a newcomer should understand:
• How 3x exposure works
• How daily performance and rebalancing affect returns
• How volatility can influence performance
• How the product behaves during sharp BTC reversals
• What trading volume is required
• Whether the individual account is eligible
• How much capital can realistically be put at risk
The campaign deadline also matters.
The current Voyage campaign ends on September 23 at 15:00 UTC+8, so traders should verify the exact campaign conditions before assuming a trade will qualify. Eligibility is also important because the campaign is aimed at users without previous ETF trading history.
There is a broader lesson here for traders.
When Bitcoin is trending strongly, leveraged products can look attractive because the potential percentage movement is larger. But leverage works in both directions.
BTC rises → leveraged exposure can amplify gains.
BTC falls → leveraged exposure can amplify losses.
BTC moves sideways with high volatility → rebalancing can influence longer-term performance.
So I prefer confirmation over FOMO.
For a BTC-linked leveraged product, I would first watch Bitcoin itself. If BTC continues holding important support, forming higher lows and confirming resistance breaks with healthy volume, the market structure becomes easier to evaluate.
If BTC starts losing key support, leveraged exposure deserves much greater caution.
My approach would be to keep position size controlled rather than allowing the campaign to become a reason for excessive trading. Define the maximum acceptable loss before entering, and don't increase exposure simply because another reward tier is available.
The reward should be viewed as an additional campaign benefit, not compensation for taking unnecessary market risk.
I would also separate Gate Voyage into two completely different questions:
Campaign opportunity:
What rewards are available, and what conditions must be completed?
Trading opportunity:
Does the current BTC and BTC3L setup actually justify taking the risk?
These are not the same thing.
The campaign defines the potential promotional benefits.
The market determines whether the trade makes or loses money.
With BTC currently near an important resistance area, I would rather wait for a clear setup than enter simply because the campaign is active. A confirmed breakout and hold creates one type of market structure; a rejection followed by a move back toward support creates another.
My checklist is straightforward:
Understand the ETF.
Confirm eligibility.
Read the campaign conditions.
Know the volume requirements.
Watch BTC's direction.
Avoid chasing sudden candles.
Control position size.
Define invalidation before entering.
Never treat campaign rewards as guaranteed trading profit.
Gate Voyage gives ETF newcomers a structured way to explore this product category, but the market risk remains real even when a promotional reward is available.
With the September 23 deadline approaching, there is no need to trade aggressively simply to reach a reward tier.
Learn first. Verify the rules. Understand the product. Then let the trading setup—not the reward deadline—determine whether participation makes sense.
#GateETF #BTC3L
BTC3L+28.32%
BTC+7.19%
  • 7
#BTCBreaks82K
#Gate广场中秋团圆局
BTC $81,684: The Next Move Is Being Decided Above $80K
Bitcoin is trading around $81,684, and this rebound is becoming increasingly important because BTC has reclaimed the $80,000 zone where the market previously struggled to sustain upside momentum.
The question now is not whether Bitcoin can reclaim $80K — it already has.
The real test is whether buyers can absorb the selling around $81,800–$82,500 and turn this recovery into a confirmed continuation.
① BTC has entered a major decision zone
BTC recently pushed above $81,800 before giving back part of the move. Fo
BeautifulDay
#BTCBreaks82K
#Gate广场中秋团圆局
BTC $81,684: The Next Move Is Being Decided Above $80K
Bitcoin is trading around $81,684, and this rebound is becoming increasingly important because BTC has reclaimed the $80,000 zone where the market previously struggled to sustain upside momentum.
The question now is not whether Bitcoin can reclaim $80K — it already has.
The real test is whether buyers can absorb the selling around $81,800–$82,500 and turn this recovery into a confirmed continuation.
① BTC has entered a major decision zone
BTC recently pushed above $81,800 before giving back part of the move. For now, I’m watching $81,800–$82,500 as the immediate resistance cluster.
If buyers clear this area with strong volume and secure a meaningful daily close above it, the next zone comes into focus around $83,000–$84,000.
For me, a clean close matters more than a temporary intraday wick. The market needs to show acceptance above resistance, not simply trade there for a few minutes.
② $80K is the key support underneath the recovery
The recovery from below $76,000 has brought BTC back above $80K, making this level increasingly important to the current structure.
My key zones are:
$80,000–$80,500 → Primary support
$81,800–$82,500 → Immediate resistance
$83,000–$84,000 → Next upside resistance
If BTC pulls back and successfully holds $80K with healthy volume, the recovery structure remains intact. A decisive loss of $80K would tell a very different story.
③ Momentum has improved, but resistance still matters
BTC has reclaimed several important short-term moving averages during this rebound, but the $81K–$82K region remains a meaningful technical hurdle.
That is why I would rather watch the reaction at resistance than chase the current candle.
If BTC continues holding above its short-term averages while momentum remains strong, the breakout structure becomes more convincing. But repeated rejection around $82K–$82.5K could lead to consolidation, especially if momentum indicators begin to roll over.
④ ETF demand is helping the recovery
Institutional flows are another important part of the picture.
U.S. spot Bitcoin ETFs recorded roughly $433 million in net inflows on September 18, with Fidelity FBTC attracting around $310.72 million and BlackRock IBIT around $108.44 million.
However, the broader weekly picture was much less dramatic, with approximately $6.2 million in net ETF inflows for the week.
That makes consistency more important than one strong inflow day. For BTC, I want to see whether positive ETF demand continues while price remains above $80K.
⑤ Derivatives need to confirm the spot move
Bitcoin futures open interest remains around the mid-$50 billion area, while funding is positive but not yet showing the kind of extreme readings associated with heavily crowded longs.
That creates an important signal to watch as BTC approaches $82K–$83K.
If OI rises gradually while funding remains controlled, derivatives can provide healthier confirmation.
But if OI spikes sharply while BTC stalls at resistance and funding becomes increasingly expensive, the market could become more vulnerable to a leveraged flush.
⑥ The two scenarios are clearly defined
Bullish scenario: BTC holds $80K–$80.5K, absorbs selling around $81.8K–$82.5K and establishes a sustained close above that resistance. The next area to monitor would be $83K–$84K.
Bearish scenario: BTC repeatedly rejects $82K–$82.5K and then loses $80K with expanding downside volume. That would weaken the current reclaim and bring lower support levels back into focus.
At $81,684, Bitcoin is sitting just below its next major decision point.
The strongest confirmation would come from several factors moving together: BTC holding above $80K, spot volume expanding, ETF demand remaining supportive and derivatives leverage staying controlled.
For today's Gate Square discussion, I’m treating $82K not as an automatic target, but as the level BTC needs to prove it can hold above.
The next meaningful signal will come from what happens after the breakout attempt, not simply from the number printed on the screen.
#BTCBreaks82K
BTC+7.19%
  • 2
  • 2
Gate Square certified creator recruitment is underway! High-quality creators can join and share in the $100,000+ monthly creator prize pool!
📌 How to participate
Existing creators: Successfully apply for the “Creator Verification Badge” to participate automatically.
New creators: Fill out the onboarding form to apply 👉️ https://www.gate.com/questionnaire/7698
🎁 Creator benefits
1️⃣ First-post welcome gift: New or returning creators who publish their first post will receive a $30U reward!
2️⃣ Weekly posting reward: Complete the weekly posting task and easily share in the $10,000 prize pool!
  • 4
  • 2
Market Update Today
live-replay-cover
1,071 views09-21 08:54
01:02:46
Update About BTC
live-replay-cover
1,653 views09-20 13:45
01:29:31
🔮 Crypto, stocks, gold, macro trends, prediction markets…
Whatever your area of expertise, you’re welcome to join Gate Live, consistently produce high-quality content, grow your influence, and earn stable income!
🎁 New streamers can earn up to a $100 reward
💰 Enjoy up to a 40% livestream mining commission rebate
🔥 0% commission on subscription revenue
👥 Build an exclusive community and cultivate core followers
Connect with tens of millions of users in specialized fields and let more people discover your expert content!
👉 Start streaming now: https://www.gate.com/live
  • 3
  • 2
#BTCRetakes80K
Bitcoin has once again reclaimed the $80,000 level, putting the market’s attention firmly back on one of the most important psychological price zones.
The move above $80K represents a significant milestone for BTC price action. After periods of consolidation and volatility, reclaiming a major round-number level can bring renewed attention from traders, investors, and the broader crypto market.
The key question now is whether Bitcoin can establish sustained acceptance above $80K rather than simply making a short-term move through the level. Traders will be watching price structu
BTC+7.19%
  • 6
  • 2
#GateTops24HNetInflowsAmongExchanges
Gate is standing out in the latest 24-hour exchange-flow data, ranking at the top for net inflows among exchanges. This highlights the growing importance of liquidity, capital movement, and trader activity across the crypto market.
Net inflows measure the difference between assets moving into an exchange and assets leaving it over a specific period. When an exchange records strong positive net inflows, it means more capital is entering the platform than leaving during that period. This can be associated with increased trading activity, portfolio adjustment
BTC+7.17%
ETH+5.51%
  • 3
  • 2