
Square
Following
Hot
News
Notifications
Profile
Share your thoughts
placeholder
Article
Hot take!!!

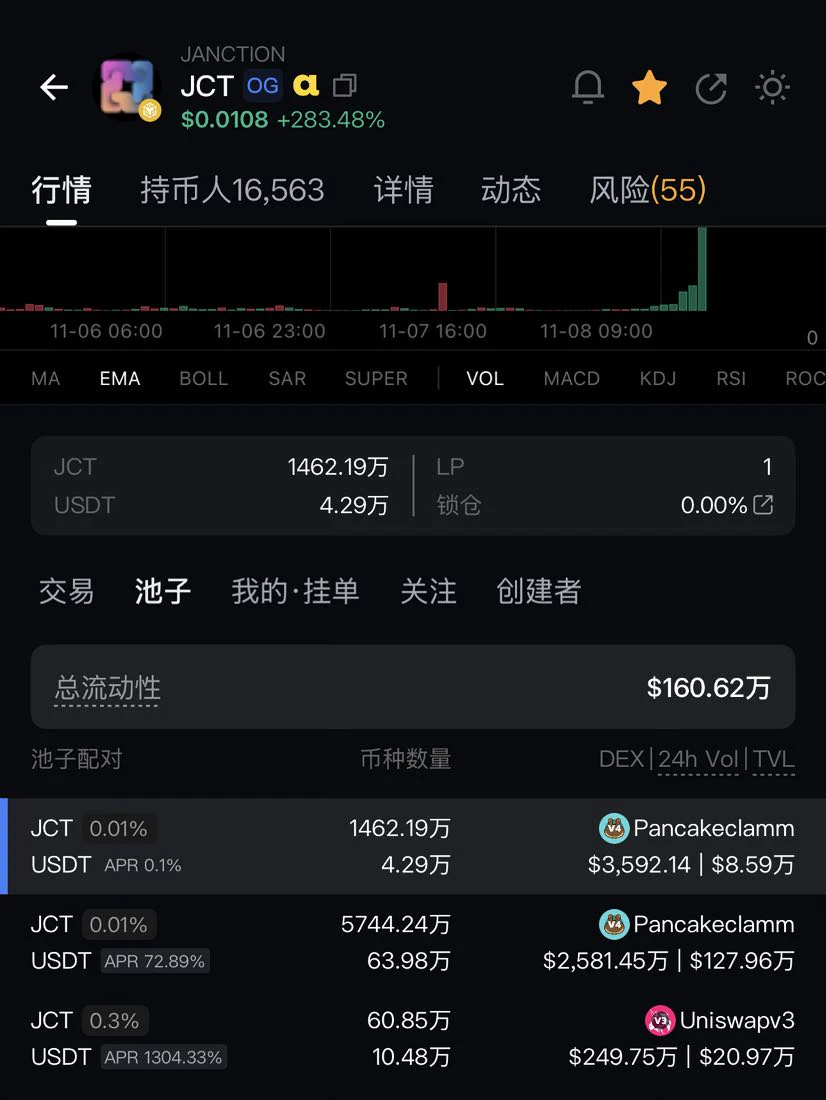
On-chain liquidity is just over $1 million, and with all the tokens in the market maker’s hands, pumping it to that level is entirely up to his mood. Once he’s made enough, he’ll turn around and start dumping $JCT
post-image
JCT-3.26%
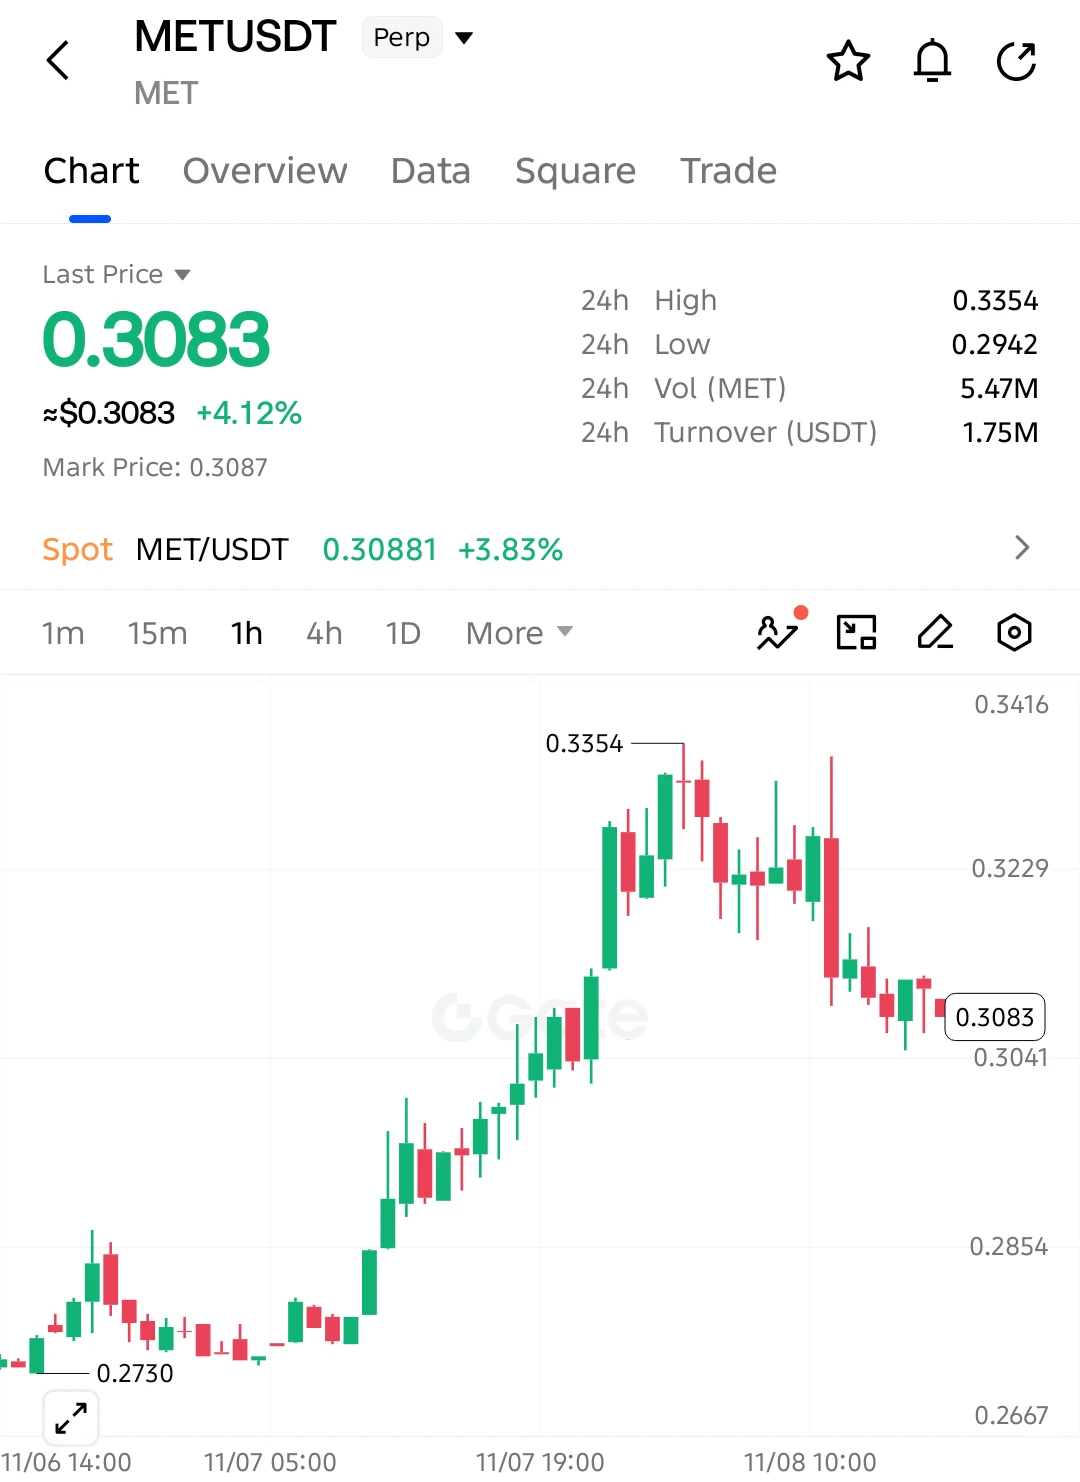
$MET LONG SETUP — BUYERS EYE ANOTHER RALLY!

$MET is up 4.12%, and the recent pullback could offer another buying opportunity as price approaches a key support zone!

Entry: 0.3083
SL: 0.3015

TP1: 0.3160
TP2: 0.3229
TP3: 0.3300
Final Target: 0.3354

$MET rallied strongly from 0.2730 before facing rejection at 0.3354. Price is now testing the 0.3041 support area, where buyers have shown some interest. If this level holds, another recovery toward 0.3229 and potentially 0.3354 could develop.

Invalidation: A sustained break below 0.3015 invalidates the bullish setup.

Keep your eyes on $MET!
post-image
MET-0.33%
Trenches
ZIG
Z
bade
b
ZIG
0x8c...1145
Market Cap
$.
Change
.
24h Vol
$.
Holders
.
STONK
S
bade
b
STONK
6GmA...UNgx
Market Cap
$.
Change
.
24h Vol
$.
Holders
.
CLAUDIA
C
bade
b
CLAUDIA
2j5S...W2ZM
Market Cap
$.
Change
.
24h Vol
$.
Holders
.
IDOL
I
bade
b
IDOL
0x3b...ab07
Market Cap
$.
Change
.
24h Vol
$.
Holders
.
FLOAT
F
bade
b
FLOAT
Bv1a...BMmr
Market Cap
$.
Change
.
24h Vol
$.
Holders
.
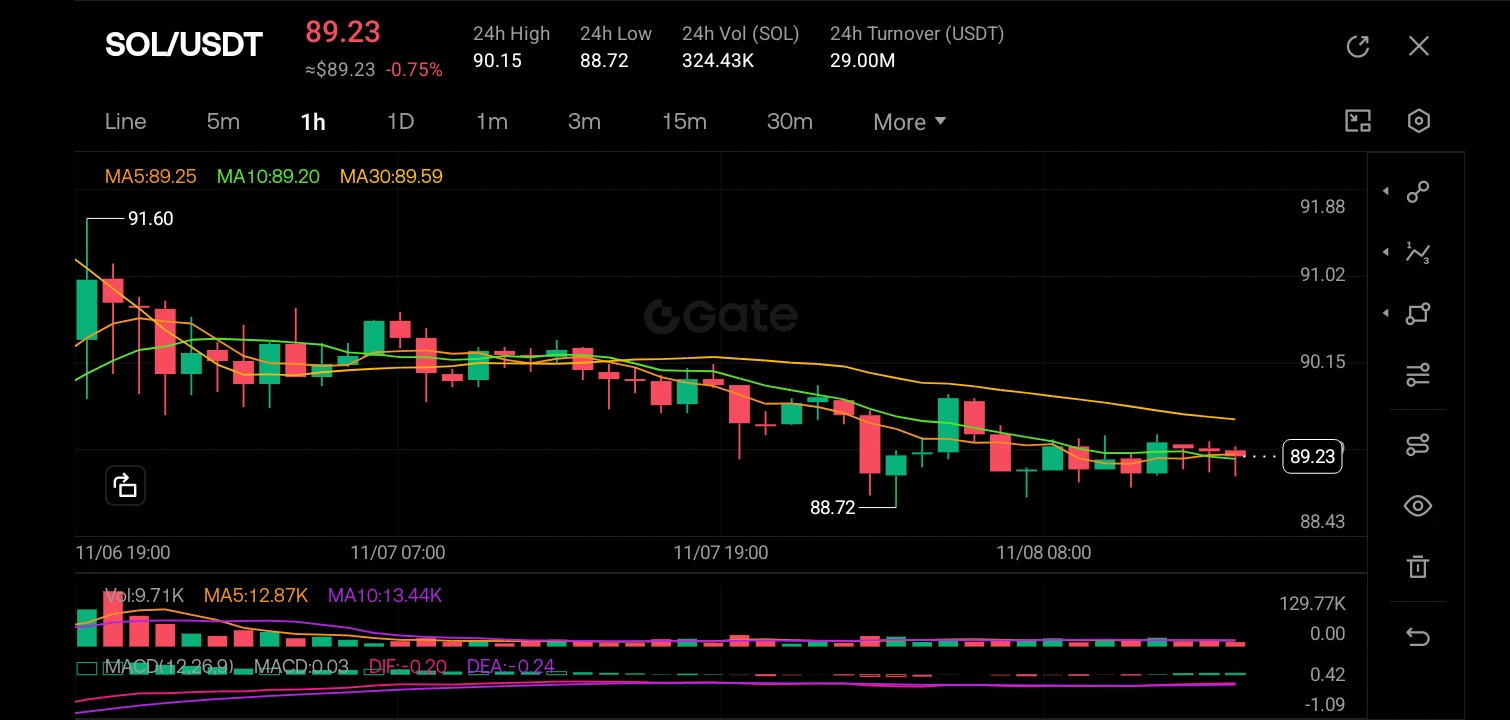
$SOL ‌
The SOL/USDT 1H chart reveals a prevailing downtrend that has recently hit a floor, currently trading at 89.23 with a -0.75% loss for the session; the price is trading below the long-term MA30 (89.59) which acts as dynamic resistance, while the shorter MAs (MA5 at 89.25 and MA10 at 89.20) have flattened out and are crossing, suggesting the aggressive selling pressure has exhausted itself. The MACD is displaying a potential bullish convergence, with the DIF (-0.020) crossing above the DEA (-0.024) and the histogram turning positive (green), indicating that despite the price being low, d
post-image
SOL-0.77%
  • 2
Why isn't Macau called Aomen?
post-image
#ICNT

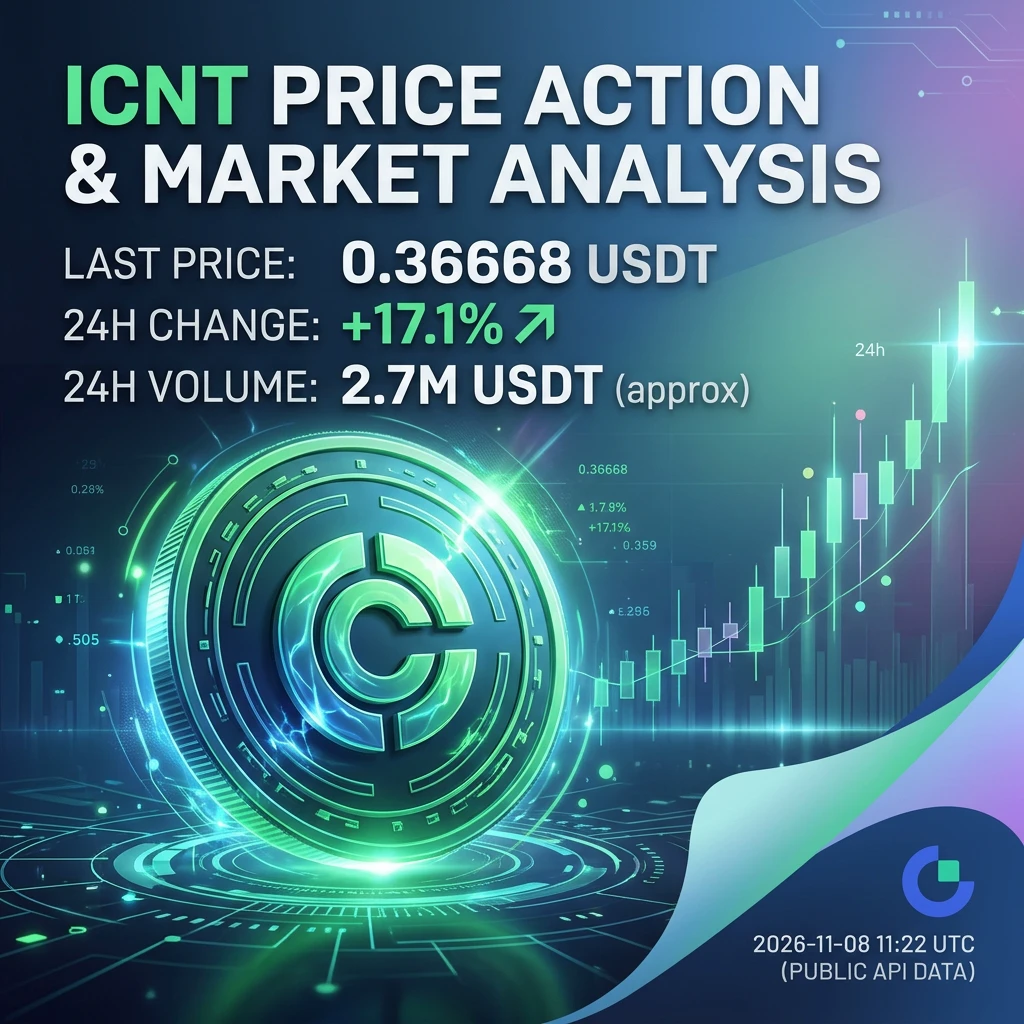
ICNT Rises 17.1%: What Happened, What Comes Next, and Where Are the Risks?

What Are Traders Asking Right Now?

ICNT has attracted attention after a strong upward move against USDT. The important question is not simply why the price increased, but whether the buying activity can support further growth or whether the market is approaching a period of profit-taking.

At 11:22 UTC on November 8, 2026, the supplied market snapshot recorded ICNT/USDT at 0.36668 USDT, representing a 17.1% increase over 24 hours. Reported trading volume was approximately 2,773,050 USDT.

These figures show a
post-image
ICNT-10.32%
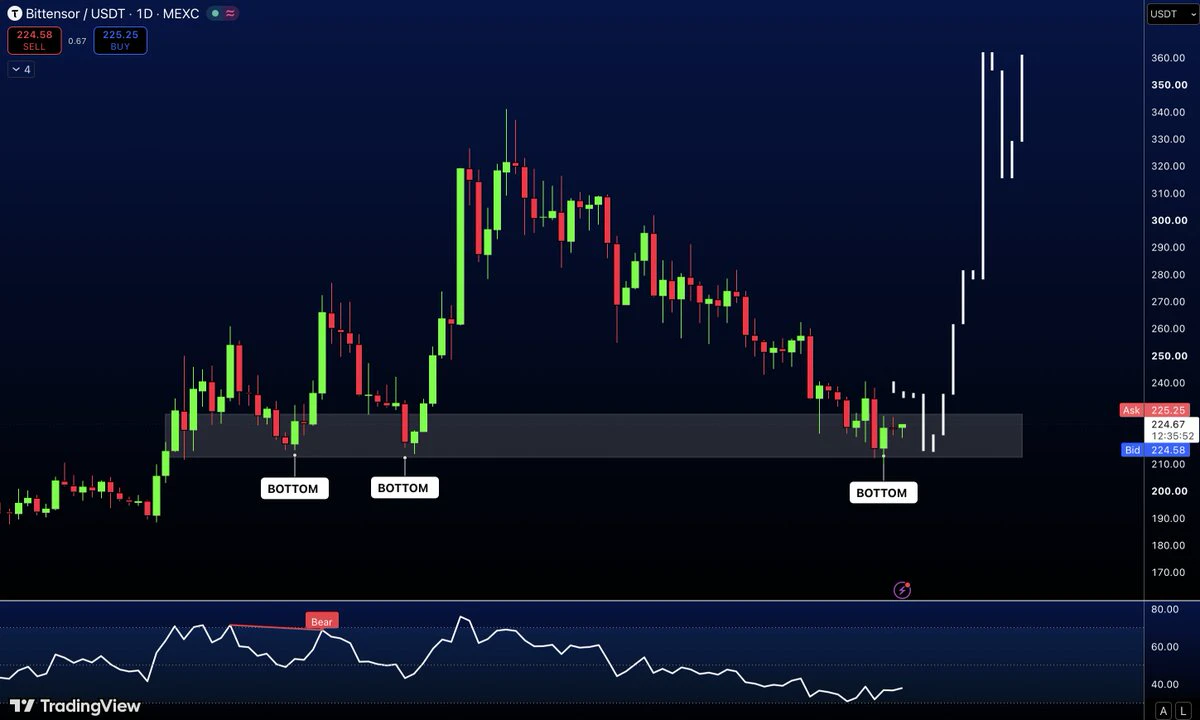
Quite possibly the most undervalued token you could scoop up on this fine, sunny Sunday ☀️ 🚀
post-image
TOKEN-0.16%
  • 1
I currently have 60% of my portfolio in Tesla + SPCX, 10% in Google, and 20% in Microsoft. Ever since I got into U.S. stocks, I’ve had far too much free time, so I’ve come to love this kind of life;
TSLA+4.26%
SPCX+8.74%
#PEPE

PEPE Moves 1.2% Higher: Is Buying Interest Returning or Is This Just a Short-Term Bounce?
What Makes This Move Interesting?

PEPE is trading at $0.00000497, with a 24-hour increase of 1.2%. While this is not a dramatic price movement, it deserves attention because even a relatively small change can reveal how traders are positioning themselves in a highly sentiment-driven cryptocurrency.

The November 8, 2026, 11:22 UTC market snapshot records three important figures:

Last price: $0.00000497

24-hour change: +1.2%

24-hour trading volume: Approximately $5,940,259 USDT

The numbers sho
post-image
PEPE+0.97%
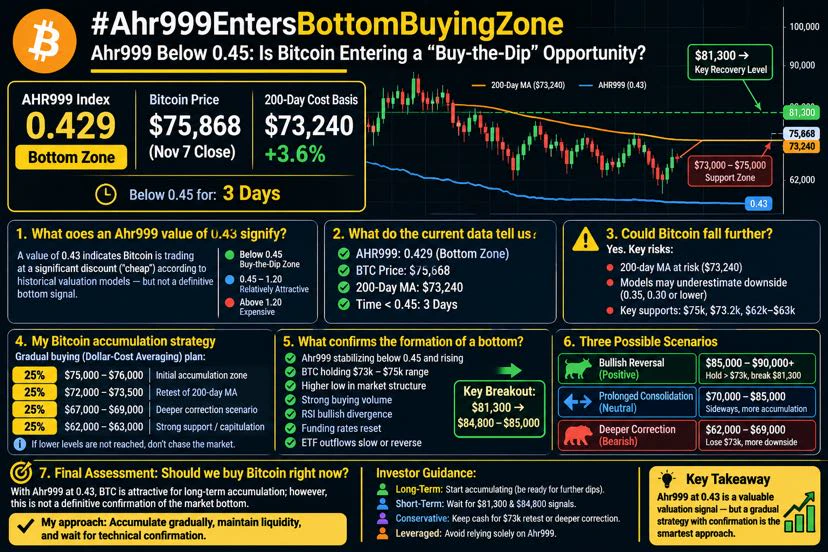
#Ahr999EntersBottomBuyingZone
Ahr999 Below 0.45: Is Bitcoin Entering a "Buy-the-Dip" Opportunity?

My assessment: An Ahr999 value of 0.43 serves as a meaningful valuation signal for long-term bullish expectations; however, it is not definitive proof that Bitcoin has reached its ultimate market bottom.

At the ~$76,000 price level, Bitcoin may be entering an attractive accumulation (buying) zone for long-term investors. Nevertheless, it is important to distinguish between the following three concepts:

* Bitcoin falling below its fair value (becoming "cheap").

* Bitcoin reaching a local marke
post-image
BTC-0.67%
  • 8
  • 1
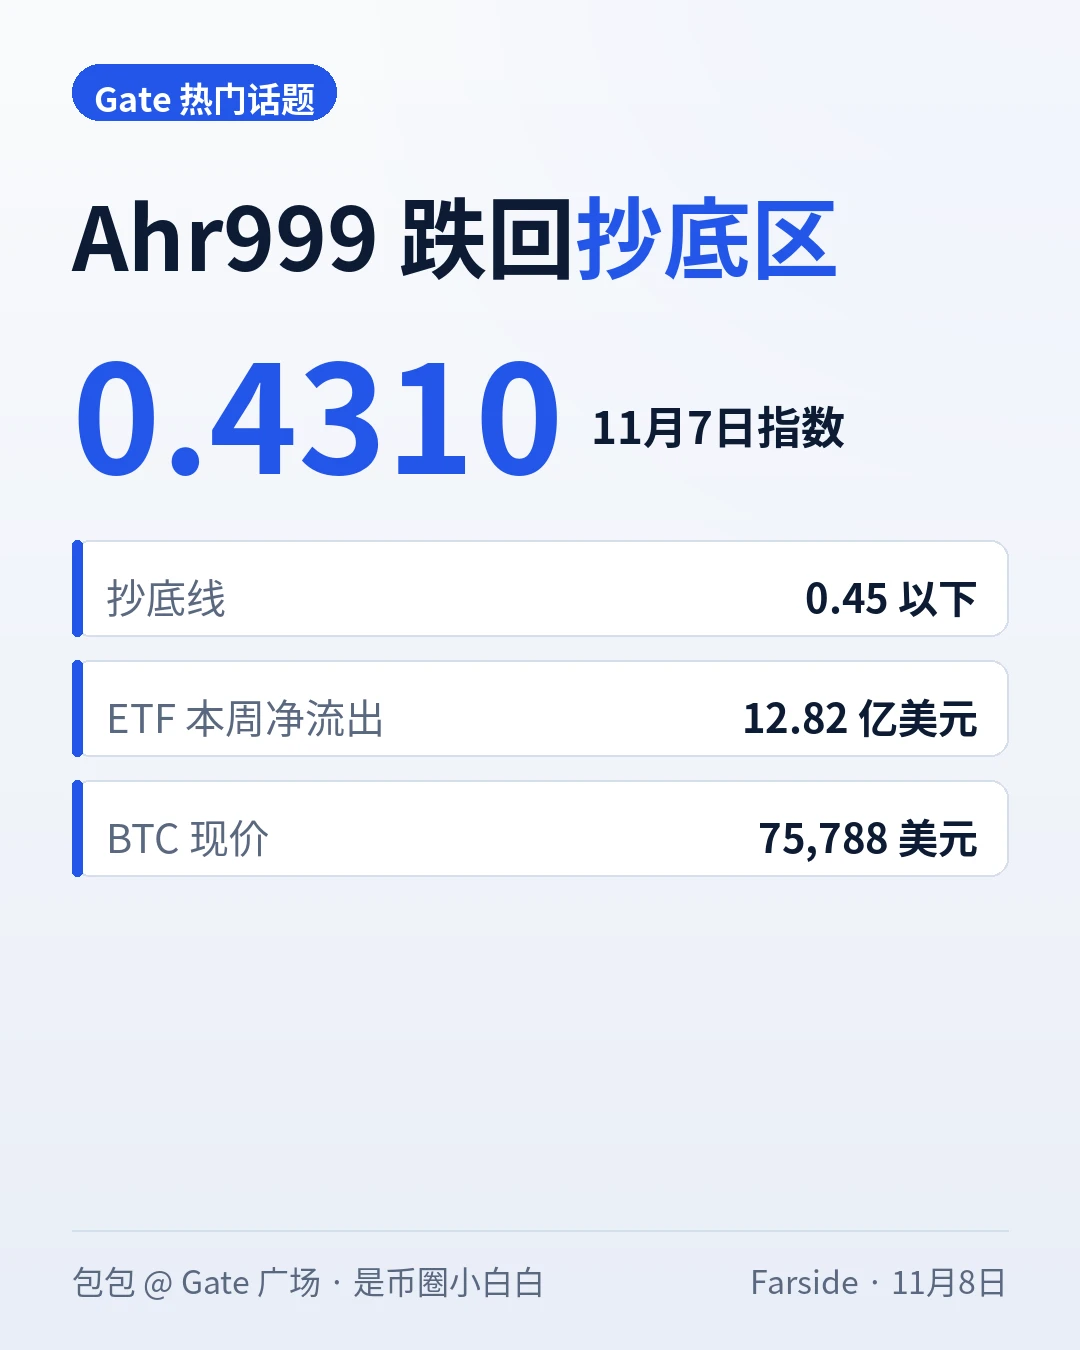
Ahr999 has fallen to 0.4310, back in the accumulation zone—but don’t rush to go all in. #Ahr999跌入抄底区间

First, what is this indicator? Ahr999 is a longtime tool for HODLers, designed to help people dollar-cost average gauge market levels: below 0.45 is the accumulation zone, 0.45 to 1.2 is the DCA zone, and above 1.2 is the overvalued zone. Yesterday (November 7), it came in at 0.4310, below the 0.45 accumulation threshold.

Why the warning not to rush? The accumulation zone lighting up doesn’t mean the bottom is in. From May 29 to August 19 this year, the indicator stayed below 0.45 for 82 st
post-image
BTC-0.67%
BLK+0.60%
ZRO’s 0.6% Rise: Why LayerZero’s Bigger Developments Matter More Than Today’s Price

The Myth: A Green Candle Confirms a Bullish Trend

A common market mistake is treating every positive daily move as proof that buyers are taking control. ZRO is a good example of why that assumption can be misleading. A price increase is encouraging, but one green 24-hour reading cannot confirm a lasting trend, a breakout, or a change in market direction.

The more useful approach is to examine three things together: price movement, trading activity, and developments within the project. ZRO has several impo
post-image
ZRO-2.59%
5 Signals That, If Absent, Keep Me From Chasing a Soaring Stock

What’s the most awkward thing in the stock market? It’s not a stock failing to rise—it’s buying in, only for it to start going into free fall.
So when I’m bullish on a stock, I’d rather watch it for a few more days.
First, check whether earnings are improving consistently, rather than relying on one-off gains to make them look good.
Second, check whether trading volume is healthy. A sudden surge in volume without a sustained rise may be a reason to be cautious.
Third, check whether the valuation is reasonable. Don’t assume a stoc
NVDA+2.80%
  • 15
Circle's Q3 earnings showed revenue of approximately $865 million, while on-chain USDC transaction volume grew nearly 49% year over year. The stablecoin sector is indeed heating up, and dollar-denominated liquidity in the market does not appear tight on the surface. However, BTC was still hovering around 75980 over the weekend, with a 24-hour range of roughly 74890 to 76380. Funding rates were near zero, and trading momentum was clearly weak.
What is really worth watching is the flow of funds: on November 6, U.S. spot BTC ETFs saw net outflows of about $412 million, including roughly $403 mill
post-image
ETH-1.26%
ZEC+1.16%
#70%OfAltcoinsFallBelow200DMA When I look at crypto exchanges and American exchanges, I see that this year Americans will have to come up with something new to make money quickly. 😊
Gentlemen, there is no easy money this year. Ask yourself why? Who is to blame? In our country, we say: As you sow, so shall you reap. The end of the year is approaching. Taxes must be paid.
Is a crisis on the horizon?
There is no winter for some. Printing dollars is cool. But what about the others?
$BTC $NVDA $ETH

#USAIStocksHitHard
post-image
BTC-0.67%
NVDA+2.80%
ETH-1.26%
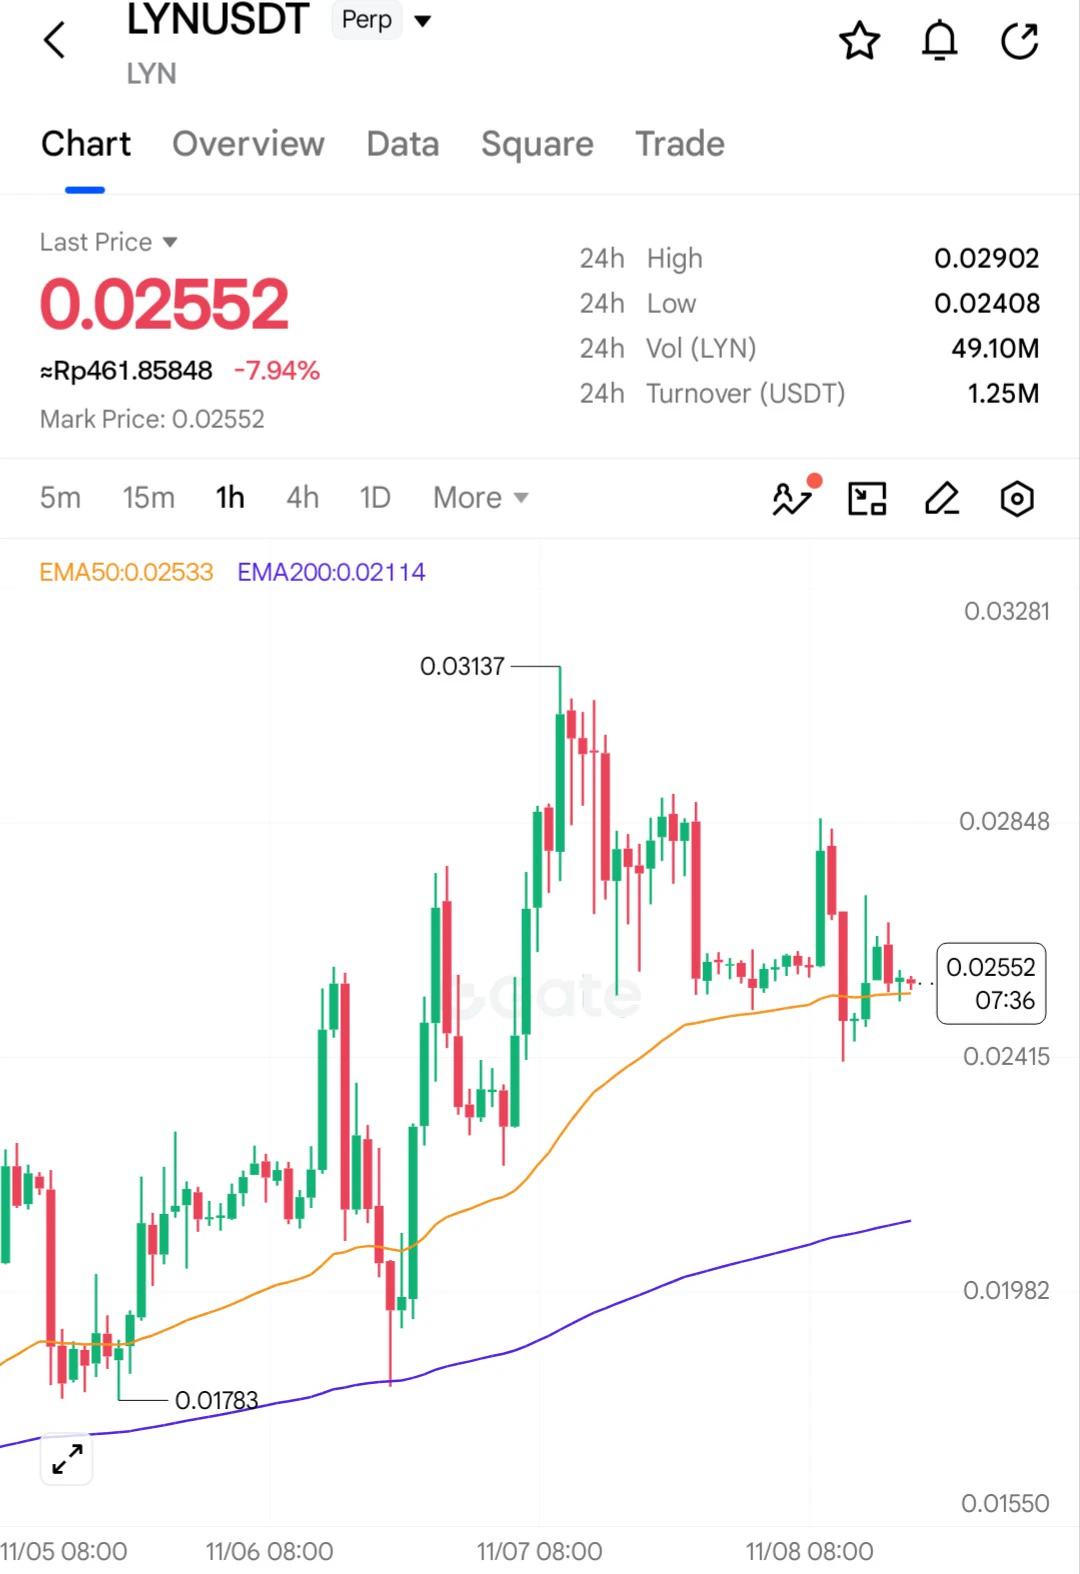
LYN, I thought the price was already too high. I opened a SHORT position, and it hit the Stop at Break Even that I had set before continuing to climb even higher.😅
#SquareTradingExpert
#WCTCS9
$LYN ‌
post-image
LYN-0.44%
#GateGuardNowAvailableForFree

Gate Guard Is Now Free: A Beginner’s Guide to Gate’s New Account Protection Plan

What Does Free Gate Guard Actually Mean?

Can you add another layer of protection to your crypto account without paying an activation fee? Gate Guard makes this possible for eligible Gate users. It is Gate’s Account Protection Plan, designed to provide a review process for certain direct asset losses caused by unauthorized transfers from a user's account.

This is an important development because protecting digital assets involves more than choosing strong passwords or monitori
post-image
Prediction markets assign a 52 percentage probability that Bitcoin will rise to $70,000 by the end
live-cover
LIVE2,135
Load More

Join 40 M users in our growing community

⚡️ Join 40 M users in the crypto craze discussion

💬 Engage with your favorite top creators

👍 See what interests you

Trending Topics

USCPIDataIncoming

7.61k Views1.57k Discussing

The U.S. October CPI report will be released on November 10 at 8:30 a.m. ET. September CPI came in at 3.7% year over year, and markets will be watching closely for signs that inflation is cooling, especially in core CPI. A softer-than-expected reading could strengthen rate-cut expectations, while hotter inflation may pressure risk assets through higher Treasury yields and a stronger dollar. How do you think this CPI print will move $BTC, U.S. stocks and gold?

USAIStocksHitHard

26.63k Views3.72k Discussing

USNonfarmPayrolls

49.41k Views4.46k Discussing

View More