Square
Following
Hot
News
Profile

Reeves_pound

vip
Peak Tier 4
Futures Trading Strategist
On-chain Analyst
Financial Analyst,Focus on cryptocurrency
5
Following
628
Followers
4.9k
Liked
Pin
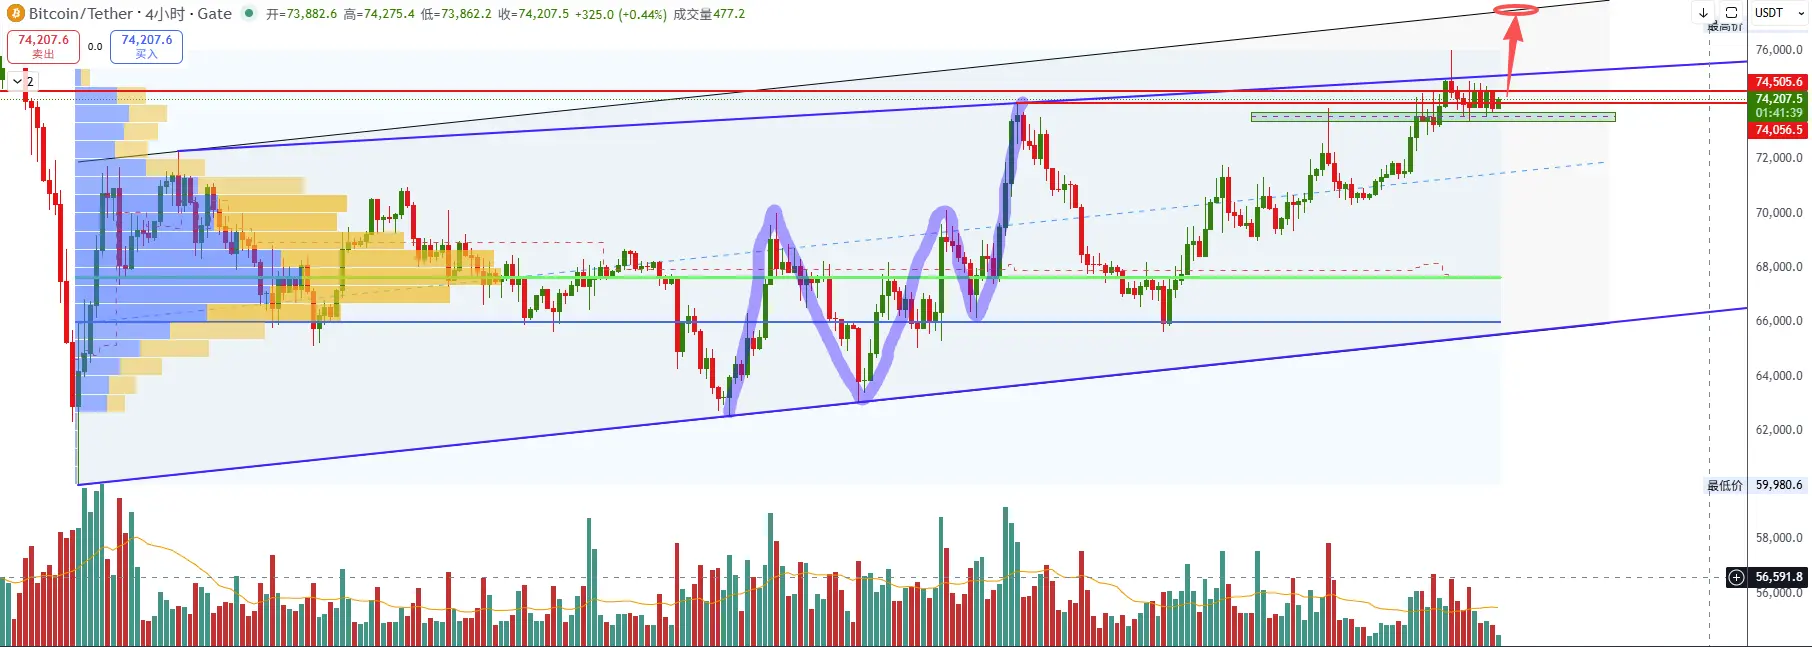
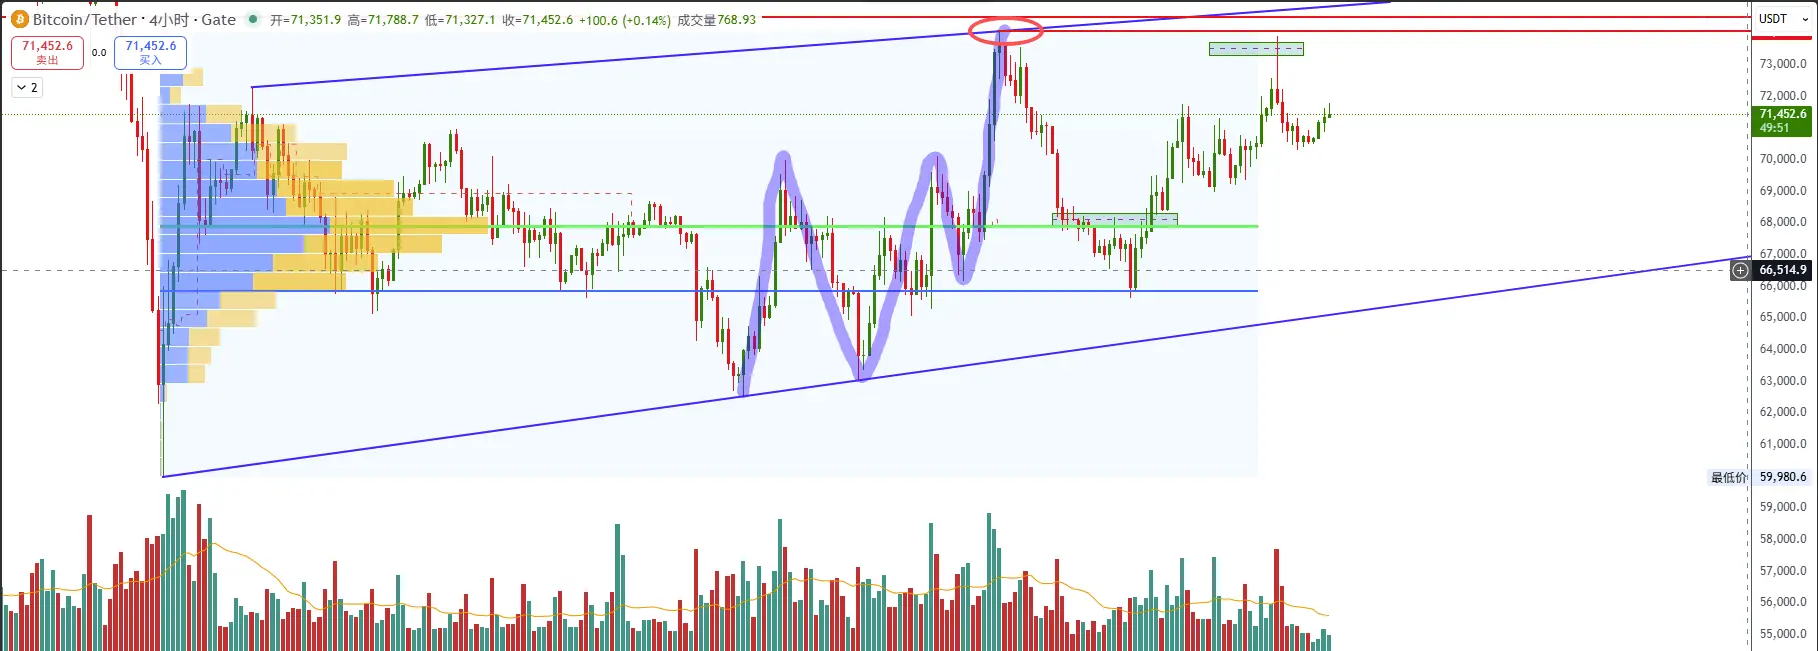
#加密市场上涨 $BTC Bitcoin experienced a strong rebound yesterday, with spot net inflow reaching 290 million. Currently, the 73700 level is a resistance point and may not form a perfect bullish flag pattern. Of course, there is also a possibility of a pullback to 75700. My current trading approach is to open a short position around 73700 and also set up a short position at the pullback level near 75700 (market analysis is not to be taken as trading advice).
post-image
BTC-0.65%
#BTC大跌 Short positions can take profit now. Price is clearly consolidating on low volume at this level, creating significant uncertainty; for profitable short positions, the risk-reward ratio is no longer favorable
Reeves_pound
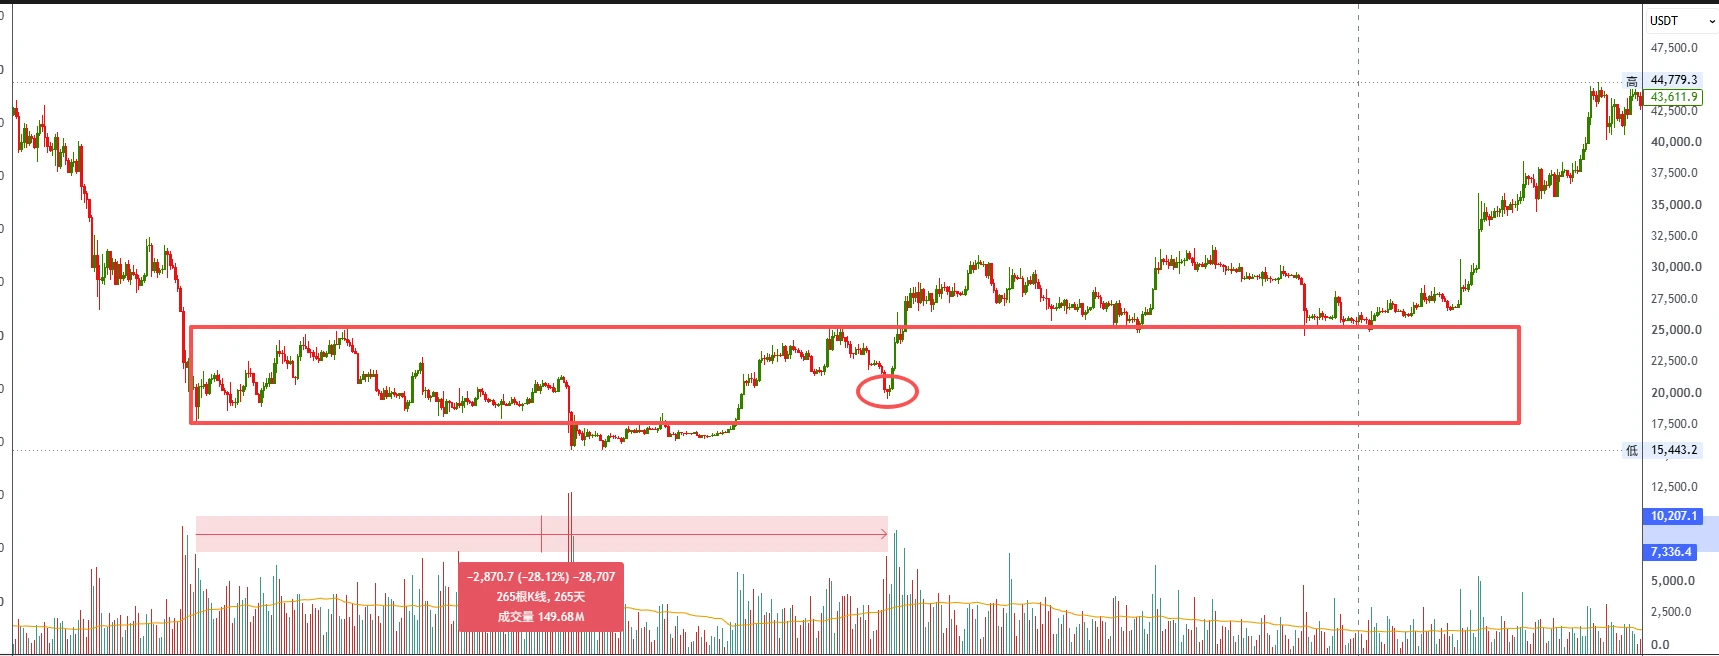
#美联储继续按兵不动 #BTC争夺8万美元关口 $BTC From the start of the previous bull market, the price action made a false breakout from a range-bound consolidation and may still need to test its lower boundary (the extent of the move will depend on real-time price action).
repost-content-media
BTC-0.65%
#btc$btc Why does this have only one view? Was it not posted?
BTC-0.67%
#美联储继续按兵不动 #BTC争夺8万美元关口 $BTC From the start of the previous bull market, the price action made a false breakout from a range-bound consolidation and may still need to test its lower boundary (the extent of the move will depend on real-time price action).
BTC-0.67%
  • 1
#btc$BTC , the rebound described in this assessment is most likely over. Broadly speaking, there is no sustained positive support for Bitcoin to continue rising, and major ETF buyers have not maintained their buying momentum. In addition, there are expectations of interest rate hikes on the fundamental side. Based on previous bull-bear transition cycles, the bottom is reached in October-November.
Reeves_pound
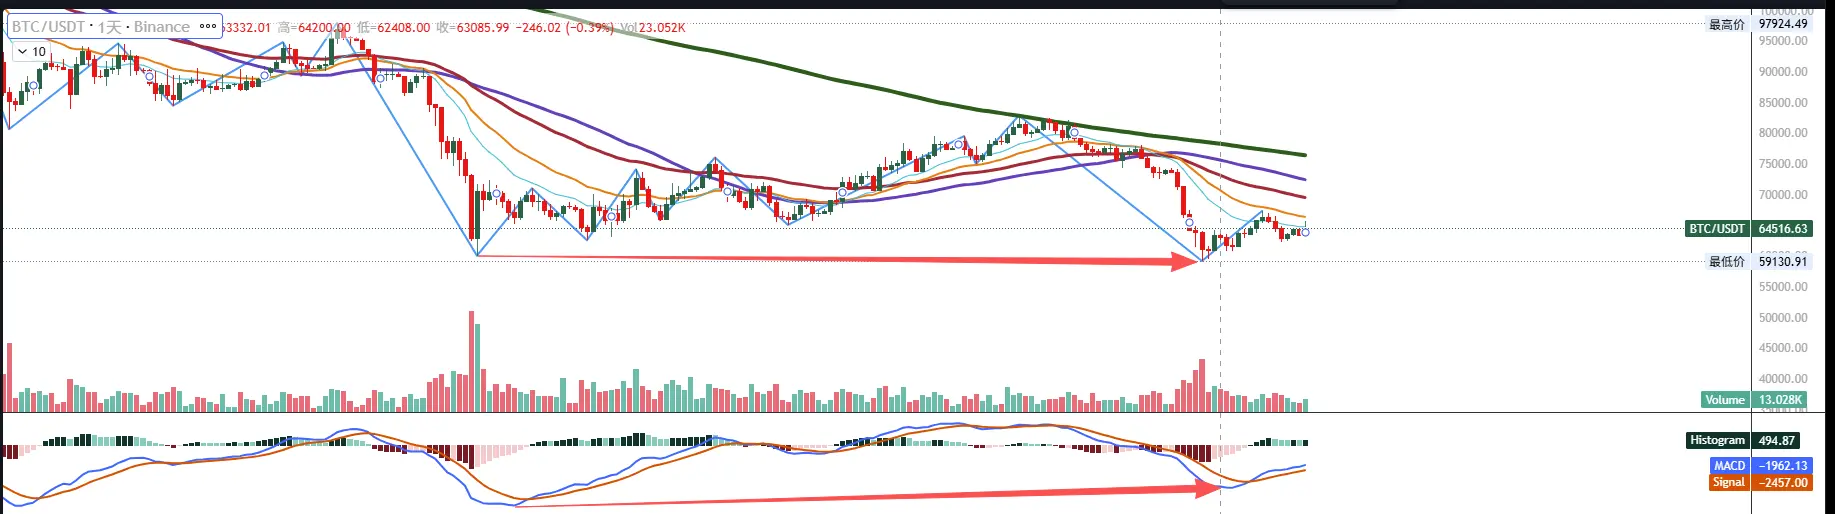
Bitcoin may not fall further (daily and weekly charts show double divergence)
repost-content-media
BTC-0.67%
Bitcoin may not fall further (daily and weekly charts show double divergence)
BTC-0.67%
  • 1
#BTC行情分析 Bitcoin$BTC experienced a divergence at the 4H red arrow position after a sharp drop at 6 AM (Chart 1). I have already stopped out 80% near 66,500. I have two remaining positions, and if the candlestick body breaks above the red box (Chart 2), I will exit all positions and leave the market at a loss.
BTC-0.65%
  • 1
#比特币震荡走弱 Bitcoin$BTC has broken out of the wedge in the large consolidation zone, falling below the lower boundary. The only support left is at the position of the green arrow. I personally opened a small position first; if it breaks below the support, I will add more (Market analysis is not investment advice).
post-image
BTC-0.65%
#BTC行情分析 Bitcoin$BTC is currently still fluctuating within the flag pattern channel formed by the pressure zones in the two red boxes, and has not broken out of a clear trend. It's a very boring market with only short-term trading opportunities. The overall direction remains the previous view of testing the lower edge of the wedge. The opportunity to open a position has just not arrived yet. (Market analysis is for reference only, not trading advice)🐻
BTC-0.67%
  • 2
#行情分析 Big pie$BTC on the macro level has formed a wedge consolidation pattern. Currently, the first analysis suggests it will test the lower trendline again. Analysis is analysis, and operation is operation! Then we need to closely examine the pressure levels at the operational timeframe. If the market breaks through the resistance level, the short positions held need to be reduced🐻
BTC-0.65%
#加密行情震荡 Bitcoin$BTC broke through the red box below with increased volume. As long as the pullback doesn't break the high point of the volume increase within the red circle, it can be considered that the market has returned to the weekly downtrend's main trend.
post-image
BTC-0.65%
#加密行情震荡 Bitcoin$BTC currently has resistance at the red box area. The price hitting this level shows very obvious resistance, with VPVR around 70,590. Based on current data and candlestick patterns, the market is experiencing a consolidation with a bearish bias following a wave of decline. However, the key node for this rebound is at 69,270. If this level doesn't break down effectively, we can't immediately conclude that this uptrend has ended. On the larger timeframe, the trend is still aligned with the overall downtrend.🐻
post-image
BTC-0.65%
  • 2
This expression sounds very hawkish🦅
post-image
#比特币支撑阻力位分析 Bitcoin$BTC Although this long position didn't incur significant losses, I personally over-emphasized Wyckoff's volume and price analysis while neglecting attention to indicators. MACD showed a very obvious exhaustion signal. Moreover, this position itself was a typical triangular wedge oscillation—price should follow wherever volume and price break out. In an oscillating market, I should have gone short at the upper band and long at the lower band (with take-profits near the upper and lower bands), but I shouldn't have made an early directional judgment! Additionally, combined w
Reeves_pound
#比特币支撑阻力位分析 Big Bitcoin$BTC support is in the green box, the daily line broke new highs, both volume and price have been confirmed, the current view is that the market will have new highs or at least reach the upper channel line, but we still cannot be blindly optimistic and directly go long, the current mindset is still primarily focused on short-term longs🐵
repost-content-media
BTC-0.65%
#比特币支撑阻力位分析 Big Bitcoin$BTC support is in the green box, the daily line broke new highs, both volume and price have been confirmed, the current view is that the market will have new highs or at least reach the upper channel line, but we still cannot be blindly optimistic and directly go long, the current mindset is still primarily focused on short-term longs🐵
post-image
BTC-0.65%
  • 2
  • 1
#加密市场上涨 $BTC broke above this high point, bearish views are withdrawing 🐮
post-image
Reeves_pound
#BTC行情分析 Bitcoin$BTC From a daily level perspective, yesterday closed with a positive candle, already showing six consecutive bullish days, but failed to create a new high. Using Wyckoff's theory, this would be described as effort with no result. However, we cannot blindly turn bearish. We are not guessing market direction; if we're analyzing, then there must be conditions for a reversal. If the price breaks above the highest point of this consolidation wave (the red circle position in the chart), then this bearish view would become invalid.🐻
repost-content-media
BTC-0.65%
#BTC行情分析 Bitcoin$BTC From a daily level perspective, yesterday closed with a positive candle, already showing six consecutive bullish days, but failed to create a new high. Using Wyckoff's theory, this would be described as effort with no result. However, we cannot blindly turn bearish. We are not guessing market direction; if we're analyzing, then there must be conditions for a reversal. If the price breaks above the highest point of this consolidation wave (the red circle position in the chart), then this bearish view would become invalid.🐻
BTC-0.65%
  • 1
#行情分析 $BTC The main trend of Bitcoin is still declining, this is beyond doubt. Currently, bullish voices in the market are rampant, with some even looking for 100,000, but you need to keep a clear head, my friend. Bottom formation is a lengthy process, and even if this is the bottom, it won't V-shaped recovery like this, unless there's another special period like the pandemic with major policy stimulus and money printing to increase liquidity🐻
post-image
BTC-0.65%
#加密市场上涨 BTC$BTC This position is near the low point of the last push to the 126,000 all-time high, and also near the highest point of this wave of oscillation rebound + the resistance level of the green box, stacking three layers of buff. I personally opened a small short position first with stop loss placed at the highest point of the three layers of buff (whichever of the three is highest) plus 2-3 points for potential wicks. (Market analysis for reference only, not trading advice)🐻
BTC-0.65%
Load More