Square
Following
Hot
News
Profile
Share your thoughts
placeholder
Article
🔹Chip Stocks Are Falling, but Demand Hasnt Weakened? With Democratic Regulatory Expectations Shakin
live-cover
LIVE1,786
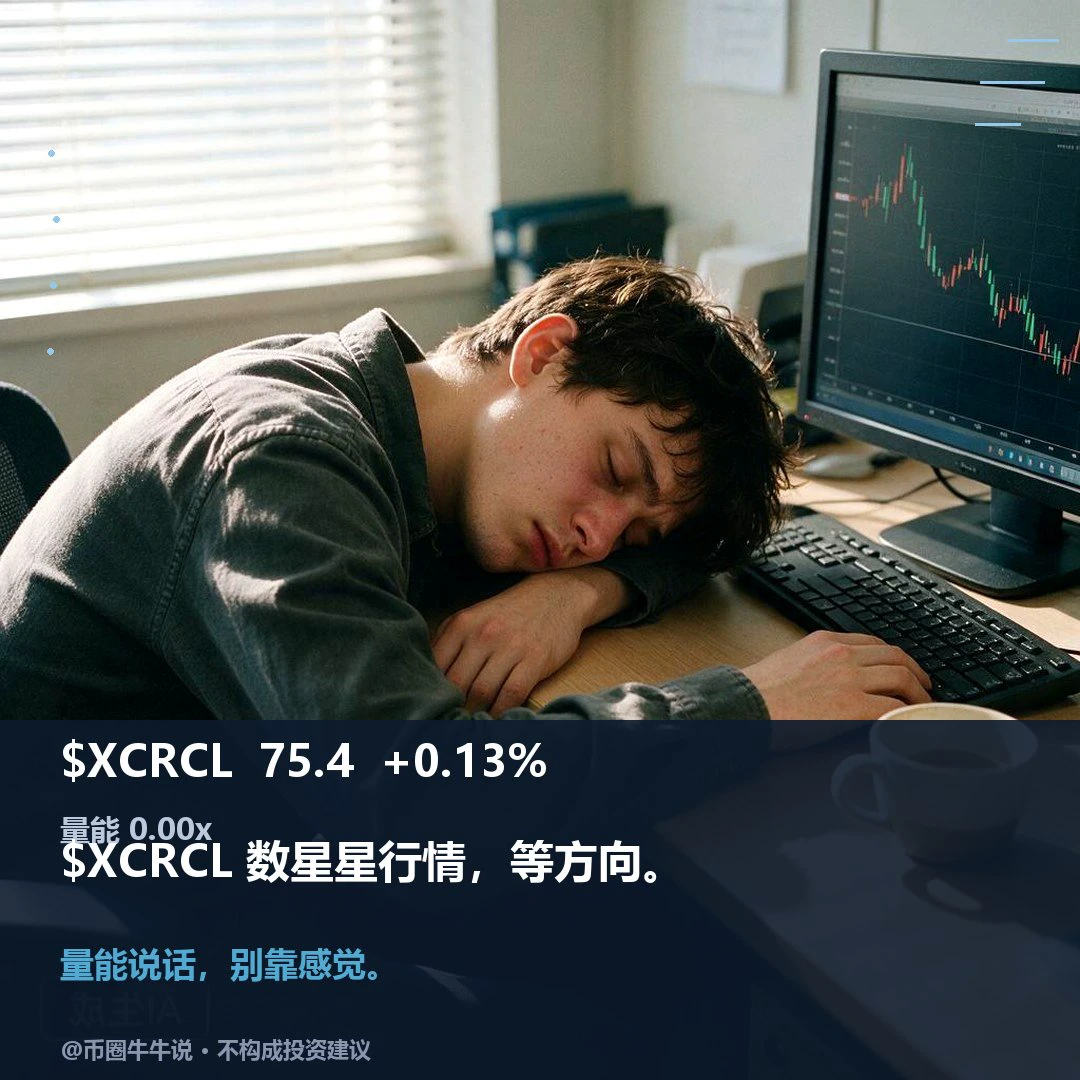
$XCRCL Currently at 75.4, 24H +0.13% (72.79–78.2). 1H is weak: RSI 27.27, with the current price below the 1H EMA20 at 75.64; 4H is strong: RSI 59.48, with the current price above the 4H EMA20 at 74.97. The 1H volume ratio is 0.0012, indicating very low participation. If price holds above the 78.2 resistance level, watch for continuation; if it breaks below the 72.79 support level, the short-term outlook may weaken. In the next review, check whether price can hold above 78.2 and recover after losing 72.79; the volume ratio is 0.0012x, so a break beyond these levels needs confirmation from part
post-image
Trenches
ZIG
Z
bade
b
ZIG
0x8c...1145
Market Cap
$.
Change
.
24h Vol
$.
Holders
.
BTC
B
bade
b
BTC
C5xp...pump
Market Cap
$.
Change
.
24h Vol
$.
Holders
.
HIGH
H
bade
b
HIGH
7ymF...high
Market Cap
$.
Change
.
24h Vol
$.
Holders
.
STONK
S
bade
b
STONK
6GmA...UNgx
Market Cap
$.
Change
.
24h Vol
$.
Holders
.
CORLA
C
bade
b
CORLA
0xba...7777
Market Cap
$.
Change
.
24h Vol
$.
Holders
.
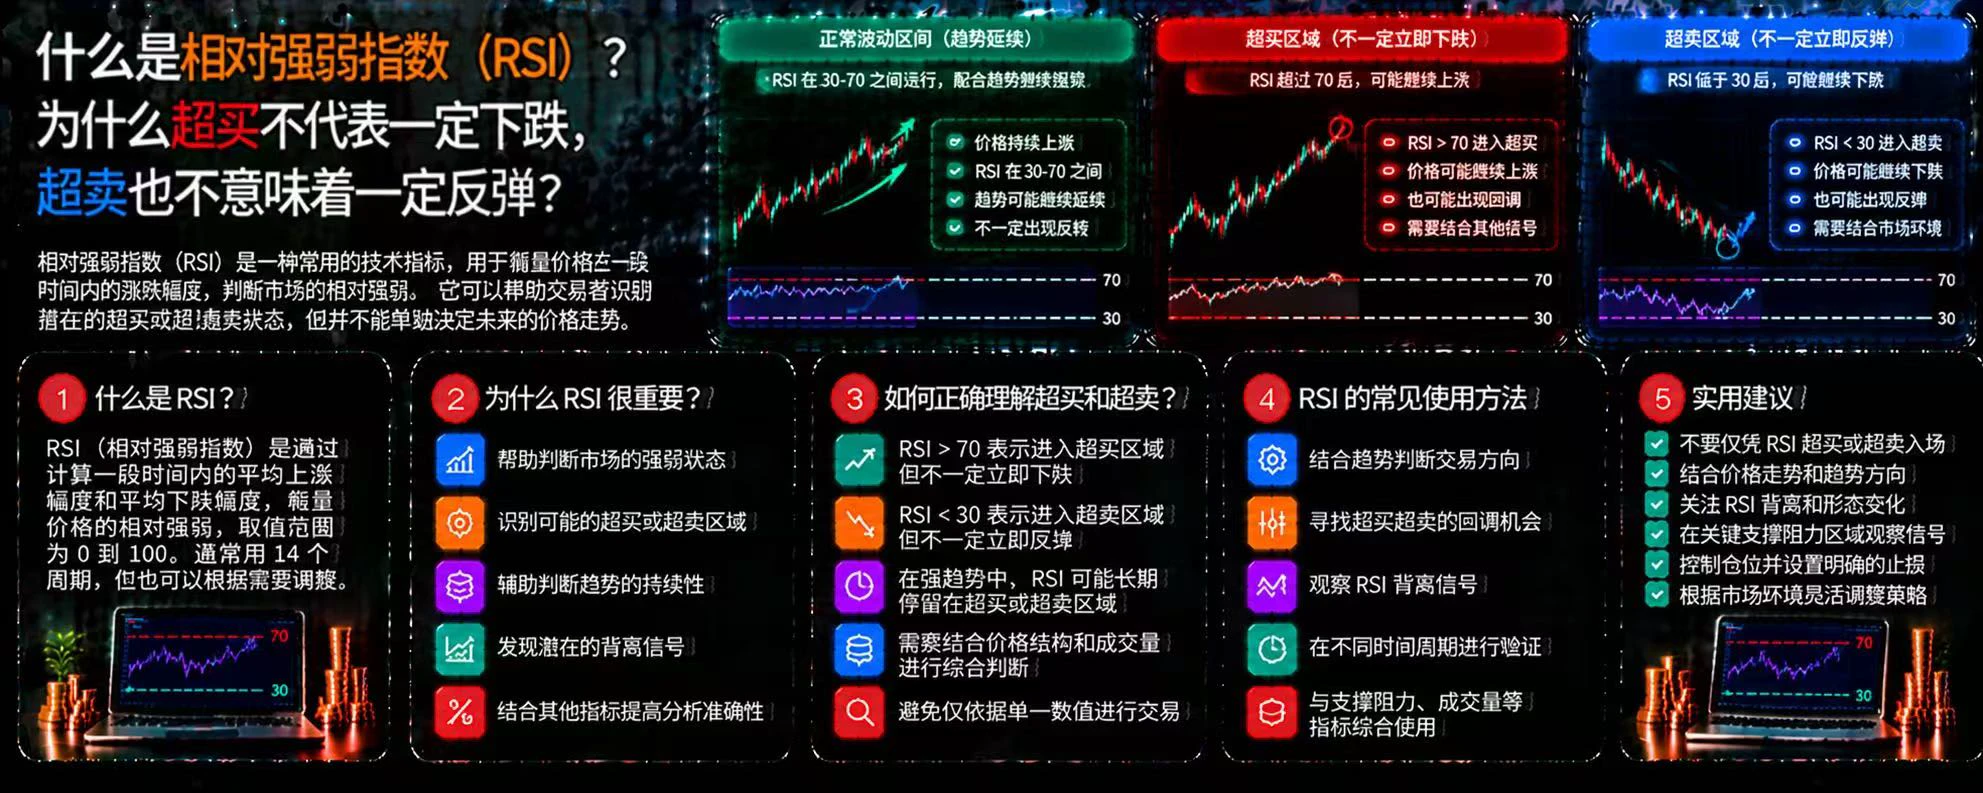
What Is the Relative Strength Index (RSI)? Why Doesn’t Overbought Mean It Will Definitely Fall, or Oversold Mean It Will Definitely Bounce?
In cryptocurrency trading, RSI is a common technical analysis indicator that can help traders observe price momentum. But many people see RSI rise above 70 and immediately go short, or fall below 30 and rush to buy the dip, only to see the opposite of what they expected. The problem is that the indicator reflects market conditions, not an inevitable price reversal.
First, what is RSI?
The Relative Strength Index (RSI) typically ranges from 0 to 100 and mea
post-image
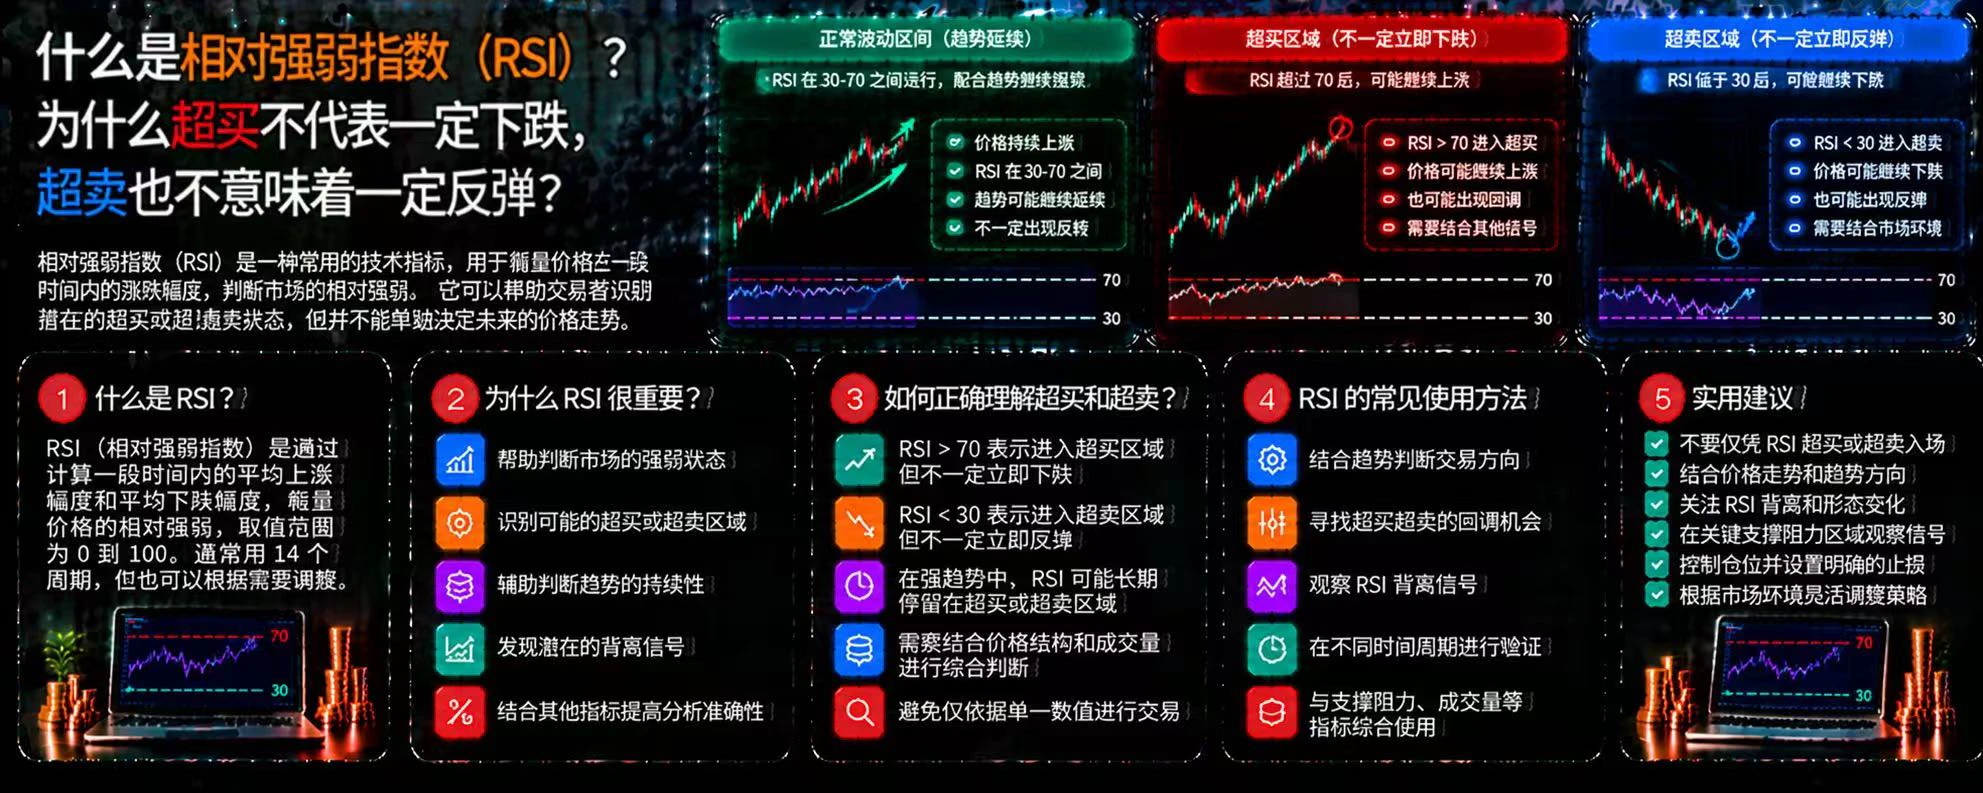
What Is the Relative Strength Index (RSI)? Why Doesn’t Overbought Mean a Drop Is Inevitable, or Oversold Mean a Rebound Is Certain?
In cryptocurrency trading, RSI is a common technical analysis indicator that can help traders observe price momentum. But many people see RSI rise above 70 and immediately go short, or drop below 30 and rush to buy the dip, only to see the market move against their expectations. The issue is that an indicator reflects market conditions, not an inevitable price reversal.
First, what is RSI?
The Relative Strength Index (RSI) typically ranges from 0 to 100 and measur
post-image
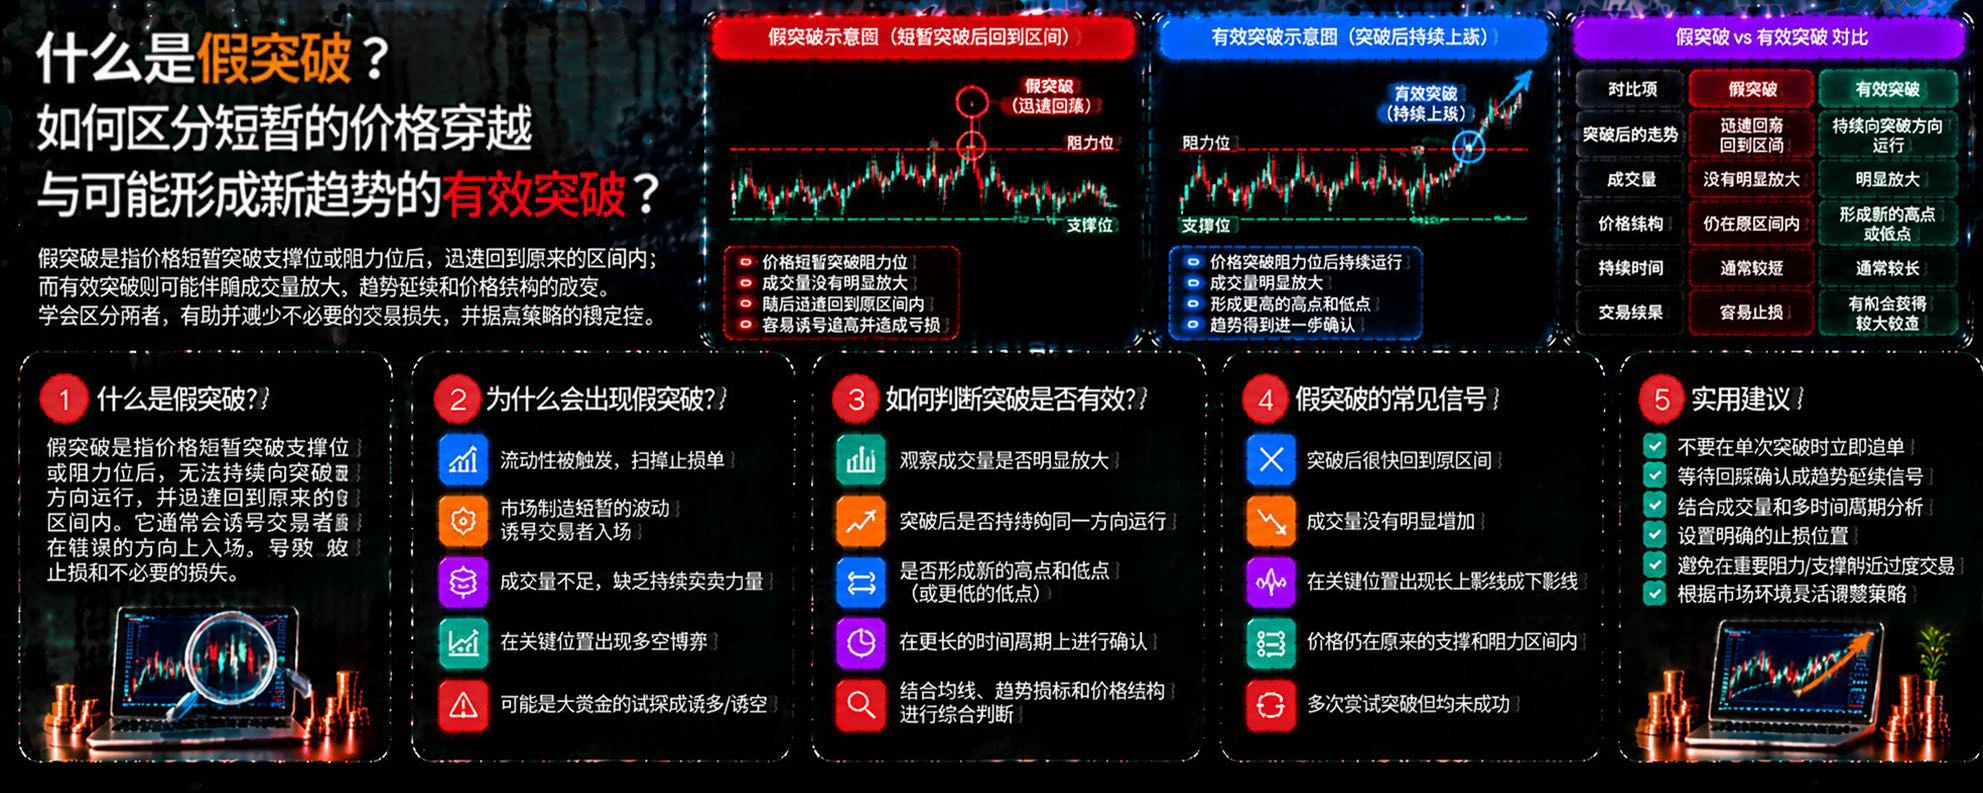
What Is a False Breakout? How Can You Distinguish a Brief Price Cross from a Valid Breakout That Could Signal a New Trend?
In crypto trading, many people immediately chase prices when they break above key resistance, and rush to short when they fall below support. But sometimes the price only briefly moves past a key level before quickly returning to its original range. This phenomenon is known as a false breakout, and it is one of the risks traders can easily overlook.
First, what is a false breakout?
A false breakout occurs when the price briefly breaks through support or resistance but fail
post-image
#SK海力士跌近7% #美股财报季 The decline in storage and AI chip stocks this time was mainly due to profit-taking after a strong rally, prompted by the U.S. midterm election results. Storage demand itself has not noticeably weakened; the market is reassessing the pace of AI data center construction.
On November 5, SK Hynix fell about 6.7%, while Samsung Electronics also dropped nearly 6%.
Why it looks more like profit-taking
Big gains and crowded positioning: SK Hynix and Samsung were the stocks with the largest net foreign selling this year, as investors rebalanced their portfolios.
Orders are still ther
SK Hynix-9.45%
  • 6
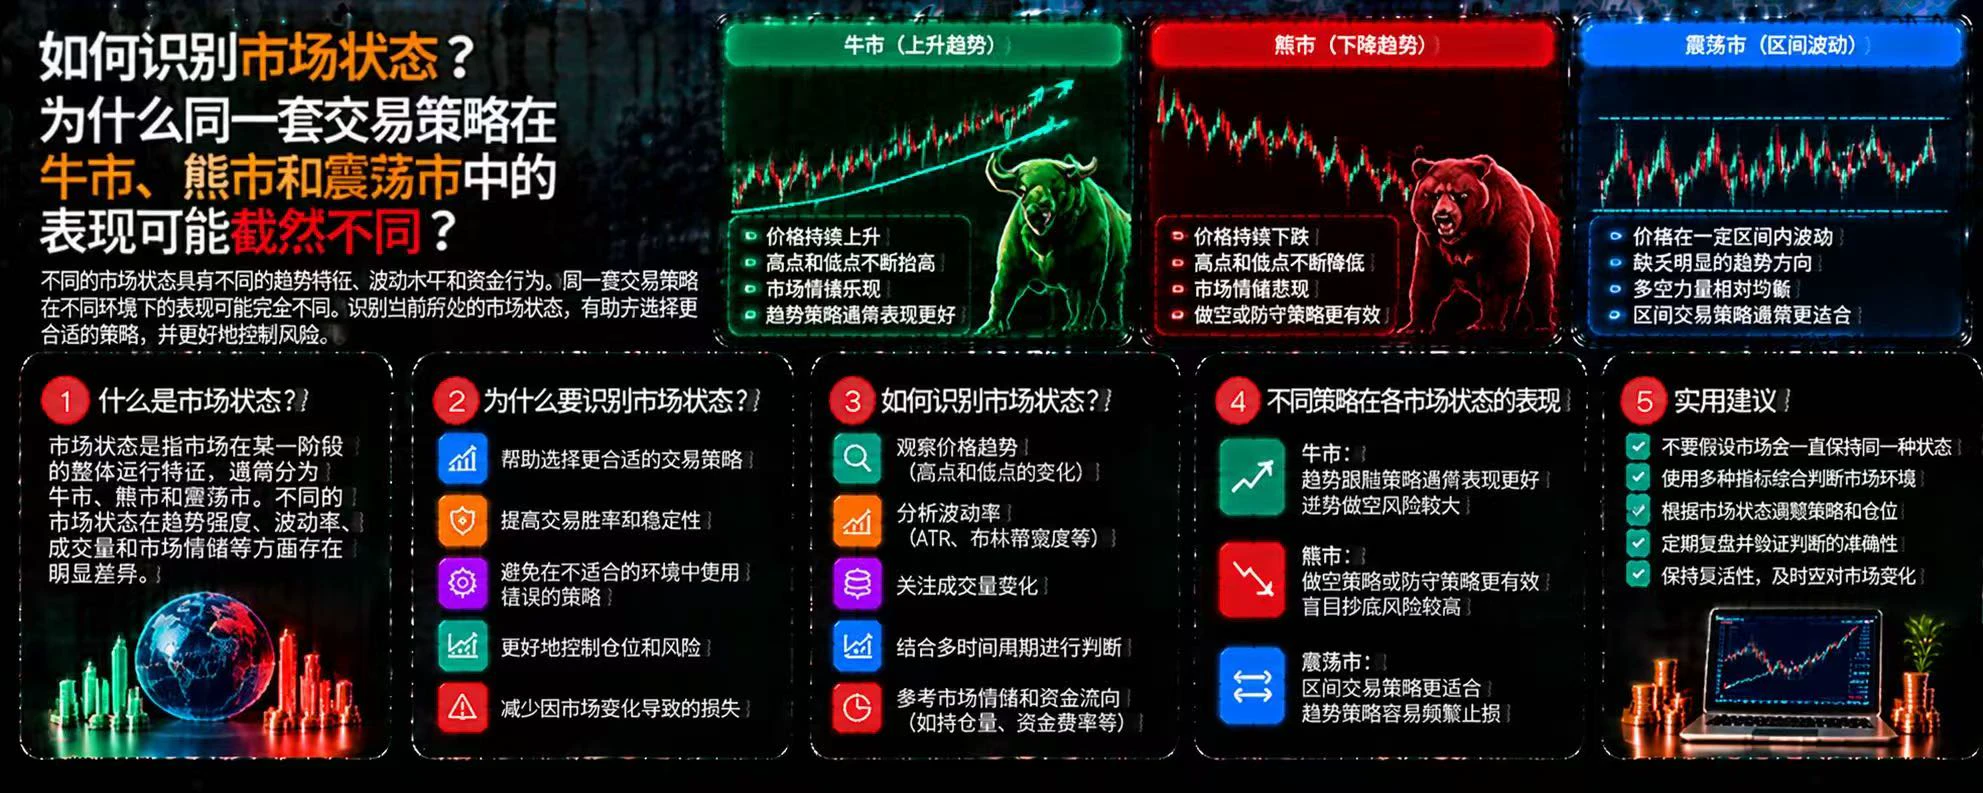
How can you identify market conditions? Why might the same trading strategy perform very differently in bull, bear, and sideways markets?
In cryptocurrency trading, many people look for a fixed strategy that can continue to generate profits no matter how market conditions change. But markets do not always operate in the same way. When trends, volatility, and capital flows change, the same strategy can perform quite differently.
First, what is a market regime?
A market regime refers to the overall characteristics of market behavior during a particular period. It is typically classified as a bul
post-image
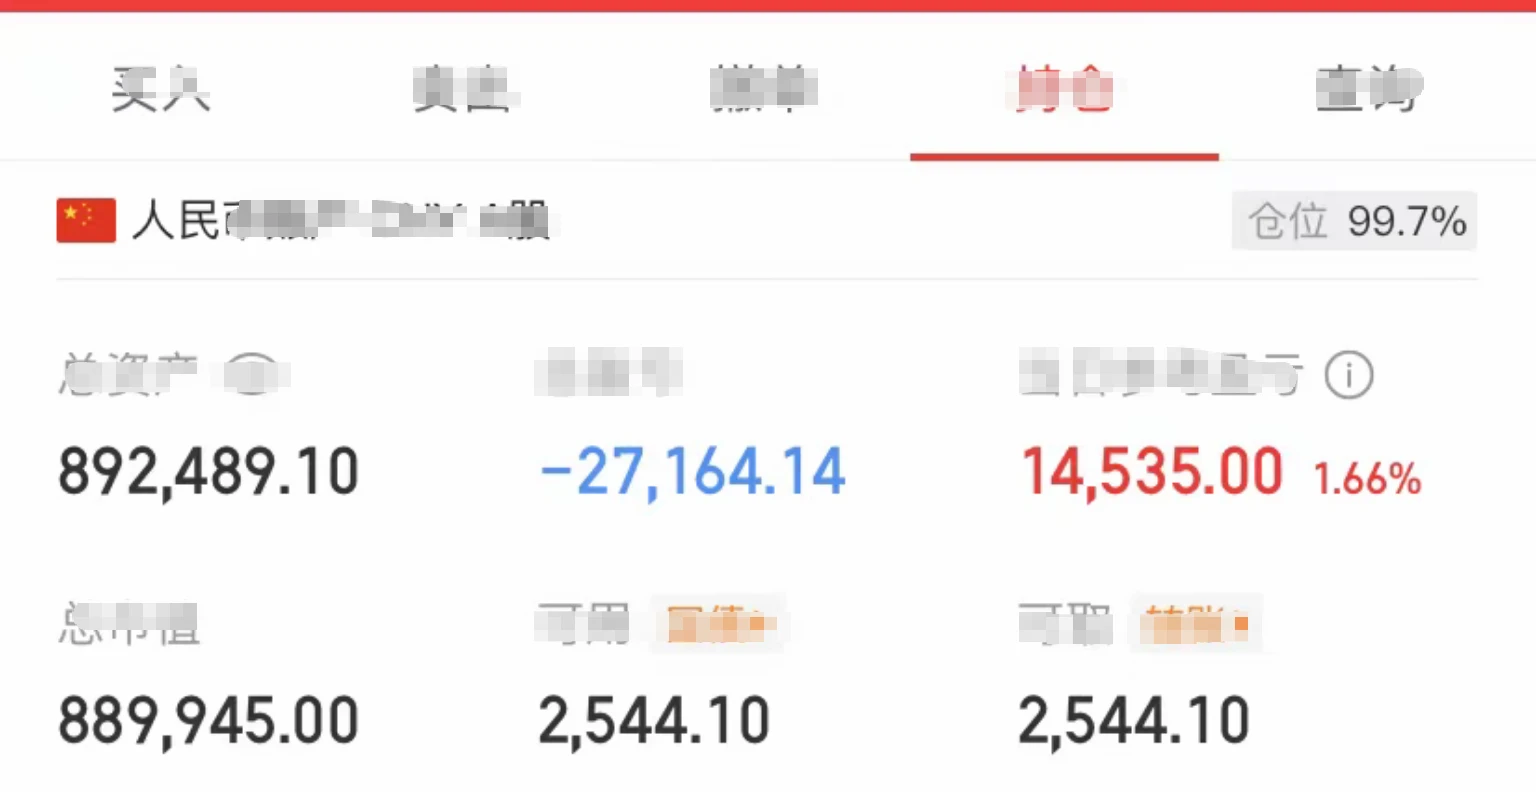
A-shares have stabilized and are now moving in the right direction. In this phase, try to avoid buying and selling back and forth or trading too frequently. If you pick the main theme, you can make a bit more; if not, you can still make a bit less. But if a position breaks down, you should still sell. My holdings are unchanged.
The midterm elections are not completely over yet, but the results are largely in. The Democrats will control Congress, which will act as a check on Trump’s policies going forward. U.S. stocks performed well last night. Previously popular stocks related to data center c
post-image
NVDA-3.03%
MRVL-6.98%
MSFT+6.76%
BTC-0.67%
  • 1
ONEA: We don't need you to trust us blindly; we'd rather you keep verifying us.
Recently, the community has raised many questions that deserve serious consideration: Where does development stand? How will the eight-year plan be put into practice? Can cross-border payments really work end to end? And how should contract permissions, liquidity, and real-world utility be assessed?
These questions should not be avoided.
I. A vision cannot replace delivery.
Discussing global payments and blockchain infrastructure does not mean that the relevant capabilities have already been implemented. Code repos
post-image
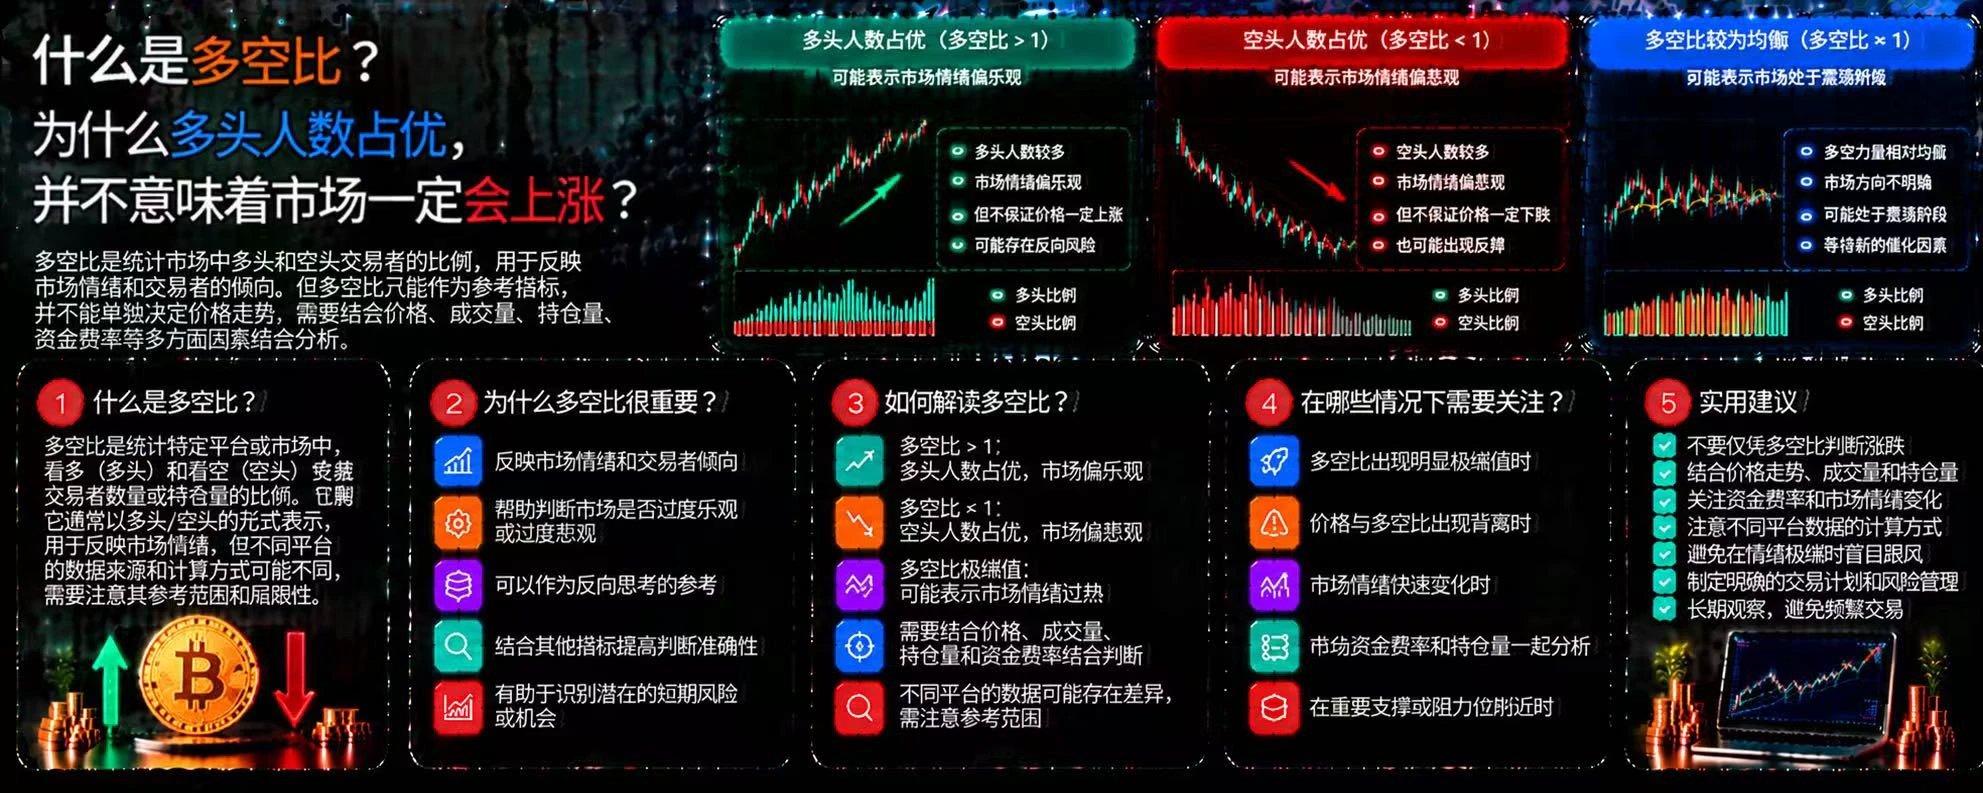
What Is the Long-Short Ratio? Why Doesn’t a Higher Number of Longs Mean the Market Will Definitely Rise?
In cryptocurrency trading, many people see the long-short ratio rise and assume bullish sentiment is strengthening, then choose to go long. But market sentiment and actual price movements do not always align. The long-short ratio can help us understand traders’ positioning bias, but it cannot directly determine how the market will move next.
First, what is the long-short ratio?
The long-short ratio measures the relative proportion of long and short positions in a particular market. However,
post-image
Big Tech Earnings Season: Invite Friends to Trade Stocks and Share $52,000 in MSFTG Rewards https://www.gate.com/campaigns/6745?ref=VLARBF1YAG&ref_type=132&utm_cmp=k1KckVOV
post-image
MSFTG+0.57%
  • 4
What Is a Liquidation Cascade? Why Can One Round of Forced Liquidations Amplify Short-Term Volatility in the Cryptocurrency Market?
In the cryptocurrency market, a rapid price decline can sometimes trigger the forced liquidation of more long positions. The resulting selling pressure may push prices down further, triggering another round of liquidations. This mutually reinforcing process is called a liquidation cascade.
First, how does a liquidation cascade form?
When losses mount for traders using leverage and their margin becomes insufficient, trading platforms may forcibly close their positi
post-image
$CLANKER That rejection at $27 was no joke—the bears are taking action. Everyone, we saw CLANKER briefly surge toward $27, but after a sharp drop, look where it is now: down to around $17.15. Market momentum has shifted. Buyers are struggling to reclaim lost ground, and I’m watching for the next short opportunity. Short plan: - Entry: $17.30–$17.80 on resistance - First target: $16.50 - Second target: $15.50 - Third target: $14.50 - Stop-loss: $18.50 If sellers hold this range, the price could drop again. Everyone, don’t get emotionally attached to any coin. Trade the chart! Wait for confirma
post-image
CLANKER-1.33%
BTC, ETH, GT, XRP, DOGE
live-cover
LIVE1,389
📡 Signal Card | Source: BlockchainBaller
Asset: $AIN Short position | Time: Not specified | Entry: 0.275 | Stop loss: 0.295 | Targets: 0.265 / 0.2602 / 0.245
Funny enough, I reposted this person's $UAI trade earlier today, and here they are again—quite active 👀
I just repost signals; the signal is someone else's, but the wallet is your own. Whether to follow and how small a position to take is up to you all 🫠
For personal record-sharing only; this is not investment advice. #AI Giant Financing Watch: Microsoft and Meta issue a combined $40 billion in bonds.
AIN+3.85%
UAI-7.58%
MSFT+6.76%
Many media outlets are like this nowadays, making things up and stirring up controversy
post-image
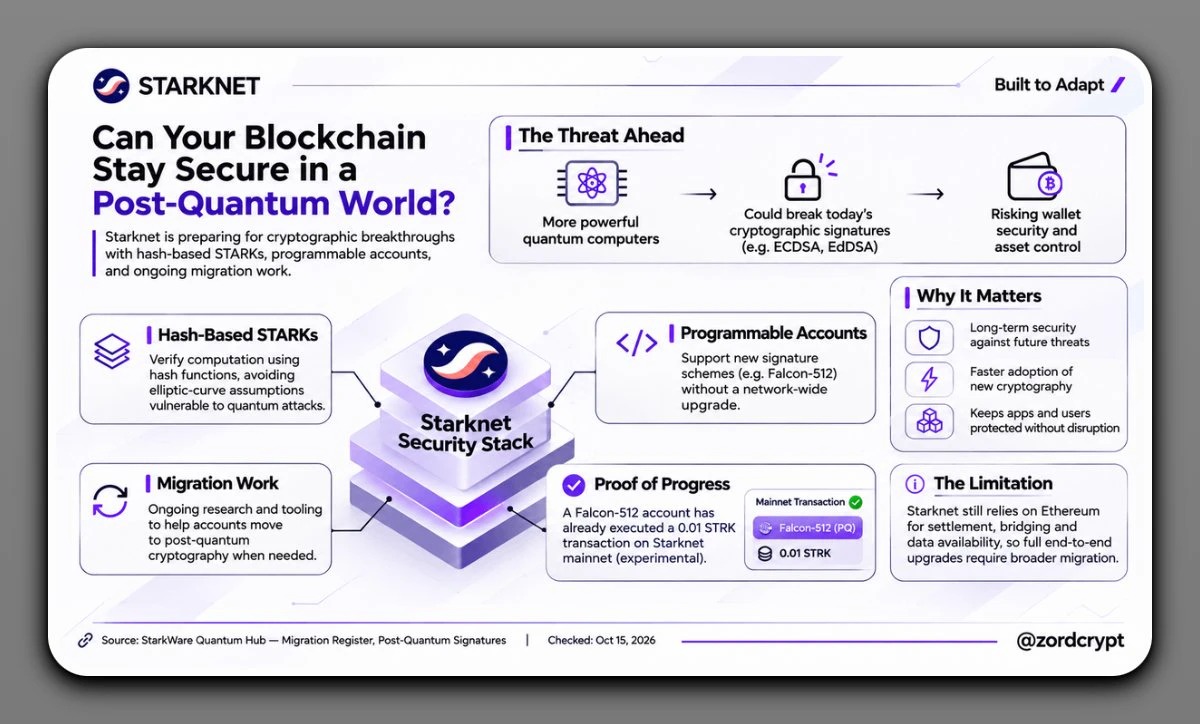
What happens if AI discovers a faster way to break the cryptography protecting your crypto wallet?
The uncomfortable part isn’t just the discovery.
It’s how quickly your blockchain can respond.
This is the security problem @Starknet is preparing for.
Its architecture has two advantages:
• Hash-based STARK proofs avoid relying on elliptic-curve hardness for computation verification.
• Programmable accounts can adopt new signature verification methods without requiring a network-wide protocol upgrade.
There’s already practical evidence:
A post-quantum Falcon-512 account has executed a transactio
post-image
STRK-3.55%
ETH-1.26%
Good Morning Frens!🌤☕️
post-image
Load More

Join 40 M users in our growing community

⚡️ Join 40 M users in the crypto craze discussion

💬 Engage with your favorite top creators

👍 See what interests you

Trending Topics

GateLaunchesPoSECProofOfSecurity

543 Views457 Discussing

Gate has officially launched Proof of Security, or PoSEC, extending beyond Proof of Reserves by disclosing the distribution of cold-storage and hot-wallet assets and introducing a cold storage coverage ratio to measure protection under extreme-risk scenarios. Gate’s latest cold storage coverage ratio stands at 104.58%, with 88.26% of assets in cold storage and 11.74% in hot wallets. A coverage ratio of at least 100% means cold-storage assets alone would still be sufficient to cover all user assets even if hot-wallet assets were fully lost. Exchange security is not only about whether reserves are sufficient, but also how assets are stored and protected under extreme conditions. Could cold storage coverage become a new industry standard?[👉 Learn more](https://gate.com/proof-of-security)

BTCBackAbove80K

51.64k Views41.3k Discussing

DemocratsWinBothChambers

20.49k Views465 Discussing

View More