Square
Following
Hot
News
Notifications
Profile
Share your thoughts
placeholder
Article
🔹 Abraxas Capital bought $897 million worth of BTC during the market downturn.
live-cover
LIVE1,534
SPCX-7.38%
TSLA-7.56%
NVDA-13.84%
🔹 Ethereum(ETH) Surpasses 1,700 USDT with a Narrowed 1.69 Decrease in 24 Hours
live-cover
LIVE3,489
BTC-0.65%
ETH-1.23%
SOL-0.74%
BTC-0.67%
SOL-0.77%
Trenches
IDOL
I
bade
b
IDOL
0x3b...ab07
Market Cap
$.
Change
.
24h Vol
$.
Holders
.
JAGENT
J
bade
b
JAGENT
0x8e...ae15
Market Cap
$.
Change
.
24h Vol
$.
Holders
.
PIEVERSE
P
bade
b
PIEVERSE
0x0e...25a9
Market Cap
$.
Change
.
24h Vol
$.
Holders
.
FIONA
F
bade
b
FIONA
B34n...pump
Market Cap
$.
Change
.
24h Vol
$.
Holders
.
mihao
m
bade
b
mihao
4Cxj...pump
Market Cap
$.
Change
.
24h Vol
$.
Holders
.
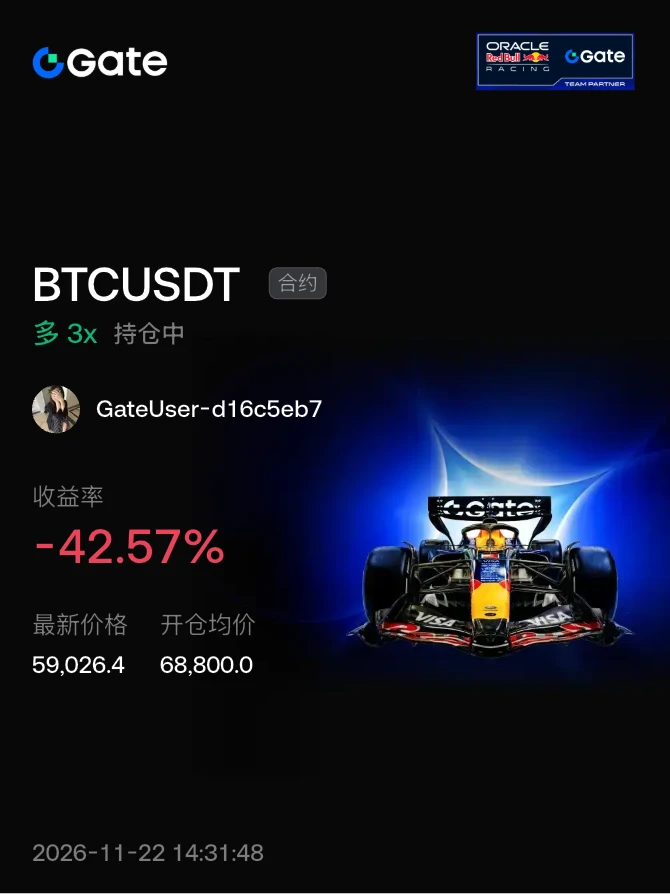
#晒出我的持仓收益 Can I still break even on this BTC?
post-image
BTC-0.65%
$PIEVERSE I’ve gone over this asset several times, and its weekly chart pattern really holds up. The market maker has a strong sense of timing, pushing it higher steadily without rushing. Each pullback has basically offered a chance to get in, so buying the dips seems reasonable. The initial target is around 5. $PIEVERSE
Risk warning: The above is only my personal review and does not constitute investment advice. Contract trading carries extremely high risk, so please be sure to manage your position size.
post-image
PIEVERSE+0.58%
$IDOL It plunged from 0.0480 to 0.0164 in one day, falling nearly 30%, with a trading value of 480 million. This kind of price action is completely different from a coin that slowly bleeds lower.
First, look at the size and pace of the drop. $IDOL happened entirely in a single day, like slamming on the brakes; with a slow bleed, the price drops a little every day, wearing you down. They hurt in different ways: the first hurts in the moment, while the second tests your patience.
Next, look at trading activity. Nearly 500 million in trading value in a single day means tokens are changing hands
IDOL-6.71%
  • 1
  • 2
$AKE All targets have been successfully reached 🥳🥳TP1 0.004800: hit ✅TP2 0.004400: hit ✅TP3 0.004000: hit ✅The relentless downtrend played out exactly as expected. Highs kept getting lower, lows kept breaking down, and buying volume was almost zero, unable to stop the decline. All targets have now been reached. Huge congratulations to everyone who went short and successfully hit all three targets! 🥂What to do now: • Already in profit? Lock in gains and actively trail your stop-loss. • Missed it? Don’t chase the short at the bottom out of fear of missing out. Wait for a dead cat bounce befo
post-image
AKE+6.07%
$FIL is currently attempting to reclaim the dense moving-average zone, but overhead pressure remains evident, with bears waiting near the resistance band for another entry opportunity.
Execute a short strategy on $FIL : Entry order zone: 0.5122 - 0.5165 First take-profit target: 0.4902, with 0.4709 as the next target Stop-loss: 0.5320
Note that if the price breaks decisively above 0.5160, the bearish thesis above will no longer hold, and the market may shift into a rebound structure.
Remember not to go all in with a large position; size your position appropriately based on your account size.
post-image
FIL-2.00%
On the 4-hour chart, $SOL short from 68.8. Sellers must hold here. Price is approaching resistance. I want to see a rejection wick, not sideways chop within the zone. If the close is above 69.7, I’ll abandon this idea. On the 4-hour chart, price is 68.8, below the 73.3 EMA50, so sellers remain in control of the trend. The stop distance is 1.3%, and the TP3 target distance is 2.1%, for a 1.6R risk/reward ratio if reached. Short zone 68.70–68.85 | Targets 68.24, 67.88, 67.34 | Stop 69.67 Not investment advice · Do your own research
post-image
SOL-0.77%
#USNOVJoblessClaimsBeatExpectations

WHY A 1,000-CLAIM TICK IN NOVEMBER CHANGES THE LABOR PICTURE

Earlier in the autumn of 2026, U.S. initial jobless claims dipped as low as 189,000—matching a multi-decade low—and kept headline fears about layoffs quiet. Now, following the U.S. Department of Labor report released on November 19, 2026, seasonally adjusted initial claims rose by 1,000 to 203,000 for the week ending November 14, above consensus estimates around 197,000 to 198,000. That small move from recent lows to a slightly higher-than-expected reading is the kind of shift markets watch clos
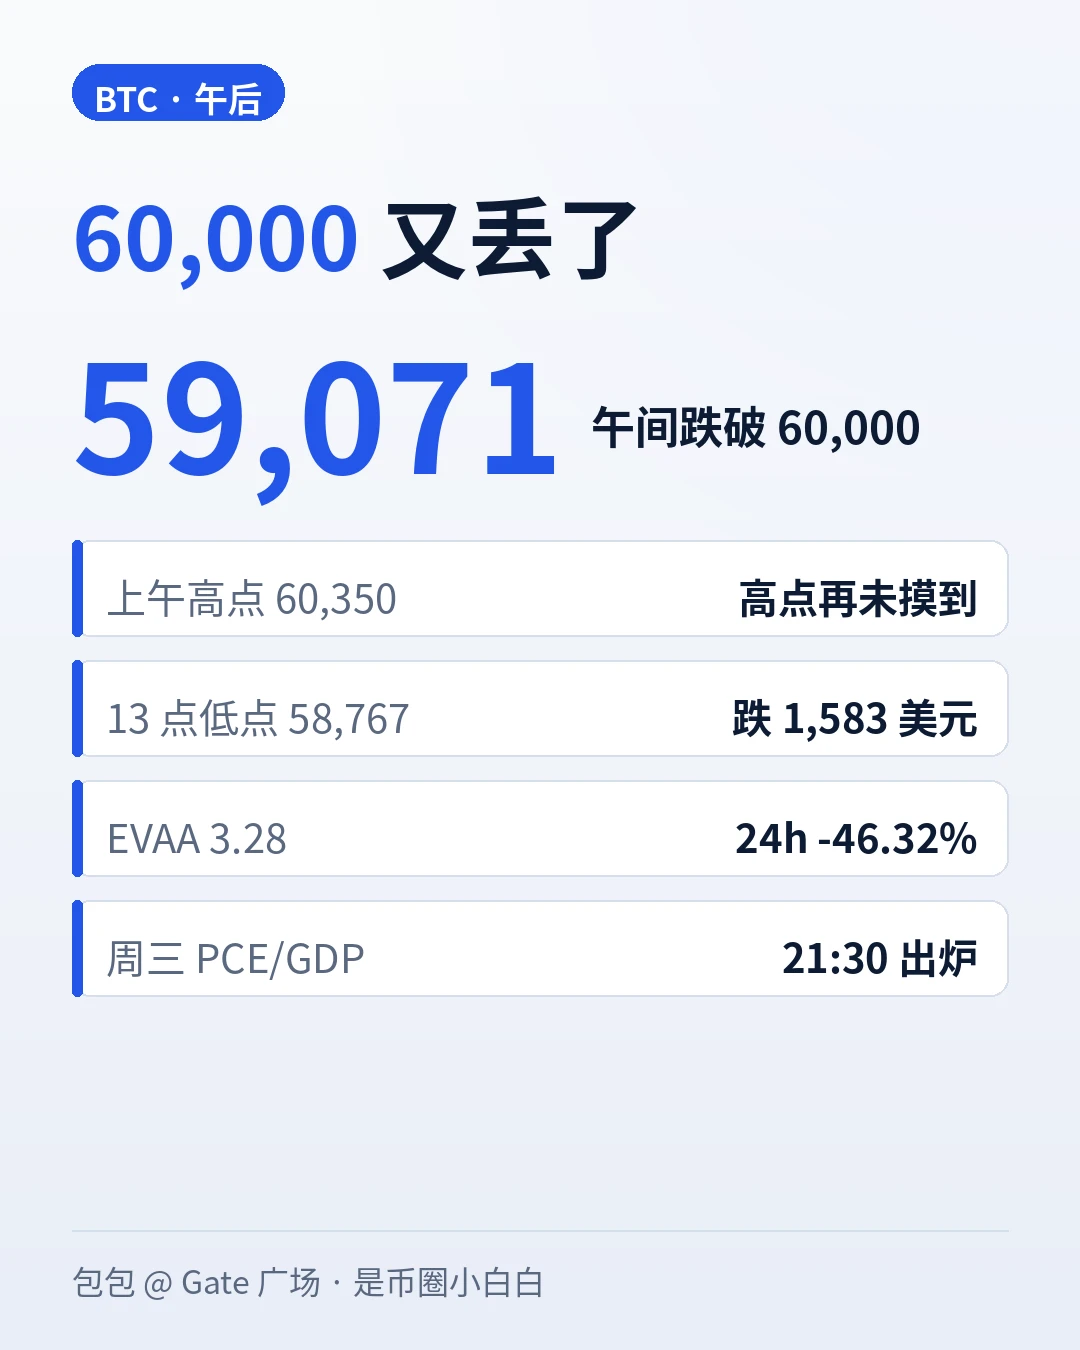
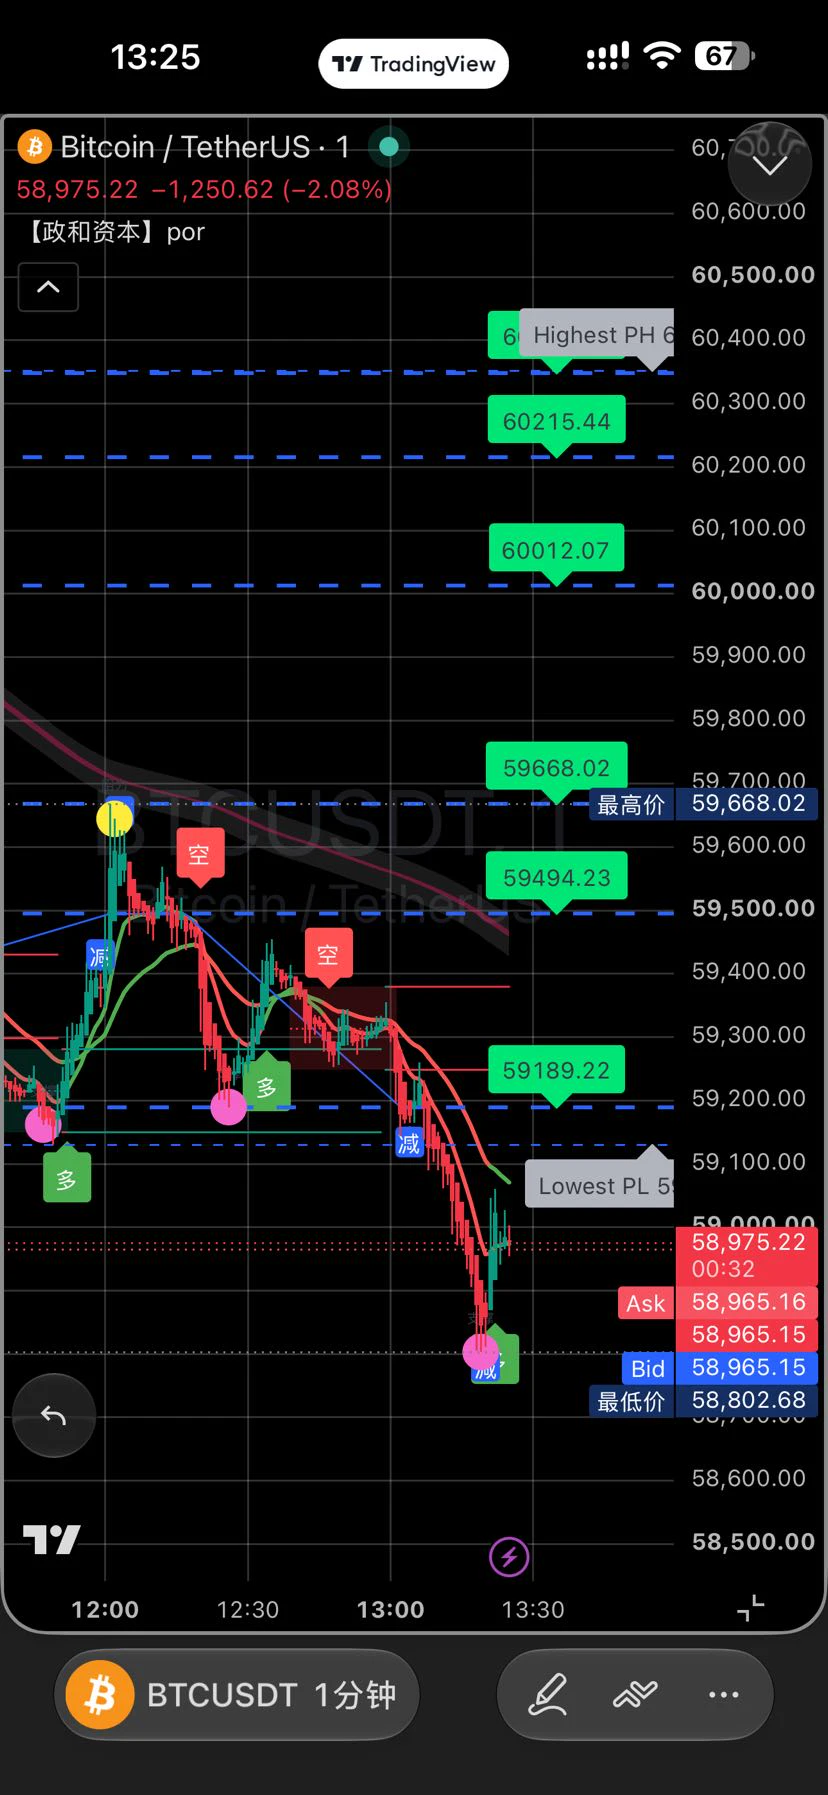
The 10:30 a.m. post asked, “Which breaks first, 60,350 or 60,016?” The answer: 60,016. The 10 a.m. hourly candle plunged straight to 59,421, taking out 60,000 on the same candle, and the low reached 58,767 at 1 p.m. My take: the rebound has run out of momentum. This afternoon’s move isn’t a pullback; it’s a second leg down. #BTC反弹后再争6万美元关口
Let’s tally up the midday numbers: BTC is now 59,071, versus 60,064 when I posted at 10:30 a.m.—a drop of $994 in four hours. From the morning high of 60,350 to the 1 p.m. low of 58,767, it fell $1,583. Hourly closing prices kept moving lower: 59,499 at 10
post-image
How is BTC more likely to move after Wednesday's PCE/GDP data come out?
Hot data, rate hike confirmed, the market continues lower
Data cools, 60,000 reclaimed
Data is in line with expectations, with sideways trading and bottoming while awaiting the December decision
2 Participants
Ends In 23 Hour
BTC-0.67%
ETH-1.26%
SOL-0.77%
EVAA-0.49%
ANT-8.68%
Now, every day the group says it’s “up” again!
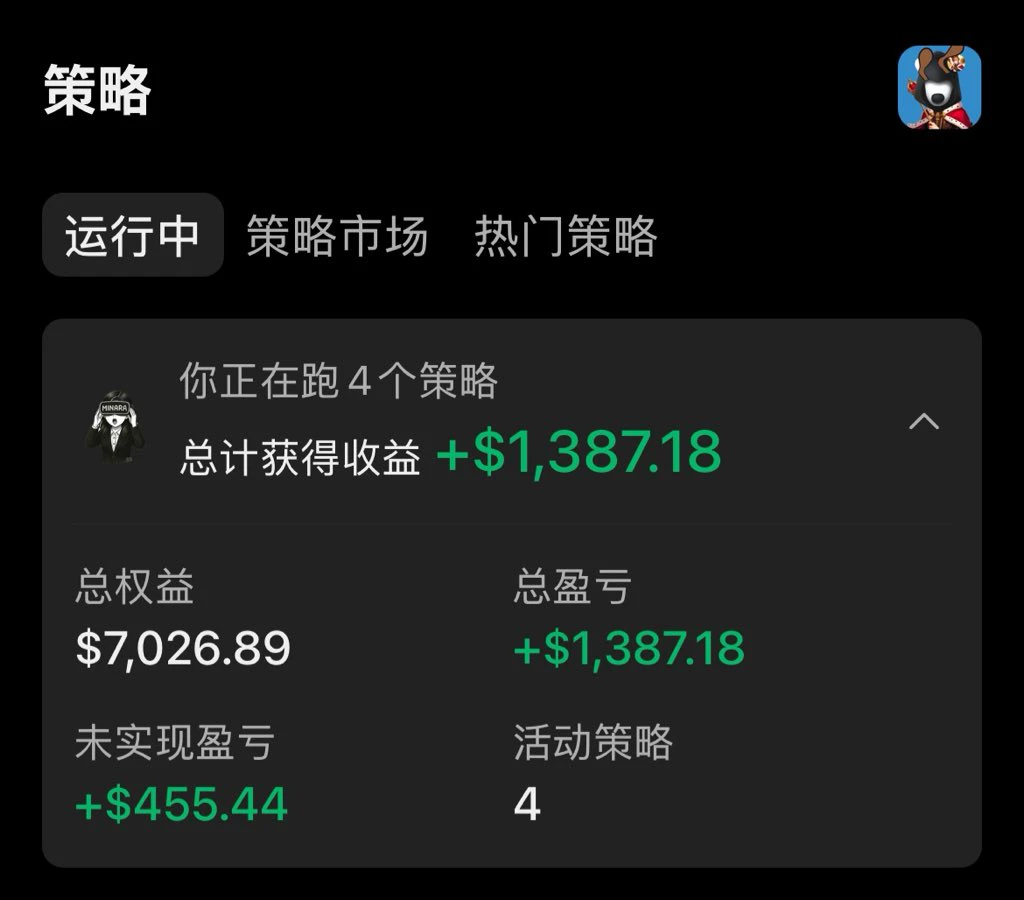
I haven’t traded manually in ages. AI has taken over my work and is even better at trading than I am. I just open my phone every day to check my profits!
I’ve got four AI strategies running right now, and they’re all profitable! But that’s not my end goal. Next, I’ll research new ways to make money, all using AI!
I’m going to make money with AI—that’s the only way to justify all the tokens I’m burning!
post-image
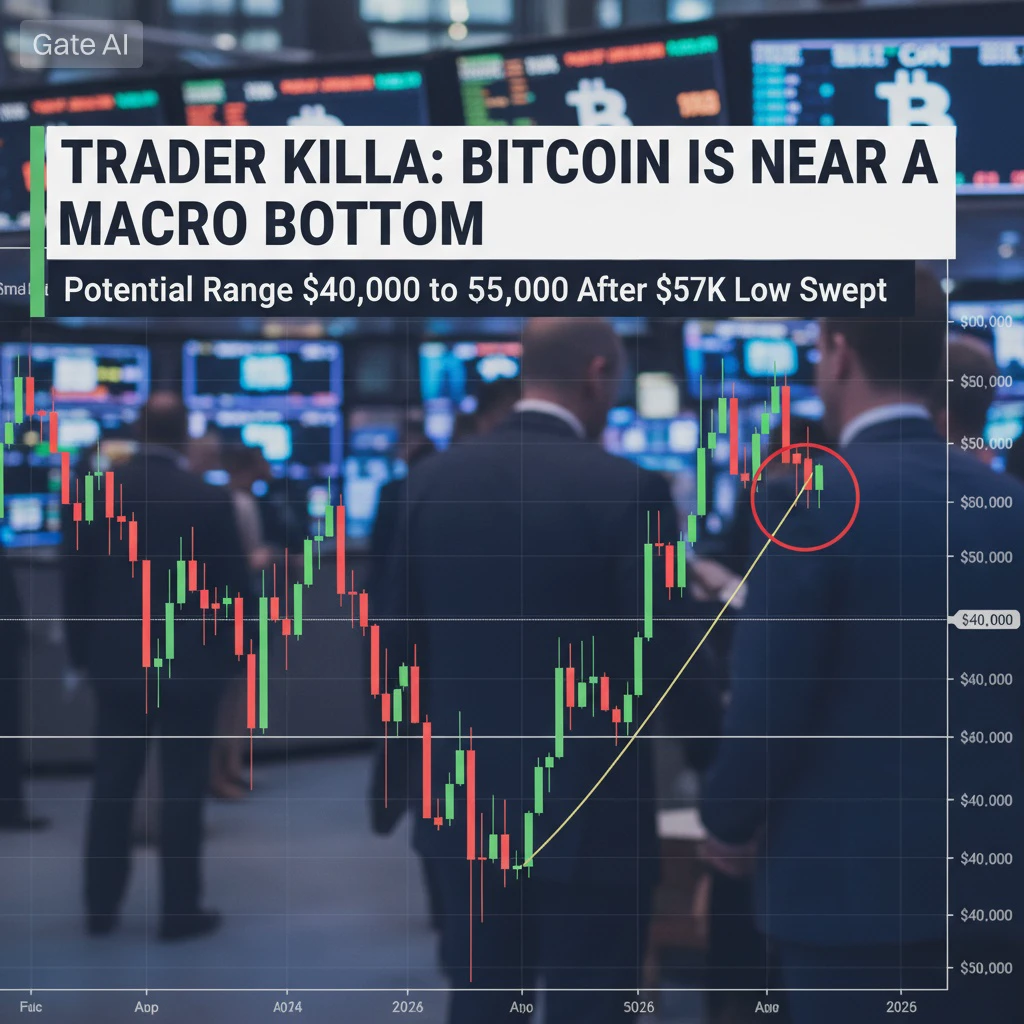
Trader Killa: Bitcoin Is Near a Macro Bottom — Potential Range $40,000 to $55,000 After $57K Low Swept
In the middle of one of Bitcoin’s sharpest drawdowns in recent years, quantitative trader Killa (@KillaXBT) has stepped forward with a clear, data-driven take that is cutting through the noise. Despite the current cycle running longer than previous ones, he argues Bitcoin is still tracking the classic four-year cycle pattern. More importantly, he says 81% of historical cycle metrics are now flashing that a macro bottom is close.

His key message: now that the $57,000 low has been swept, Bitc
post-image
BTC-0.67%
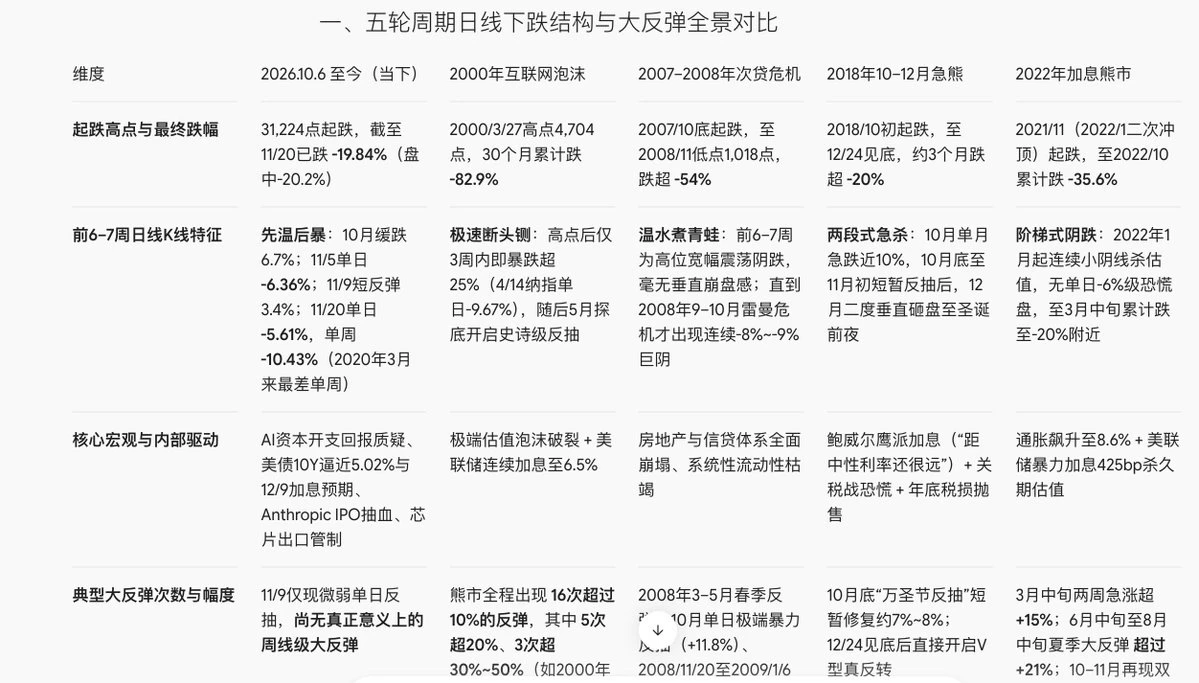
Comparison of the decline from NAS100’s October 2026 peak with declines beginning at the 2000, 2007, 2018, and 2022 peaks.
1) Speed of decline: The second-fastest of the five, numerically close to 2022.
2) Rally before the peak: On the same scale as 2007, 2018, and 2022, lacking the parabolic rise of 2000.
3) Candlestick pattern similarity: Most similar to 2018, but the differences among the four comparisons are small.
4) Subsequent moves: The decline in the first 33 days cannot determine the final depth; markets keep extending and evolving.
The current decline is close to the path of the Q4 2
post-image
NAS100-0.07%
$BTW This is its heaviest overhang.

Total supply is 10 billion tokens, with about 1.51 billion in circulation—just 15%. Its market cap based on circulating supply is only around $1 billion, but based on total supply it’s $6.8 billion, more than 6 times higher.

Of the 85% not yet released, the portions allocated to the team, investors, and ecosystem are still being unlocked monthly. Each unlock adds another batch of extremely low-cost tokens to the market. This happened in October: as soon as an exchange holding campaign ended, it fell 49% before later rebounding.

There’s also heavy overhead
post-image
BTW-7.75%
AKE+6.39%
$EVAA It’s down nearly 40% in 24 hours. This doesn’t look like a technical correction—it feels like a real drop, not a fake one
post-image
EVAA-0.49%
November 22, 2026 (Sunday) BTC Futures Analysis for Today (based on the current range of approximately $59,000–$60,000)
Key view (bearish, oversold rebound)
BTC has fallen sharply from above $75,000, touching near $55,000 over the past two days before rebounding to around $60,000. The daily structure remains bearish, and the RSI is in oversold territory. A short-term technical rebound is possible, but there is clear resistance above. Sunday liquidity is low, so the main strategy is to short rebounds, with buying support pullbacks as a secondary option; keep positions light.
Today's Strategy
1.
post-image
BTC-0.65%
I love Shenzhen's weather so much; it's not cold at all.
Everyone here loves working out~ They're not only grinding to make money but also grinding to stay healthy—impressive in every way.
When it comes to P-background, GPT is still the only one I respect.
post-image
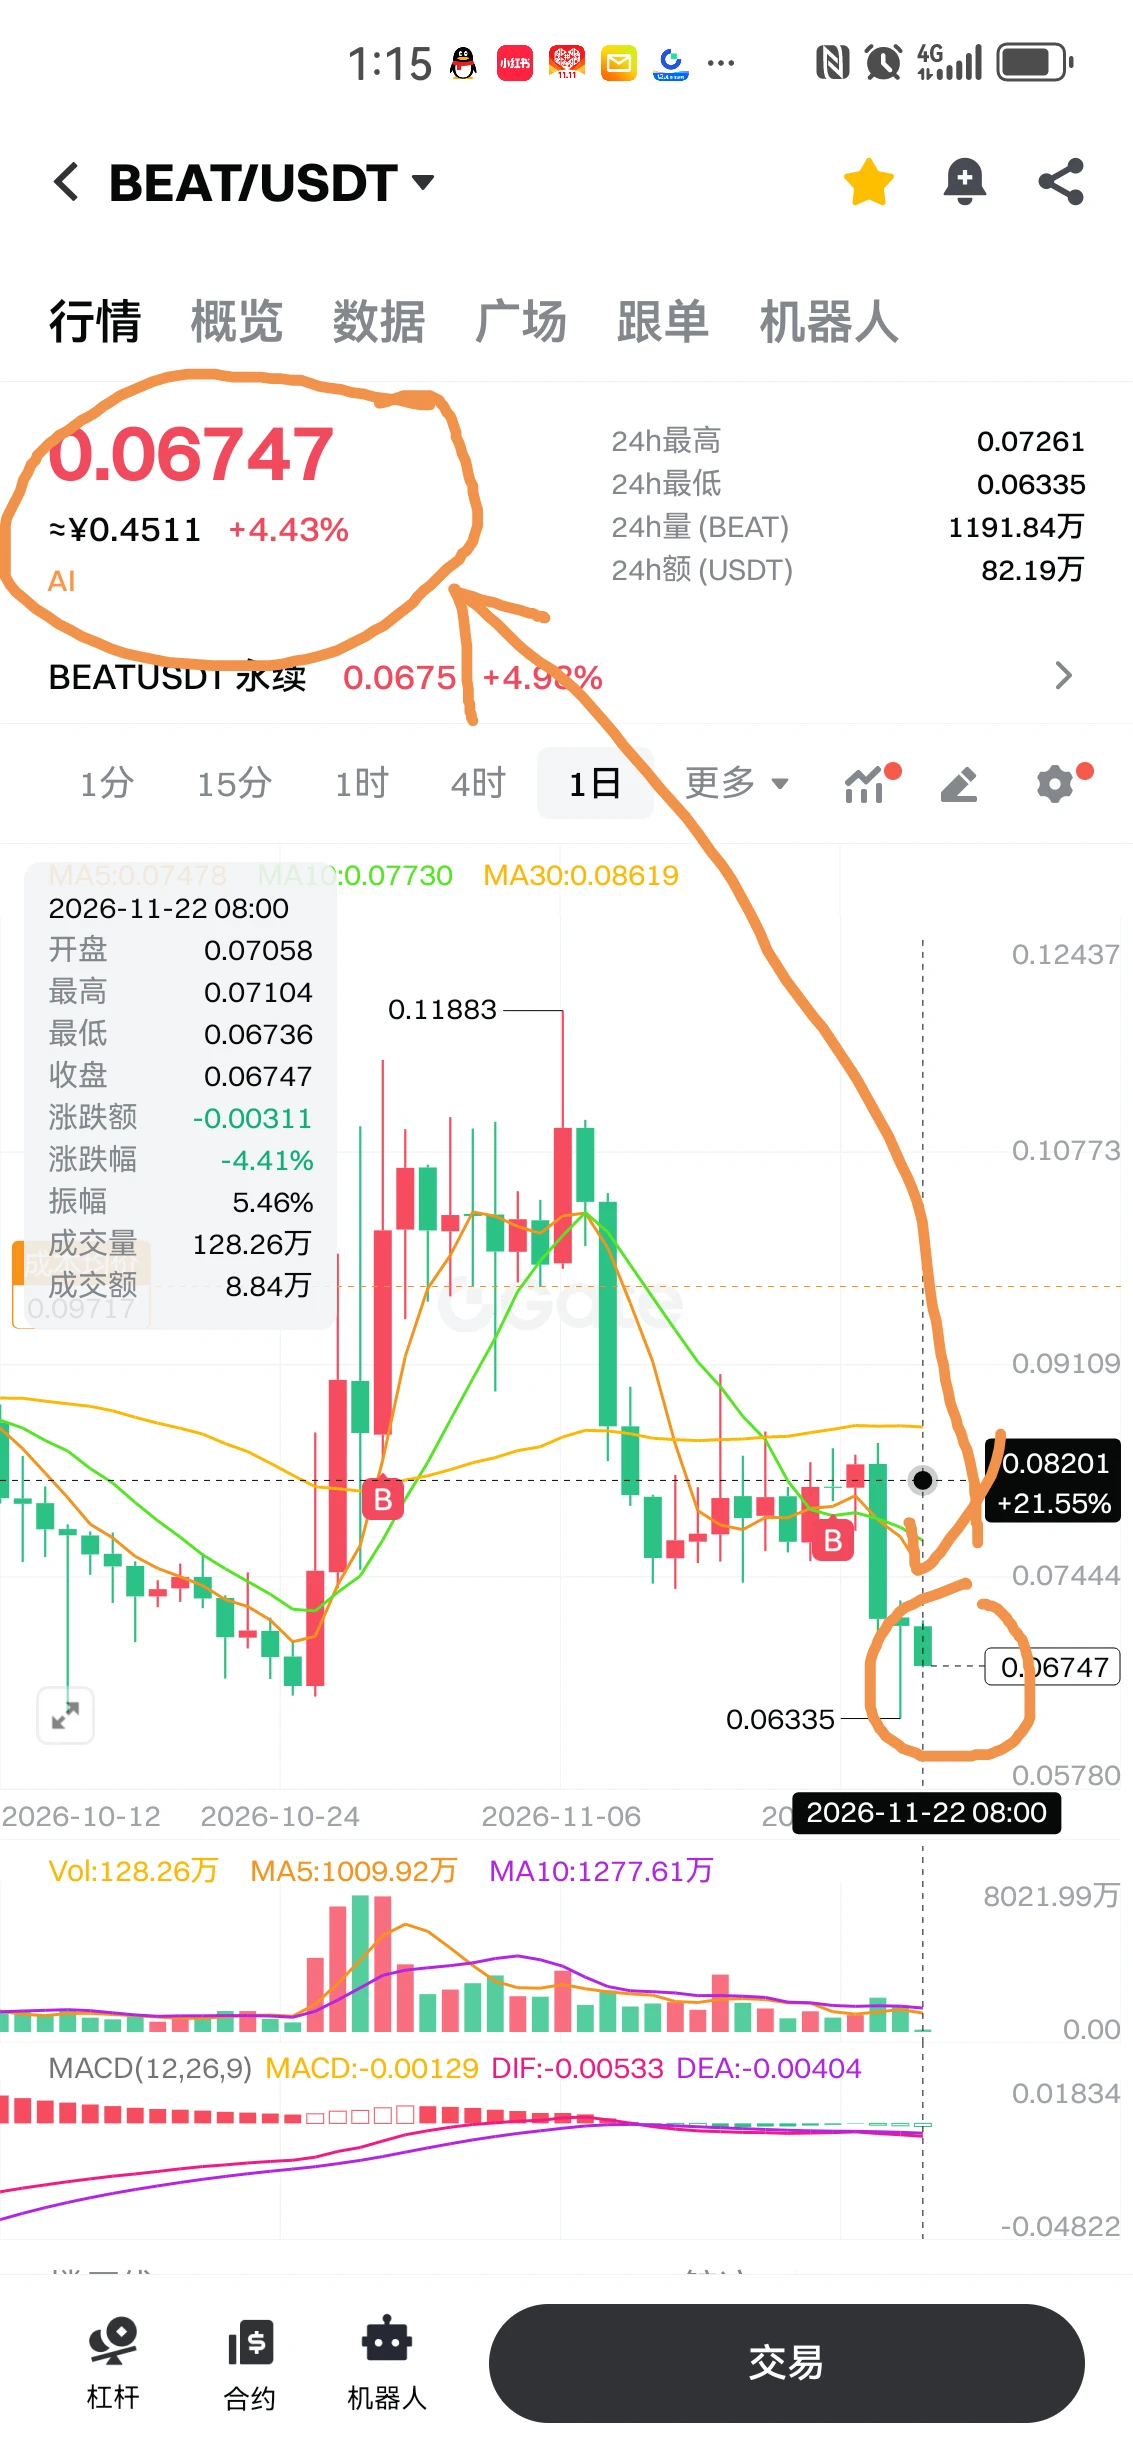
#BEAT It's clearly down, so why is it showing a gain? I don't get it. Everyone, leave a comment
post-image
BEAT-1.19%
🇺🇸 US TREASURY ISSUES FIRST 9-DAY BILL SINCE 2008!
The Treasury sold $15B in short-term bills at a 3.91% rate to cover a temporary cash gap.
A rare move highlighting pressure on US government cash flow!
post-image
$SUI 0.6379, up 6.25% over 24H. It’s climbing fast, but the 1h/4h trend is still weak, volume is only 0.5x average, and RSI is still near oversold. 0.6551 above is the 24H high; don’t expect it to hold without a volume surge. 0.5882 below is the real support—if it breaks, the short-term momentum will be completely disrupted. Keep an eye on these two levels and wait for the market to pick a direction. Not investment advice.
#SUI #Sui
post-image
SUI-1.05%
Load More

Join 40 M users in our growing community

⚡️ Join 40 M users in the crypto craze discussion

💬 Engage with your favorite top creators

👍 See what interests you

Trending Topics

BTCReboundFaces60KTest

2.1M Views30.1K Discussing

BTC rebounded from around $55,300 on November 21, briefly reclaiming $60,000 before pulling back to around $59,300. The $60K level is back in focus as traders assess whether the recovery can last. Is this rebound a sign of stabilization or a short-lived recovery? Would reclaiming and holding $60K be enough, or do you need confirmation from trading volume and fund flows?

PCEAndGDPDataNextWeek

258.2K Views2.6K Discussing

GateDirectIPOPhase3ANTAllocates92100Shares

817.6K Views5K Discussing

View More