



Square
Following
Hot
News
Profile
Share your thoughts
placeholder
Article
$ETH It bounced and you still won't exit? That's asking for trouble
post-image
ETH-1.26%
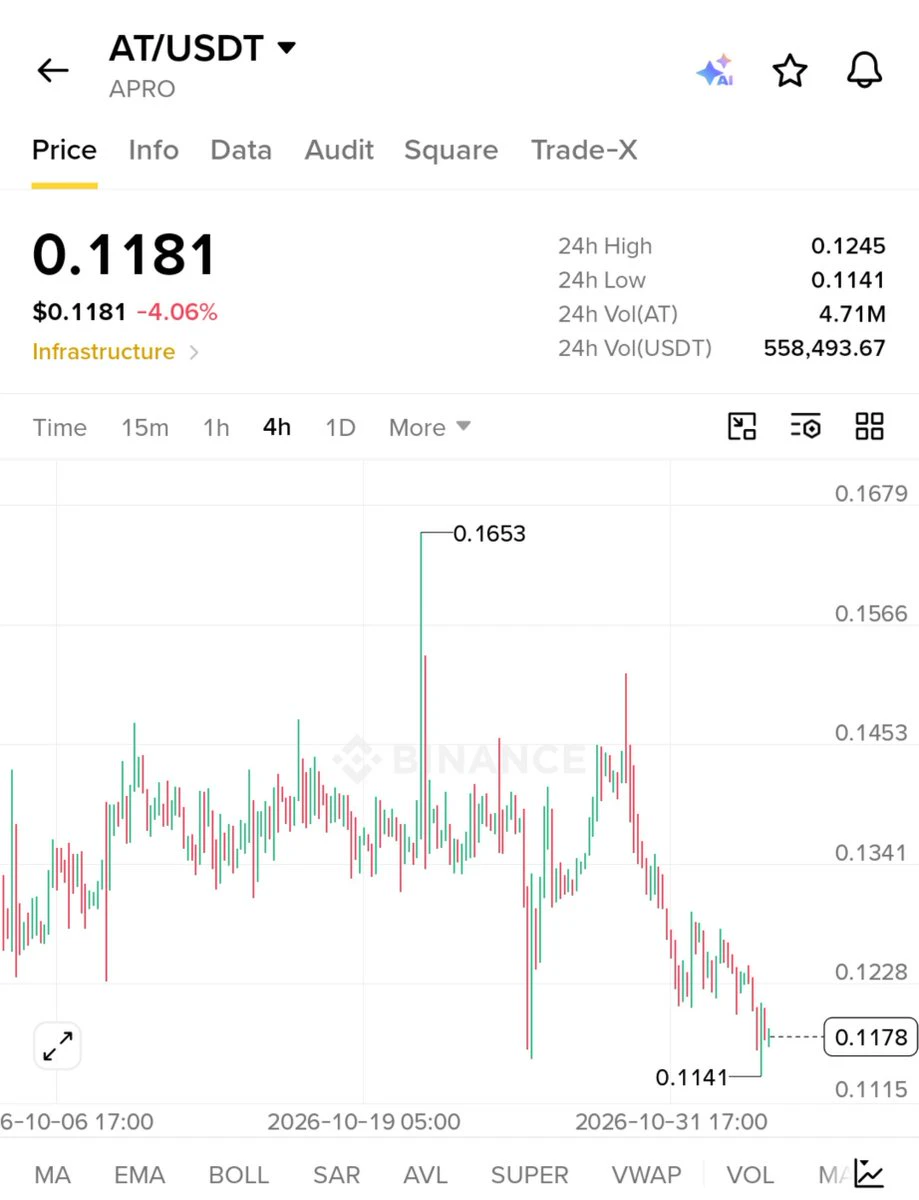
📉 $AT /USDT Market Update
- AT is trading near $0.1181, showing selling pressure.
- Price recently dropped from higher levels.
- Support is around $0.1141.
- Bulls need strength to recover.
- Watch for a breakout or further downside before entering.
post-image
AT-5.64%
Trenches
ZIG
Z
bade
b
ZIG
0x8c...1145
Market Cap
$.
Change
.
24h Vol
$.
Holders
.
STONK
S
bade
b
STONK
6GmA...UNgx
Market Cap
$.
Change
.
24h Vol
$.
Holders
.
AMD
A
bade
b
AMD
DDmG...pump
Market Cap
$.
Change
.
24h Vol
$.
Holders
.
fxUSD
f
bade
b
fxUSD
0x08...d8f6
Market Cap
$.
Change
.
24h Vol
$.
Holders
.
BTC
B
bade
b
BTC
C5xp...pump
Market Cap
$.
Change
.
24h Vol
$.
Holders
.
What happened!!
Did it once on the ground.
post-image
$PI The guy who spoke earlier was right. We’re true believers. We’re only responsible for mining π, stockpiling more π, and holding onto it—we don’t trade. If we want to buy, we buy a little; if not, we just watch. While others are wailing and panicking, we’ll wait for the ecosystem to take shape. When π becomes money, that’s when we’ll buy, buy, buy… We don’t concern ourselves with anything else, because we can’t manage everything. It’s just like Lao Si and his wife👫; they can only take care of what they can, and there are things beyond their control too. Who will take care of those? Someone
PI-0.60%
  • 3
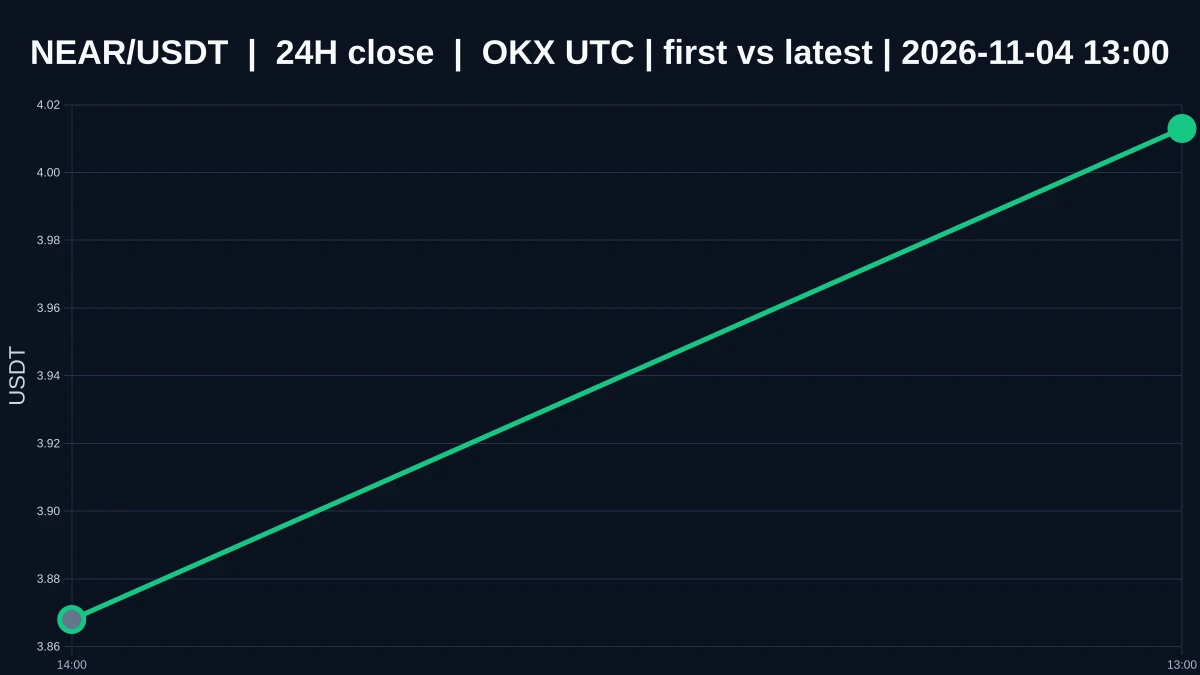
NEARUSDT Short-Term Divergence: Observing Price and Volume Amid a Strong 1-Hour Trend and Weak 4-Hour Trend
$NEAR The current price is 4.012, with a 24-hour change of 3.322173577131071%, an intraday high of 4.133, and a low of 3.694. In the short term, the 1-hour trend is relatively strong, while the 4-hour trend is relatively weak, indicating divergence between the two time frames, with short-term strength and medium-term weakness coexisting. This divergence means the short-term move has not yet been confirmed on the 4-hour time frame. The trend should not be assumed to continue based solely
post-image
🇭🇰HONG KONG TO SHARE CRYPTO USER DATA WITH GLOBAL TAX AUTHORITIES FROM 2028! 🌍💰
🇭🇰 Hong Kong has passed new crypto reporting rules under the OECD framework.
↳ 🪪 Exchanges must collect users’ names, addresses and tax identification details.
↳ ₿ Crypto transactions, including buys, sales and transfers, will be reported.
↳ 🌐 Data will be shared with participating countries from 2028.
BTC Faces Selling Pressure While XRP and ZEC Rally Against the Trend! Is Capital Rotating Into Alt
live-cover
LIVE2,702
$CAP Up 20% in a day, with 24-hour trading volume nearing $20 million. For a small-cap coin, this kind of volume is a clear sign someone is making a move.
Let me explain what this coin is riding on. Imagine there used to be just one convenience store at the entrance to your neighborhood, and the owner says you’ll be able to use his store’s points to claim a share of the profits from every shop on the street. The points themselves aren’t valuable; what matters is the “right to dividends.” $CAP does exactly this: it bundles real-world cash-flow assets (property rent, invoices, and accounts rece
RWA-0.39%
  • 1
  • 1
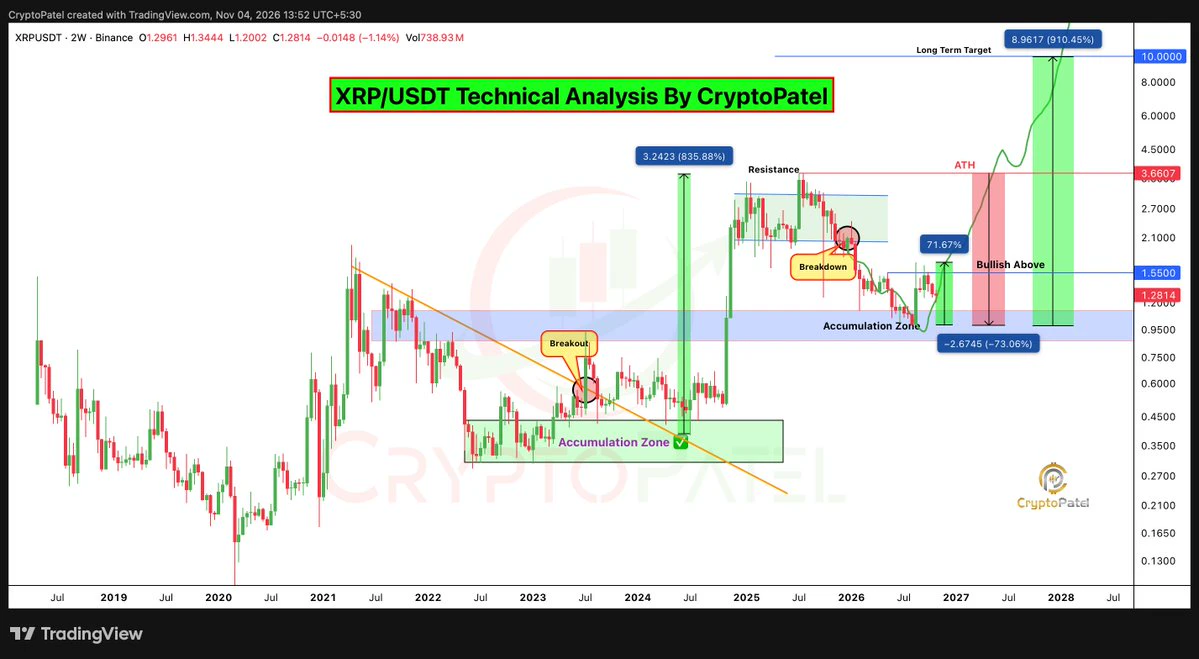
Will $XRP give us ONE MORE opportunity to accumulate between $1–$0.70 before its next explosive leg toward $10? 🚀
post-image
XRP-1.15%
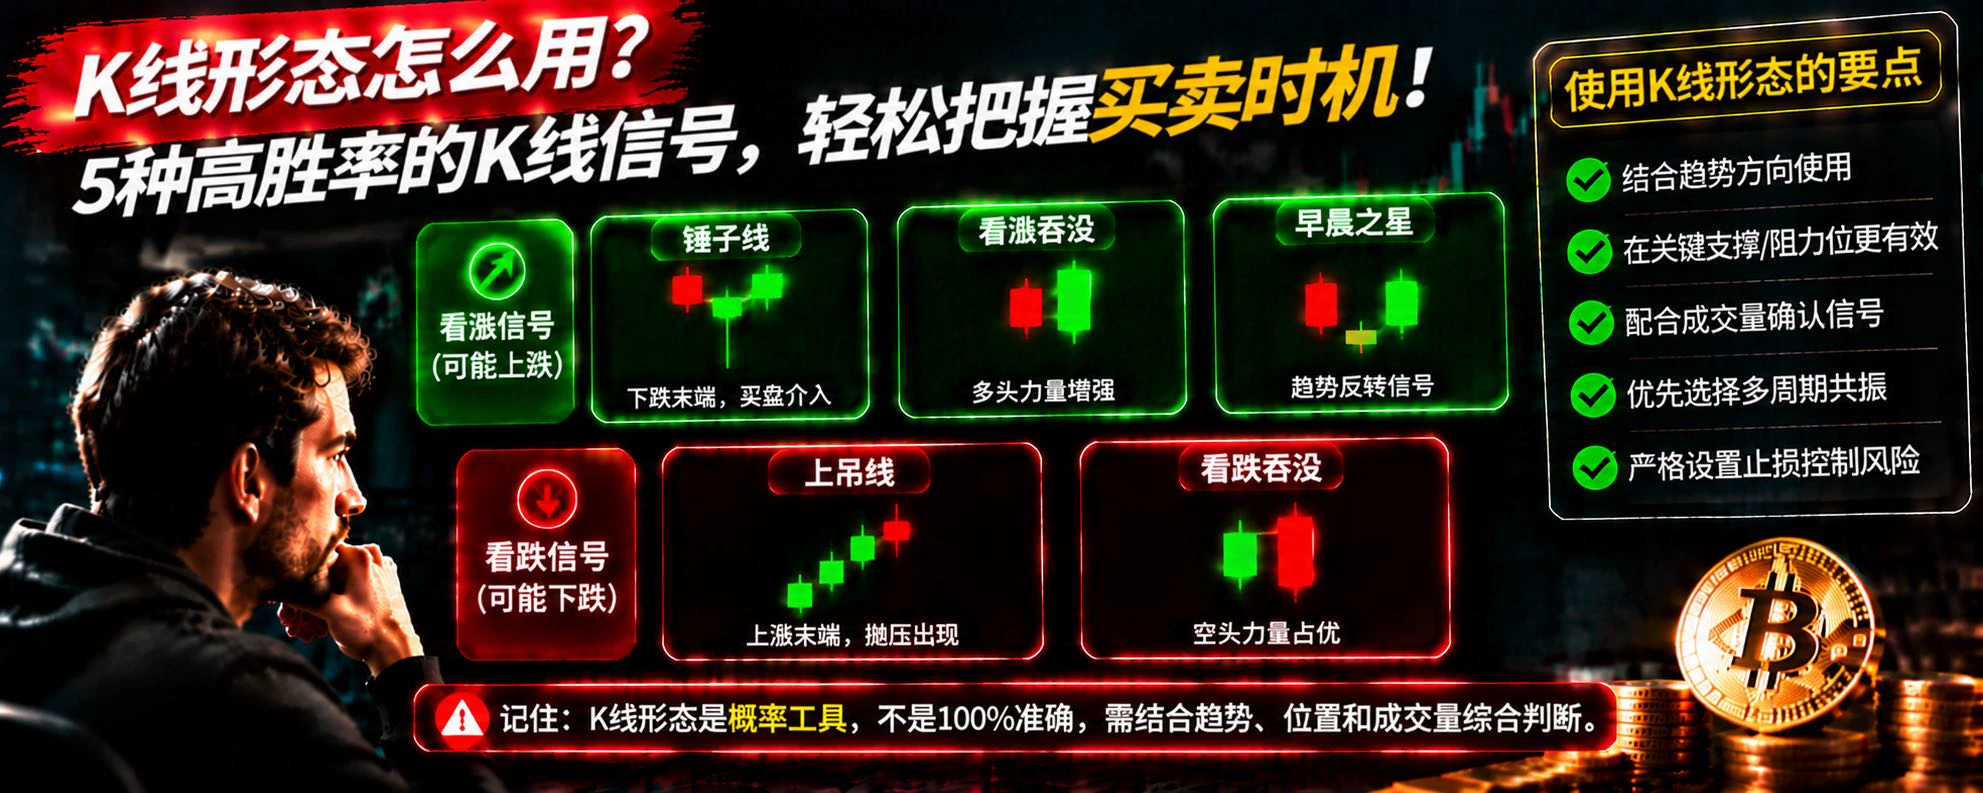
How to Use Candlestick Patterns? 5 Common Signals to Help Identify BTC Buying and Selling Opportunities
In crypto trading, many people look at candlestick charts every day, but few truly understand the market sentiment behind them.
Why does BTC rise rapidly after some candlesticks appear? Why does the price continue falling after some patterns appear?
Today, we’ll introduce 5 common candlestick patterns.
First, the hammer. It usually appears in a downtrend, with a long lower wick and a relatively small body. It indicates that buyers stepped in after the price fell and may signal a short-term r
post-image
BTC-0.67%
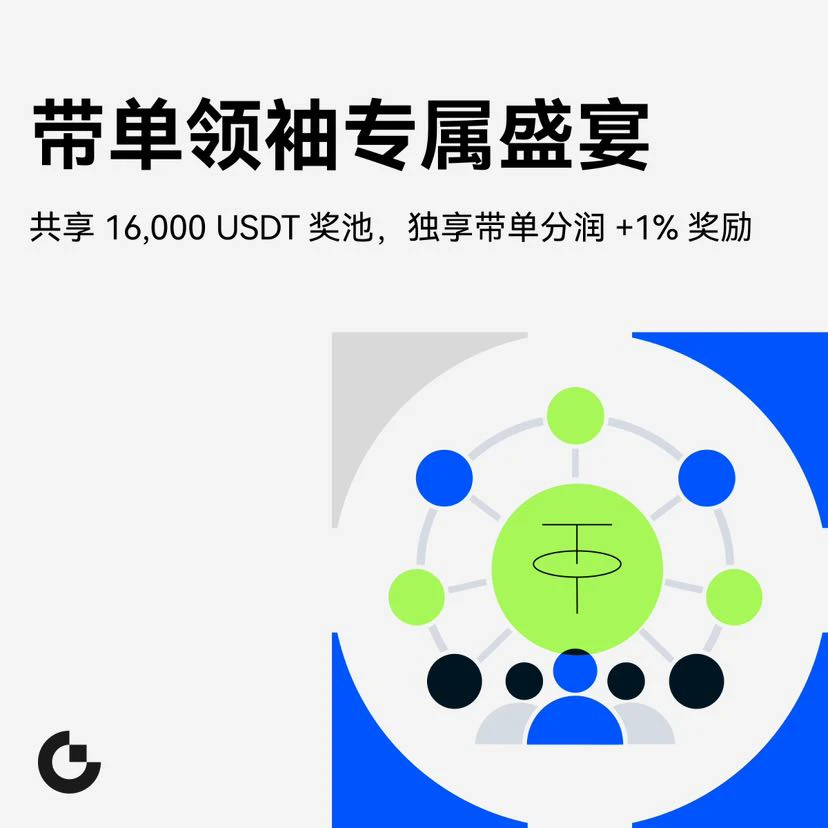
🔥 Calling all top lead traders! A 16,000 USDT prize pool + an extra 1% profit-sharing bonus awaits!
✅ Earn from leading trades, then double your rewards on the leaderboard! Climb to the top with your skills!
🥇 Copy Trading Volume Leaderboard: Top 10 finalists can win up to 1,000 USDT
👑 Popularity Champion: One winner takes 1,000 USDT + an extra 1% profit share
🚀 Growth Breakthrough: Top 5 in trading volume growth can win up to 1,500 USDT
👉 Sign up now: https://gate.onelink.me/7pdk/bd0979097f3763fd
CopyTrading
🔥 Calling all top lead traders! A 16,000 USDT prize pool + an extra 1% profit-sharing bonus awaits!
✅ Earn from leading trades, then double your rewards on the leaderboard! Climb to the top with your skills!
🥇 Copy Trading Volume Leaderboard: Top 10 finalists can win up to 1,000 USDT
👑 Popularity Champion: One winner takes 1,000 USDT + an extra 1% profit share
🚀 Growth Breakthrough: Top 5 in trading volume growth can win up to 1,500 USDT
👉 Sign up now: https://gate.onelink.me/7pdk/bd0979097f3763fd
repost-content-media
#ENA Four timeframes.
Friends, we measured the monthly, weekly, daily, and 4-hour charts for Ethena $ENA one by one. The price is currently 0.183, up 4.6% on the day.
Monthly: The peak was 1.523 in April 2024, and the low was 0.0699 in June 2026, a 95% drop from the peak. It rose fourfold from 0.07 to 0.2946 in August and September; October and November were red. Monthly RSI is 42. The bigger picture shows a bounce from the 2026 low, but every level up to the September 2025 peak of 0.873 is resistance.
Weekly: It has been pulling back for six weeks from the September peak of 0.2946; it closed
ENA+8.12%
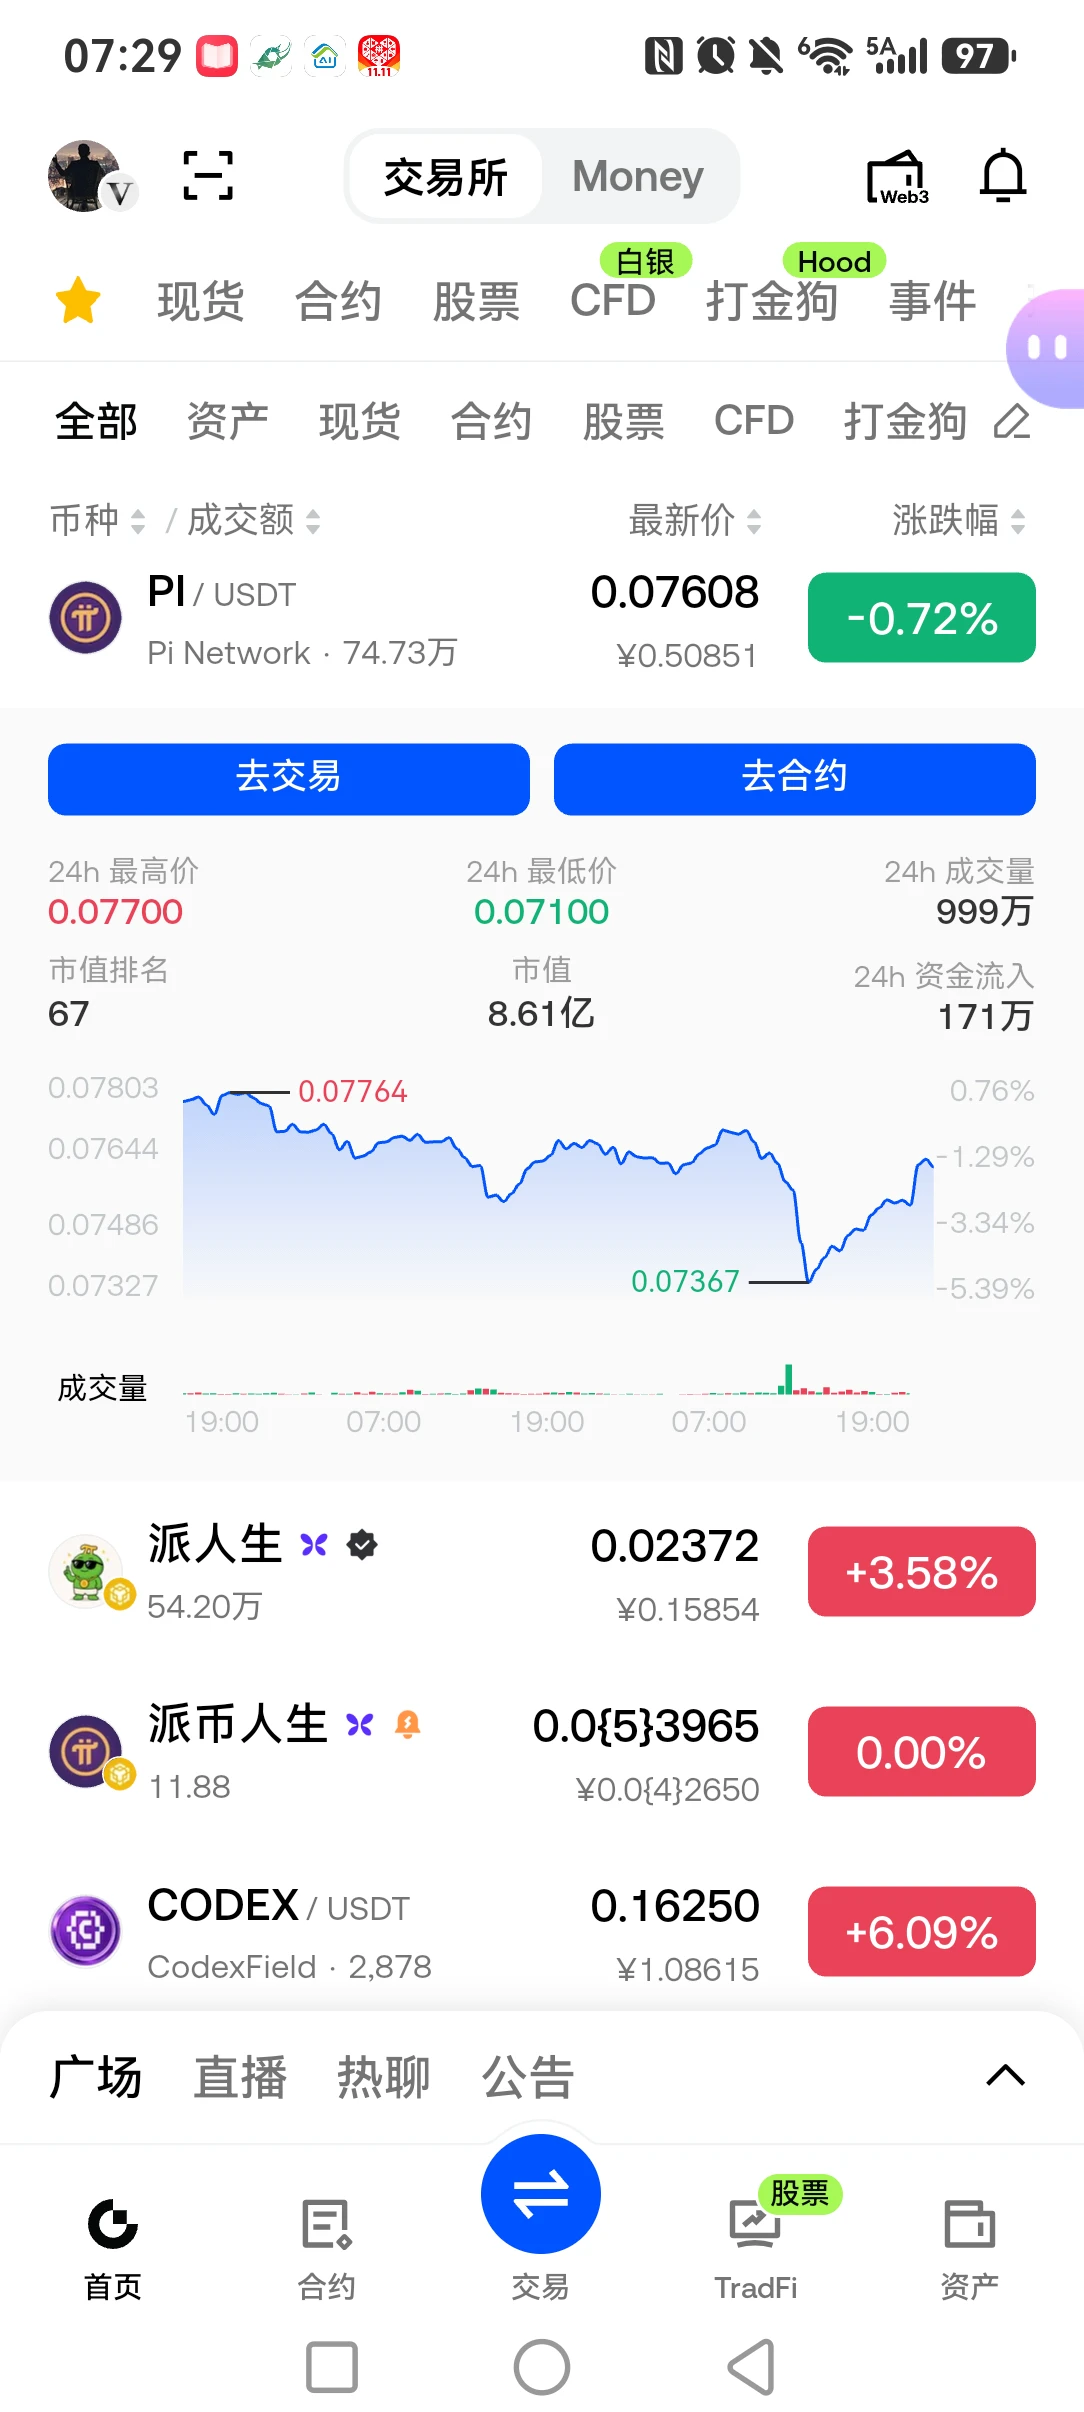
$PI Pi coin's price hasn't gone up, but its ranking has climbed to 67th place.😋
post-image
PI-0.60%
  • 3
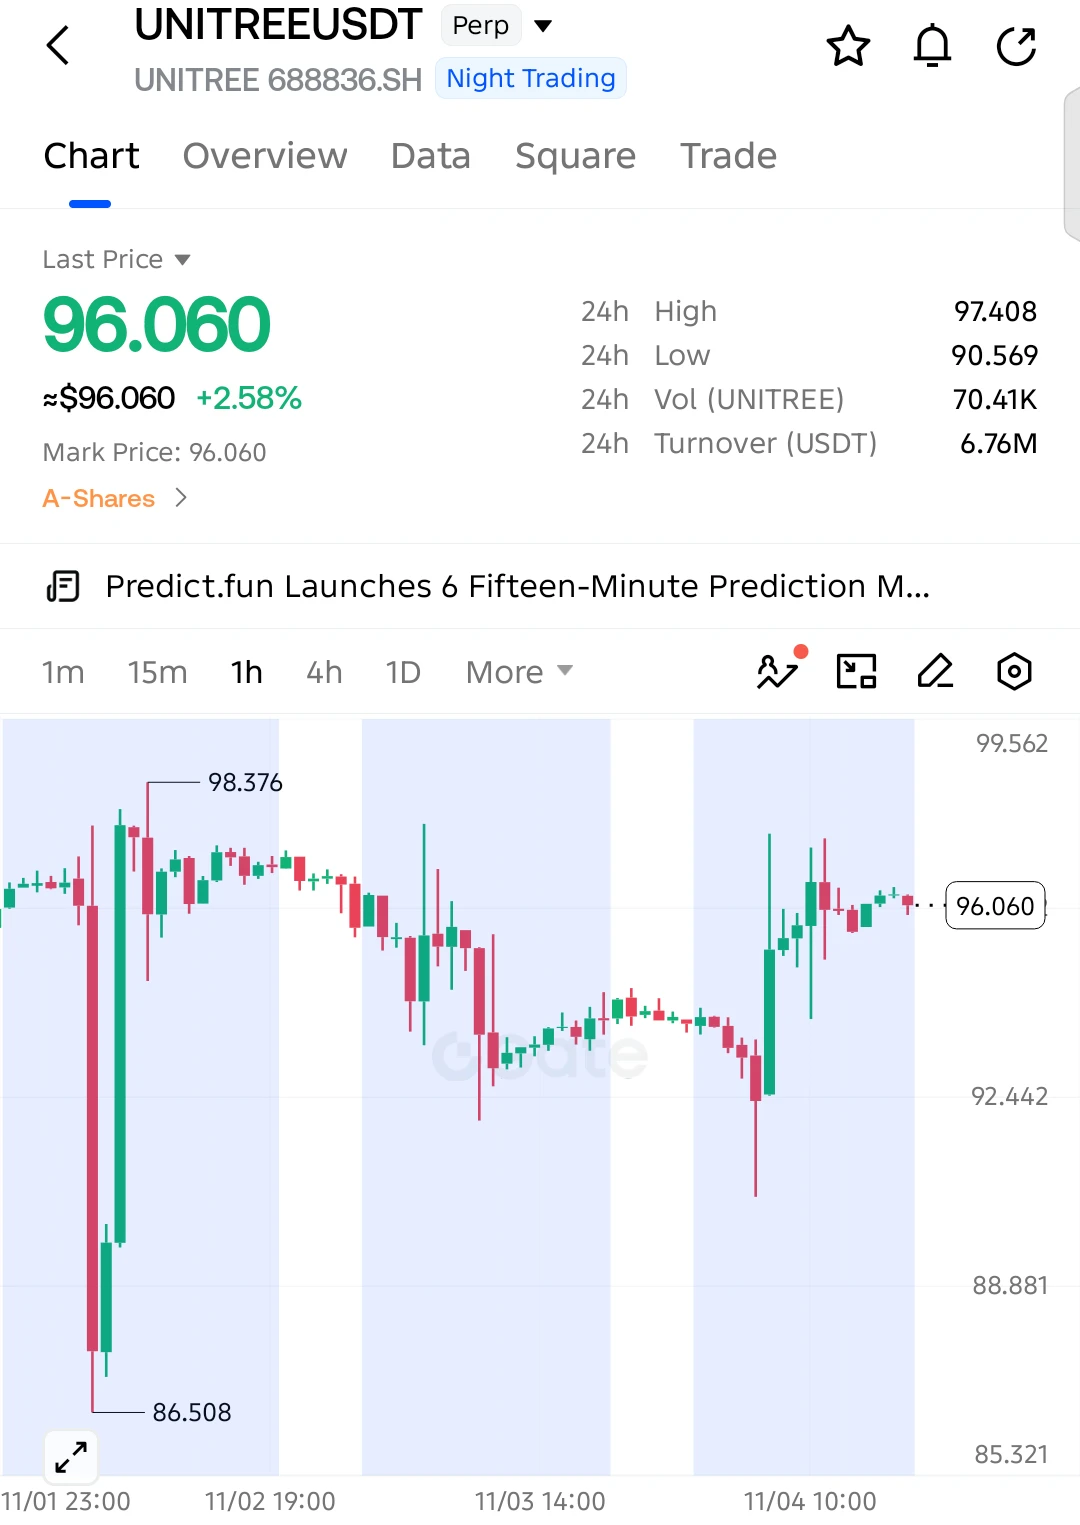
$UNITREE LONG SETUP — Bulls Gaining Momentum!
Entry: 96.060
SL: 94.80
TP1: 96.80
TP2: 97.40
TP3: 98.37
Extended Target: 99.50
$UNITREE has bounced strongly from the 90.57 area, with buyers reclaiming 95.00 and pushing price into consolidation near 96.00. Holding above 95.00 could support another move toward 97.40–98.37.
Invalidation: A sustained move below 94.80 weakens the bullish setup.
post-image
UNITREE+4.35%
  • 5
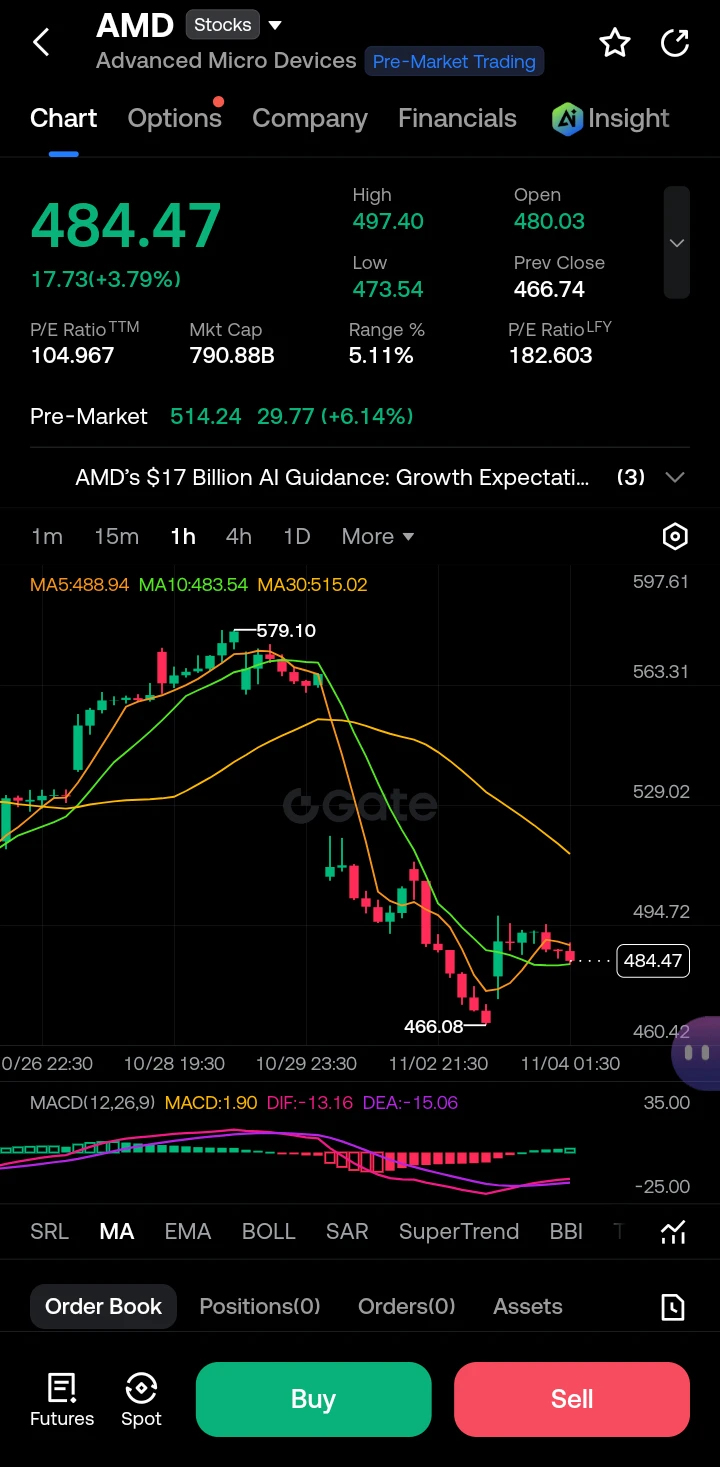
AMD is staging a powerful gap-up recovery after Q3 earnings crushed estimates, but price is now testing a heavy resistance cluster that will decide whether this is a true trend reversal or just a violent bounce.
$AMD ‌
📊 Current Market Situation
AMD closed at 483.47 (+3.79%) before earnings, then exploded in pre-market to 514.24 (+6.14%) after Q3 revenue hit $13.38B** (+45% YoY) and Q4 guidance of **$17B blew past the $16.2B consensus . Data Center revenue nearly doubled (+97% YoY), now 64% of total sales . However, the chart shows price is still below the 20-day ($553.92) and 50-day ($548.7
post-image
AMD+3.79%
  • 9
  • 3
Coming to Hong Kong for FinTech Week, you’re hit by a strong Old Money vibe.
After looking around, I found that the so-called future of fintech, both onstage and off, still revolves around banks, payment giants, and traditional financial institutions.
Legacy players like HSBC and Visa still control the core resources of the financial world. Emerging fields like Web3, Stablecoin, RWA, and AI Agent are ultimately all looking for ways to integrate with the traditional financial system.
Interestingly, a few years ago, everyone was discussing how to use blockchain to disrupt banks. Now the discussi
HSBC-1.61%
V-1.22%
RWA-0.39%
#USEarningsSeason #AMD Q3 Earnings 45% Revenue Growth, 97% Data Center Surge: Can MI450 Turn Expectations Into Real Earnings?
AMD Has Delivered the Numbers. Now Comes the Harder Part.
AMD's latest Q3 2026 results have given the AI investment story another powerful push. Revenue reached $13.38 billion, increasing 45% year over year, while non-GAAP EPS climbed 74% to $2.09. Data center revenue was the standout performer at $8.55 billion, almost doubling with 97% annual growth. All three major indicators exceeded market expectations, and the company's next-quarter outlook added another reason for
Morgan Stanley is tokenizing US equities and Treasuries through DTCC’s Tokenization Service.
The service launched on Canton and DTCC’s private Besu network, with Stellar and Circle’s Arc anticipated in 2027.
MS+1.04%
XLM-0.64%
CRCL-3.04%
ARC-4.26%
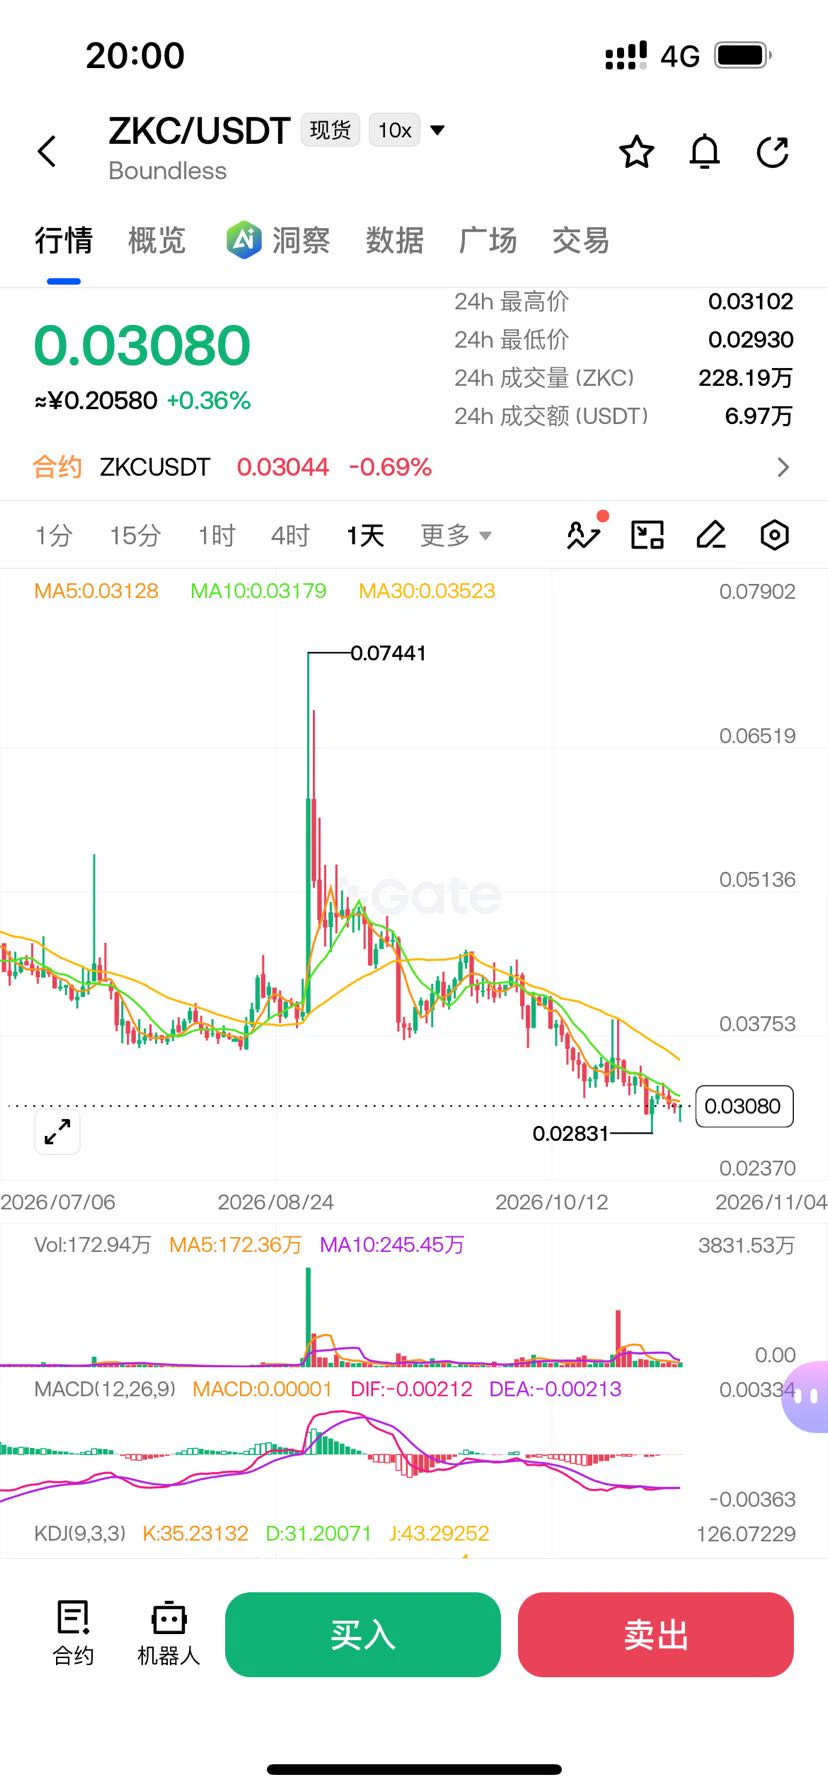
$ZKC A six-month low, down 62%—that’s its baseline.
The recent news that made people take notice: the foundation plans to launch a tokenized AI inference scheme, offering model credits to people who stake ZKC. It’s set to go live on January 2, 2027. Sounds cool, but that’s next year; valuing it this year takes a telescope.
More interesting is the volume—it’s only half the usual level. Big money hasn’t even dipped a toe in. The current price is 0.0306, up 0.3% in a day, down 8.7% over 7 days, and still 30% lower than 30 days ago. The story is being told, but the money hasn’t followed. That’s t
post-image
ZKC-4.94%
#GateGuardNowAvailableForFree
#Gate安全卫
PROTECTION. Your Crypto Portfolio Deserves More Than Just a Strong Trading Strategy.
A successful trading strategy can help protect your capital from market volatility, but it cannot protect your account from every security threat. Unauthorized access, compromised devices, and malicious activity can put your digital assets at risk even when your trading decisions are completely right.
This is why account security deserves the same attention as portfolio management.
Gate Security Guard introduces an additional layer of account protection for eligible user
  • 8
  • 2
Load More

Join 40 M users in our growing community

⚡️ Join 40 M users in the crypto craze discussion

💬 Engage with your favorite top creators

👍 See what interests you

Trending Topics

GateLaunchesTaiwanStockTrading

5.27k Views150 Discussing

Gate has launched Taiwan stock trading with 19 stocks available for direct $USDT trading, including TSMC (2330) and MediaTek (2454). From U.S. and Hong Kong stocks to Japan, Korea and now Taiwan, Gate is connecting users with more global traditional assets. Which Taiwan stock would you most want to access with $USDT — TSMC, MediaTek, or another AI supply-chain name?

DemocratsWinBothChambers

2.34k Views291 Discussing

ChipStocksRebound

7.37k Views2.96k Discussing

View More