Square
Following
Hot
News
Notifications
Profile
Share your thoughts
placeholder
Article
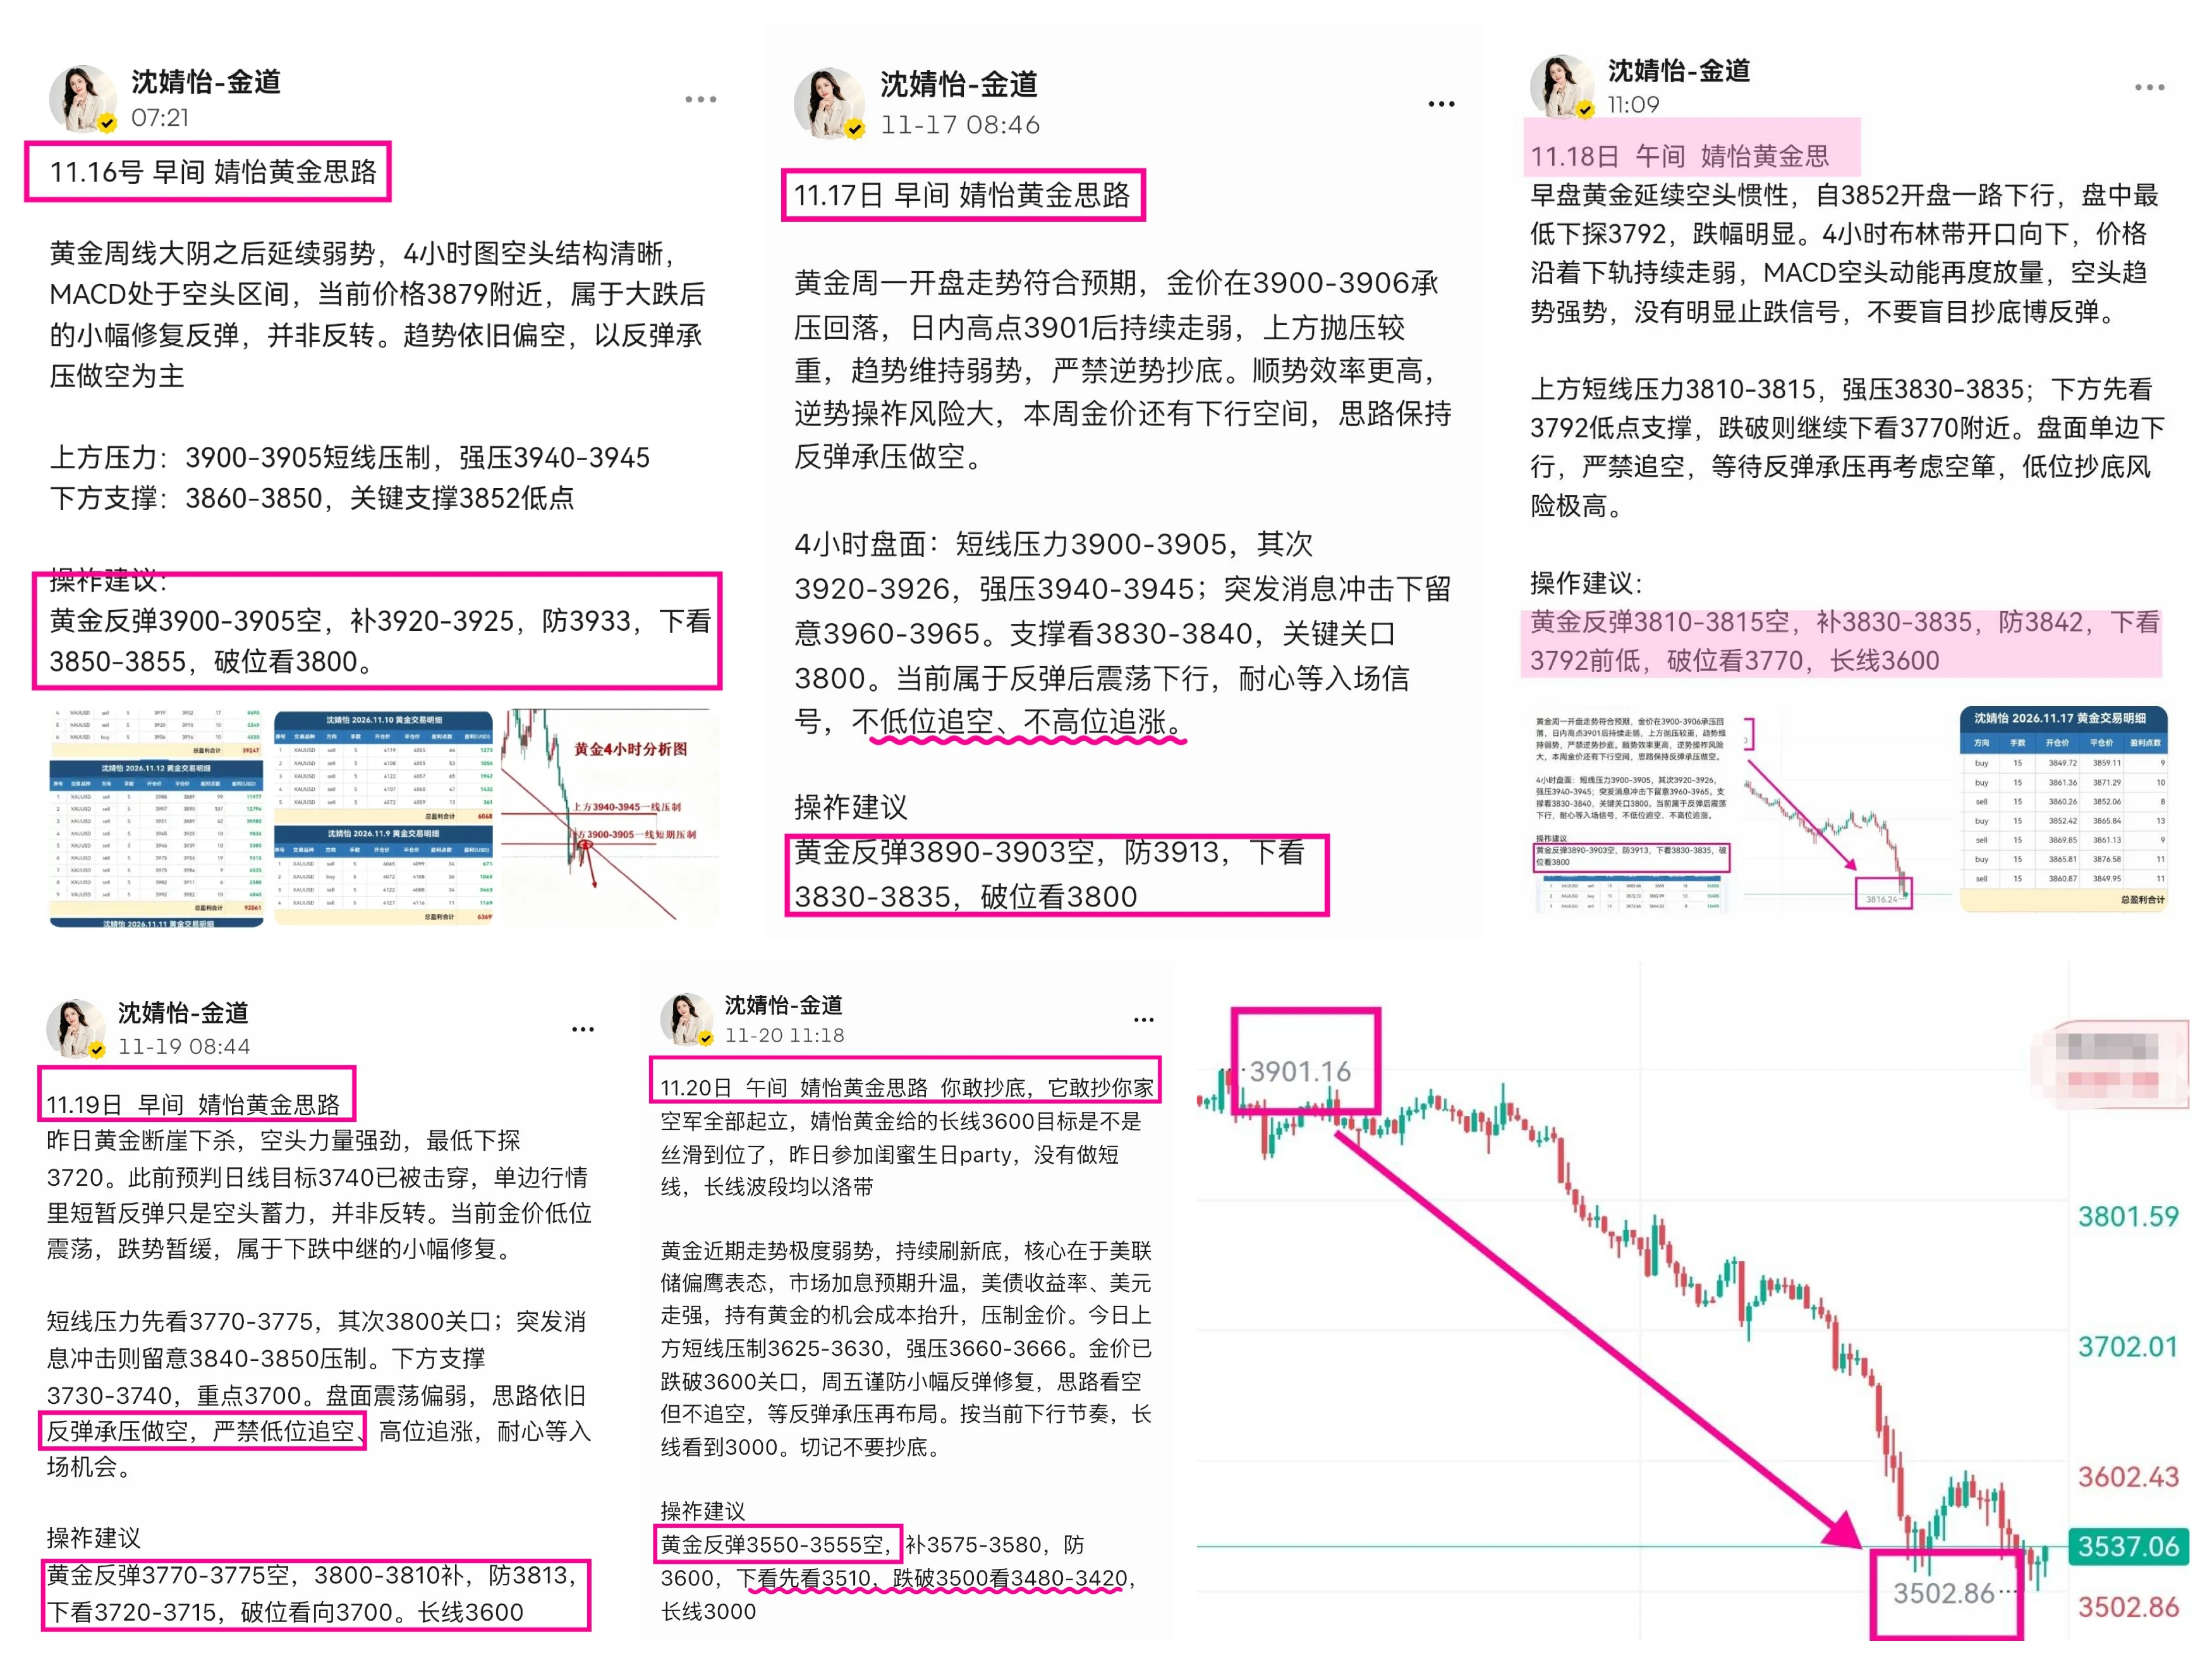
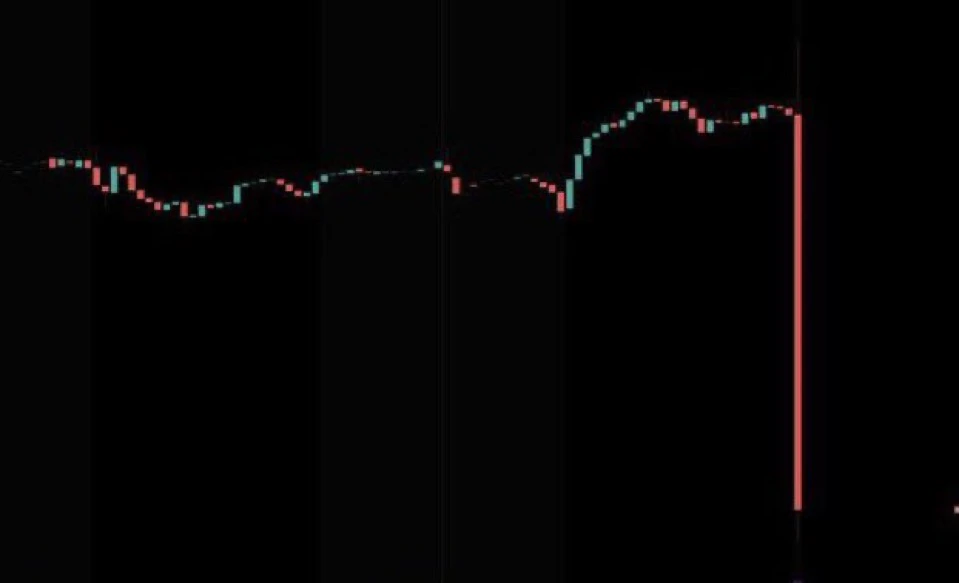
Jingyi called for a short from 3,900 this week—go short! The screenshots prove it. The long-term target of 3,600 was also hit smoothly. On Friday, rather than blindly calling for further downside, she focused on 3,500 support in advance: a break below 3,500 would extend the bearish trend. Gold also began a slight rebound after hitting 3,502. So tell me, if you’d simply followed Jingyi’s strategy, wouldn’t you have made a nice profit?
post-image
GLDX-0.40%
PAXG+0.37%
‼️GT has plunged—the best time to subscribe is here: 4gt is half price, returning to 9gt tomorrow. A 90% long-term win rate; over 600 subscribers 🎉 Subscription details⬇️

https://www.gate.com/zh/profile/缠浪解盘

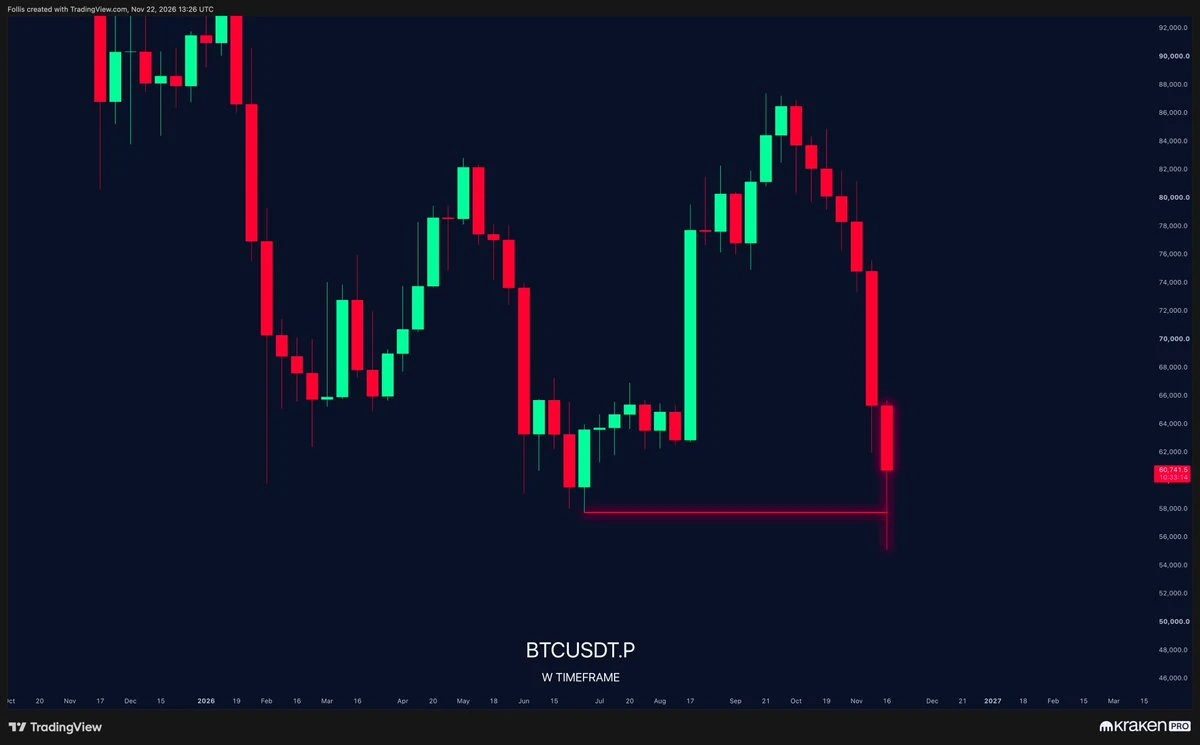
🔥 Four wicks failing to break the level is a bear trap; the fifth wick followed by a V-shaped reversal is the answer 📈
When the wick hit 55,130, everyone online was shouting “crash.” We had our long orders placed on the buy wall—
‼️We bought the bottom at 1540/57700 yesterday; today’s current price is 1730/61000, and we’ve already doubled our position‼️ 📈#下周PCE与GDP数据将揭晓
GT-2.24%
  • 1
Trenches
PIEVERSE
P
bade
b
PIEVERSE
0x0e...25a9
Market Cap
$
Change
.
24h Vol
$.
Holders
.
IDOL
I
bade
b
IDOL
0x3b...ab07
Market Cap
$.
Change
.
24h Vol
$.
Holders
.
JAGENT
J
bade
b
JAGENT
0x8e...ae15
Market Cap
$.
Change
.
24h Vol
$.
Holders
.
Singularity
S
bade
b
Singularity
7R4M...pump
Market Cap
$.
Change
.
24h Vol
$.
Holders
.
mihao
m
bade
b
mihao
4Cxj...pump
Market Cap
$.
Change
.
24h Vol
$.
Holders
.
“I’ve been hearing ‘a 24% rise means market makers are pumping it, and they’re about to dump’ for nine years.” Today, $XVG went from 0.0014 to 0.0018, up 24.07% in 24 hours, with just 3.9M in trading volume. In a big pool, that volume wouldn’t even make a splash. If money were really forcing the price up, trading volume wouldn’t be this thin—so thin it looks like a small restaurant’s lunchtime takings.
The pump narrative assumes big money is coming in to wash trade. 3.9M in trading volume isn’t enough to support a proper hunt; it looks more like nobody’s selling at these low levels, and the pr
XVG+0.00%
  • 2
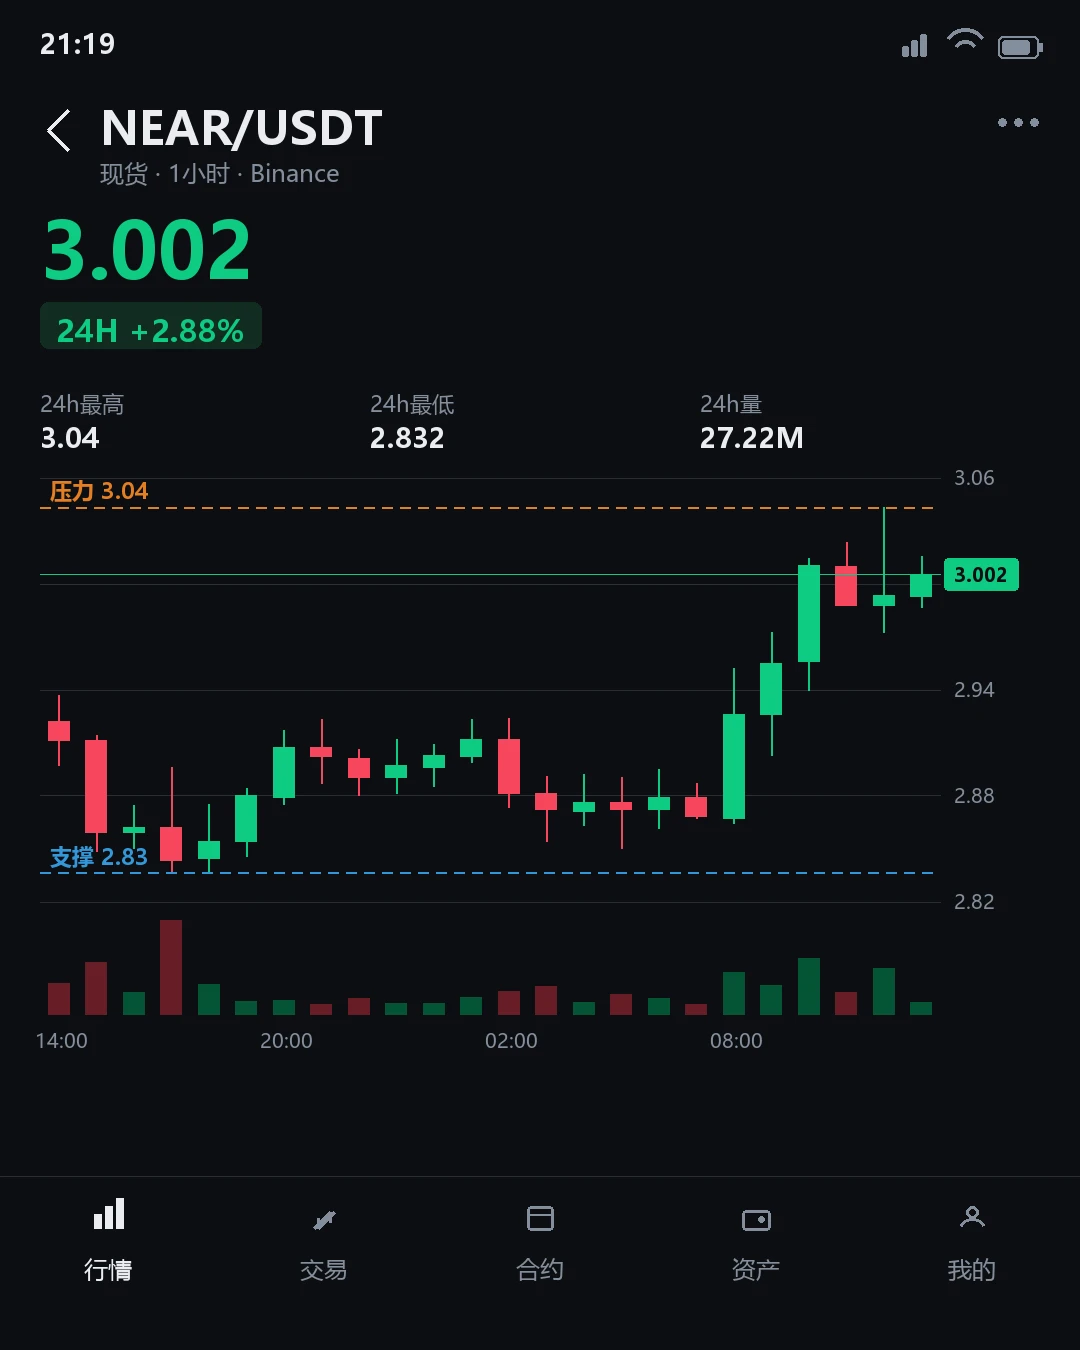
$NEAR Has Reached Resistance; One Final Confirmation Is Needed for a Breakout
Currently, $NEAR is trading at 3 USDT, up 5.93% over 24 hours, with a range of 2.83–3.04. The 1-hour support is 2.832 and resistance is 3.04; the 4-hour support is 2.55 and resistance is 3.477.
My view: The price has reached the threshold, but touching, breaking through, and holding above it are three different things.
Touching resistance is only a test; moving above it intraday is an attempted breakout. Only when the price remains above it after the close, with volume backing it up, does it come closer to a confirm
post-image
Bitcoin$BTC Tomorrow’s Outlook and Strategy
As long as the intraday rebound cannot break above the 61000–62000 range, we’ll prepare to enter short positions, with 58000 as the first key level to watch below. If 58000 breaks, the price may retest support at 55000–53000; but if bulls push through resistance, we’ll look toward the 63500–64000 range!$ETH #ARK申请撤回两只加密指数ETF
BTC-0.65%
ETH-1.23%
  • 1
$BTC about to close the weekly as a bullish SFP
Now +10% up from the 55.1k low
post-image
BTC-0.67%
An extra layer of protection for stock trading — trade with greater peace of mind https://www.gate.com/campaigns/7100?ch=9989&ref_type=132
post-image
Holy shit, I opened it today and saw that Gemini really does have a periodic table of elements. I thought everyone had been joking about it this whole time!
Also, Gemini's IQ for Plus users is really low...
post-image
Abraxas Capital bought $897 million worth of BTC during the market downturn.
live-cover
LIVE2,190
BTC-0.67%
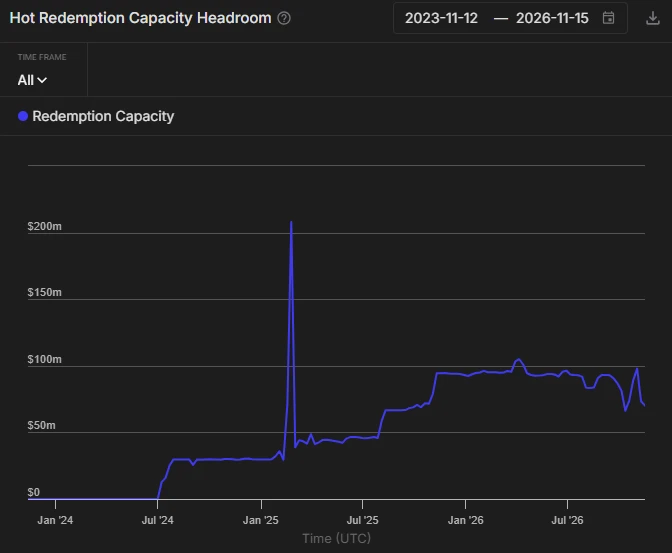
Sentora Risk Radar now tracks Ethena's Hot Redemption Capacity Headroom, the USDe that holders can redeem in the next hour from assets already in the mint/redeem contract.
It held near $95M for most of 2026 and stood around $70M in mid-November.
post-image
ENA+8.04%
USDE+0.00%
I treated the client to a whole roast lamb for a late-night meal tonight.
If I can’t close the deal, I’ll be out a lot of money, huh?
Whatever, I’ll get him drunk first and figure out the rest later.
post-image
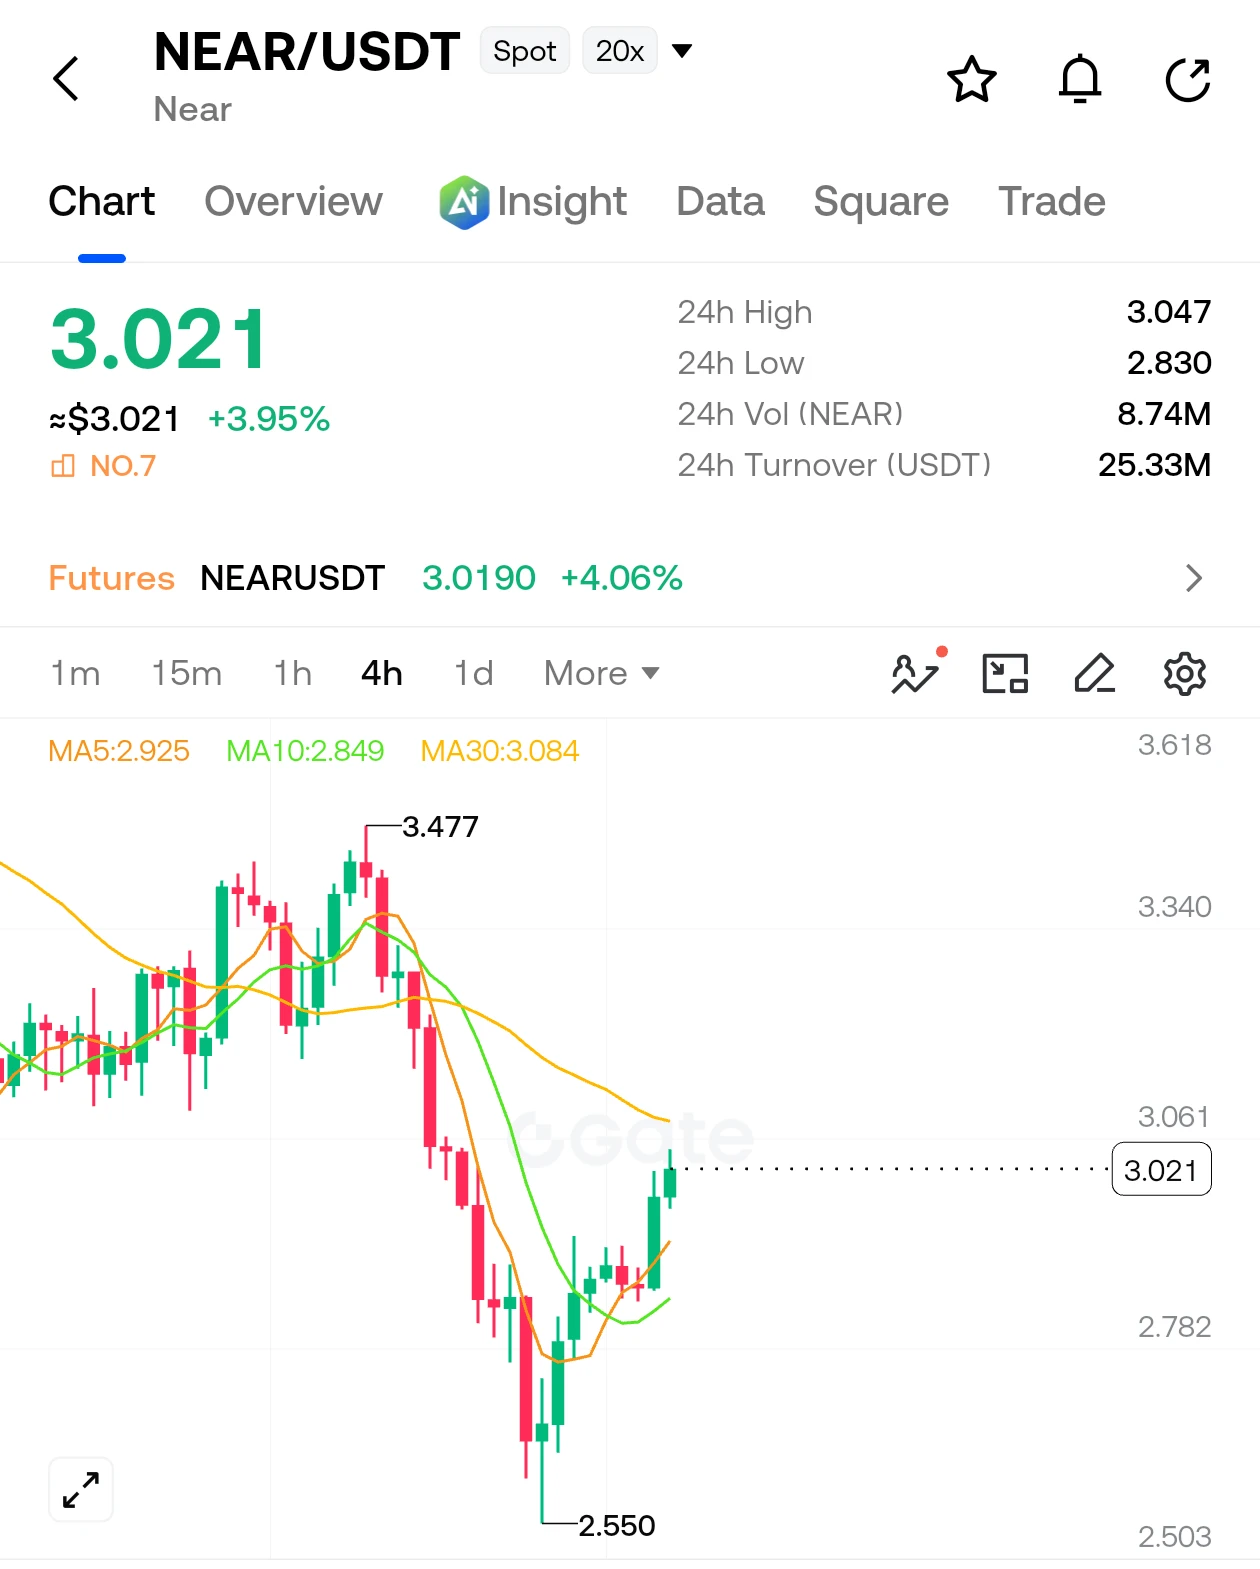
$NEAR Following a sharp flush down to the 2.550 demand floor, $NEAR spent multiple sessions in tight base consolidation before reclaiming both the 5 and 10 moving averages on the 4H chart.

Bullish momentum is building directly beneath the 3.061–3.084 resistance cluster (MA30 and recent 24h high at 3.047).

Holding above the 2.90–2.95 support flip keeps the structure primed for an upside breakout, though failure to clear 3.084 risks a temporary liquidity sweep back into the mid-range.

• Entry Zone: 2.950 – 3.025
• TP1: 3.180
• TP2: 3.340
• TP3: 3.470
• Stop-Loss: 2.820

#NEAR #BTCReboundFace
post-image
NEAR+1.17%
  • 1
The crypto I was monitoring for more than 8 months, 5 minutes after I buy it
post-image
#ARKSeeksToWithdrawTwoCryptoETFs

Gate Square Trending Topics: Bitcoin's Weakness, U.S. Economic Signals & $ANT IPO Allocation What Should Investors Watch Next?

The crypto market is entering a period where every major economic announcement, price movement, and project development can influence investor sentiment. Across Gate Square, several important topics are attracting attention, from the third Gate Direct IPO $ANT allocation results to changing U.S. employment conditions and Bitcoin's recent decline to a new low for the period. At the same time, developments in RWA perpetual contracts a
post-image
This content includes gift coins. Please open the app to view them.
ANT-8.68%
  • 7
  • 4
$SOXLB Diverges Across Short- and Long-Term Timeframes: Which Way Will It Turn First?
$SOXLB is currently priced at 34.02, up 4.292% over the past 24 hours. The intraday high was 34.28, and the low was 32.16. The 1-hour timeframe shows price strength: it has broken above the 1-hour EMA20 at 33.3617, and the RSI14 is 60.76, nearing overbought territory. Price has reached the 1-hour resistance at 34.28, but whether it can hold above this level and continue rising is key.
The 4-hour timeframe shows weakness: price is well below the 4-hour EMA20 at 37.3057, and the RSI14 is only 23.26, deep in ove
post-image
#ETH
Ethereum currently sits near 1,682 to 1,685 dollars after climbing roughly 3.8 to 5.1 percent over the past 24 hours from levels that had briefly dipped as low as 1,535 to 1,550 dollars. That rebound follows a sharp multi-day slide that left the asset down approximately 5 to 6 percent on the week and nearly 30 percent across the past 30 days, with the 30-day range stretching from highs near 2,470 dollars down to the recent trough. On a one-year basis Ethereum has declined around 39 to 44 percent, and it now trades roughly 66 percent below its all-time high of approximately 4,946 dollars
ETH-9.05%
BTC-0.67%
$ETH The large holders’ long/short position ratio is below 1. Does this mean smart money is siding with the bears?
In-depth analysis: ETH’s large holders’ long/short position ratio has fallen below 1, indicating that top accounts are clearly net short. When retail and large-holder long/short ratios diverge, always trust the large holders. I opened a short when the large-holder ratio fell below 1 and used 200x leverage to ride the one-way move once the market’s direction became clear.$BTC $ZEC
ETH-1.23%
BTC-0.65%
ZEC+1.29%
  • 1
#GoldNears3500 #XAU #WCTCS9
Gold currently trades in the region of 3,520 to 3,540 dollars per ounce following a sharp multi-session decline that carried prices to the lowest levels since September 2025, with an intraday trough near 3,502 to 3,514 dollars. This represents a weekly loss of approximately 8.7 to 9.4 percent, marking the steepest weekly drop since March and extending a broader correction that has erased roughly 30 to 37 percent from the peaks recorded earlier in 2026 near 5,500 to 5,589 dollars. Over the past month the metal has declined around 12 to 14 percent, while year-to-date
XAU+0.38%
XAG+0.47%
ANT-8.68%
Load More

Join 40 M users in our growing community

⚡️ Join 40 M users in the crypto craze discussion

💬 Engage with your favorite top creators

👍 See what interests you

Trending Topics

BTCReboundFaces60KTest

2.1M Views30.1K Discussing

BTC rebounded from around $55,300 on November 21, briefly reclaiming $60,000 before pulling back to around $59,300. The $60K level is back in focus as traders assess whether the recovery can last. Is this rebound a sign of stabilization or a short-lived recovery? Would reclaiming and holding $60K be enough, or do you need confirmation from trading volume and fund flows?

PCEAndGDPDataNextWeek

259.7K Views2.6K Discussing

GateDirectIPOPhase3ANTAllocates92100Shares

840K Views5.1K Discussing

View More