
Square
Following
Hot
News
Notifications
Profile
Share your thoughts
placeholder
Article
I just woke up, glanced at the chart, and nearly thought my eyes were playing tricks on me😳

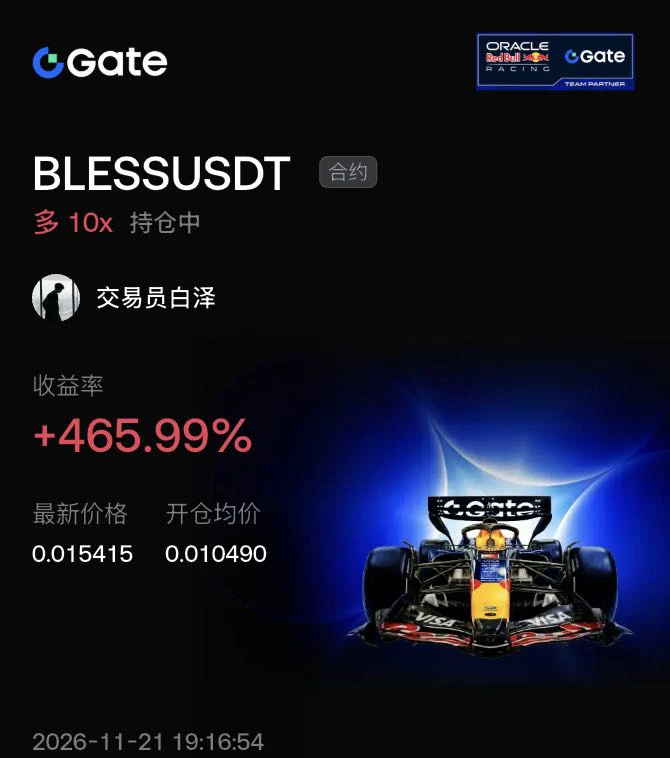
I bought the bottom at 0.010490, and now it’s surged to 0.015415. My heart is racing even harder than the market. $BLESS This run is riding the tailwind of AI computing power; people in the group chat have been talking about it every day lately.

A few days ago, the chart was deep in the red. Then it suddenly ripped through several hourly candles in a row, and I nearly got shaken out. The logic is simple: it stopped falling, someone was quietly scooping it up, so I hopped on too.

It looks great now,
post-image
BLESS-2.03%
BTC-0.65%
ETH-1.23%
  • 2
$EVAA $EVAA was a FOMO coin last year$LAB Do you think EVAA will take River’s liquidity and easily break $20
post-image
EVAA-0.49%
LAB-4.47%
Trenches
FIONA
F
bade
b
FIONA
B34n...pump
Market Cap
$.
Change
.
24h Vol
$.
Holders
.
PIEVERSE
P
bade
b
PIEVERSE
0x0e...25a9
Market Cap
$.
Change
.
24h Vol
$.
Holders
.
mihao
m
bade
b
mihao
4Cxj...pump
Market Cap
$.
Change
.
24h Vol
$.
Holders
.
CLAUDIA
C
bade
b
CLAUDIA
2j5S...W2ZM
Market Cap
$.
Change
.
24h Vol
$.
Holders
.
IDOL
I
bade
b
IDOL
0x3b...ab07
Market Cap
$
Change
.
24h Vol
$.
Holders
.
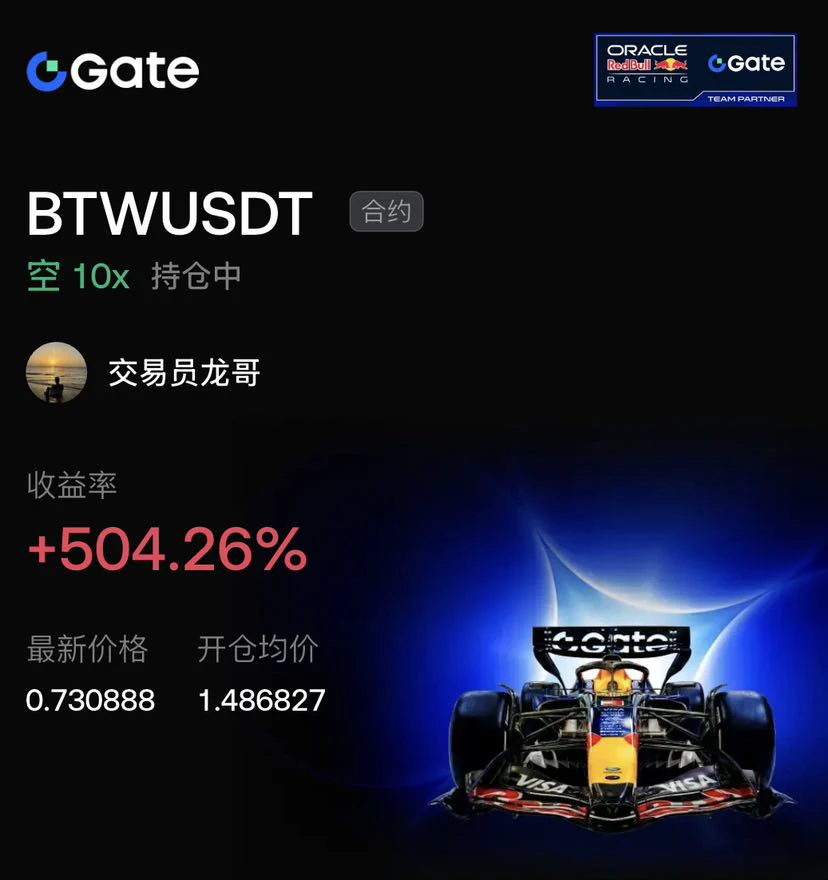
🔥🔥🔥 Hot, hot, hot 🚨🚨🚨$Lobster market remains weak, but has seen a slight rebound; there are gains and losses, and short-term swing trading looks decent, so you can gradually start shorting with a small position. $PIEVERSE has reached Alpha level, and the price may see a rally, making it seem like a good opportunity for a swing long. $BTW seems to be showing signs of a gradual, slight decline, so you can gradually shift to shorting. 📈📈📈
post-image
PIEVERSE+0.58%
BTW-7.42%
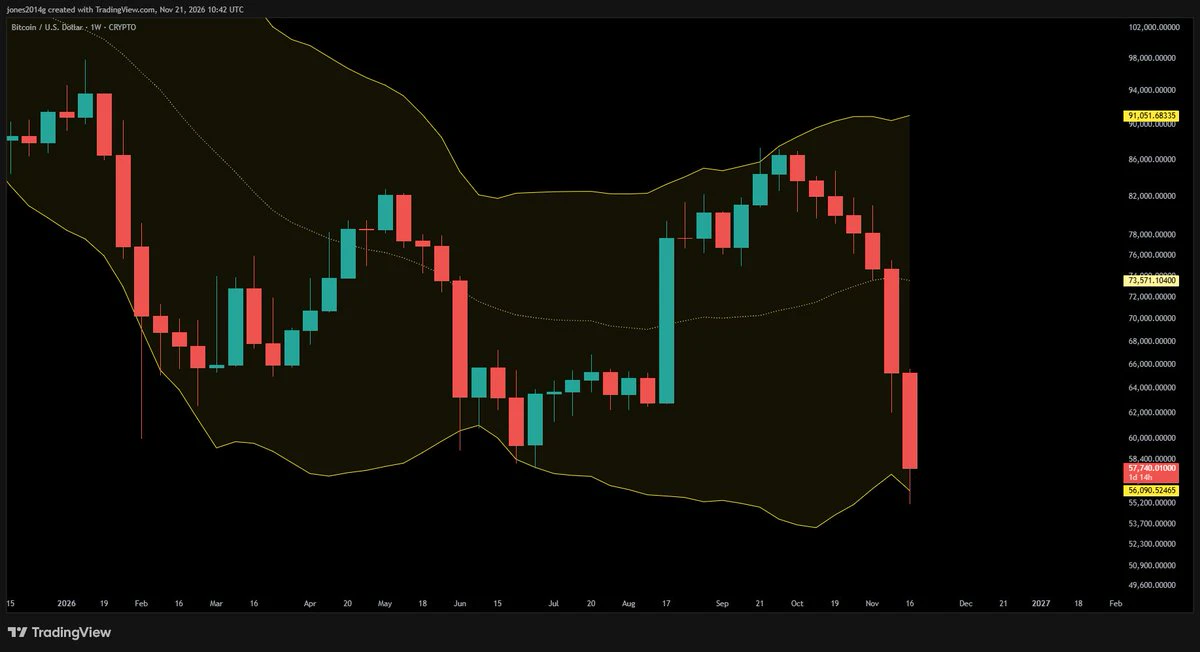
Bitcoin has tagged the lower bollinger band on the weekly again.
post-image
BTC-0.67%
  • 1
#Gate股票暢聊季 Nasdaq drops 5.28% in a single day, wiping out its gains for the year; Nvidia plunges 23% in a week as the AI boom faces a repricing

At Friday’s close, the Philadelphia Semiconductor Index fell 10.73% in a single day. Anthropic shares briefly dropped to $83.05 on their second day of trading, just 5 cents above their $83 offering price from the day before; they held at $88.91 at the close, down 8.5%, giving back most of their first-day gains. The selloff did not stop with the new listing. The Nasdaq Composite closed down 5.28% at 22617.73, wiping out its 2026 gains in one fell swoop
NAS100-0.07%
NVDA-13.84%
ANT-8.68%
VOLX+0.40%
XAU+0.38%
  • 5
  • 1
So frustrating, stuck at 5400 points and just can’t climb to Supreme.
My highest so far is 5487; I’ve been hovering between 5200 and 5400 for ages.
I’m only a little over 100 points away, but I just can’t break through.
Still can’t make it?
post-image
Switching to a new platform to keep taking positions and getting liquidated! On-chain data shows that prominent whale Machi Big Brother has recently moved to the Papertrade platform. He is still sticking to high-leverage longs. During this market pullback, he has faced frequent forced liquidations. His account balance on the platform is now down to just $4,411. His cumulative losses have reached as much as $2.737 million. Even so, he transferred a small amount of funds this morning and continued opening long positions. Can the cost basis of the longs you guys are holding really withstand more
post-image
BTC PREDICTION MARKET UPDATE
live-cover
LIVE1,946
BTC-0.67%
ETH-1.26%
SOL-0.77%
XRP-1.15%
GT-2.41%
🔹 NVIDIA Interim CEO Colette Kress Faces a “Glass Cliff” as She Must Deal With Jensen Huang’s Legac
live-cover
LIVE1,622
BTC-0.67%
XAUUSD-2.40%
XAU+0.38%
ETH-1.23%
NVDA-0.35%
🚨 $2.55 BILLION WIPED OUT IN LIQUIDATIONS
$2.27B CAME FROM LONGS.
IN-6.81%
A coin down 20% with over 200 million in trading volume is more worth watching than the drop itself. $MUU is now at 9.80, down from 12.68 over the past 24 hours, after hitting a low of 9.33, with 227.9M in trading volume. A high-volume decline means people are actively trading—not that nobody cares anymore.
I'm not watching this red candle, but the ripple effects behind it. When big money moves, it often doesn't move the coin price first, but the liquid assets around it. When liquidity tightens there, money flows back first, draining high-volatility assets. $MUU is on the receiving end of th
  • 1
Enjoy your Bitcoin Black Friday! 🛒₿🔥
People cried about missing the bottom last cycle. Don't be the one crying again.
NFA! 🚀
post-image
BTC-0.67%
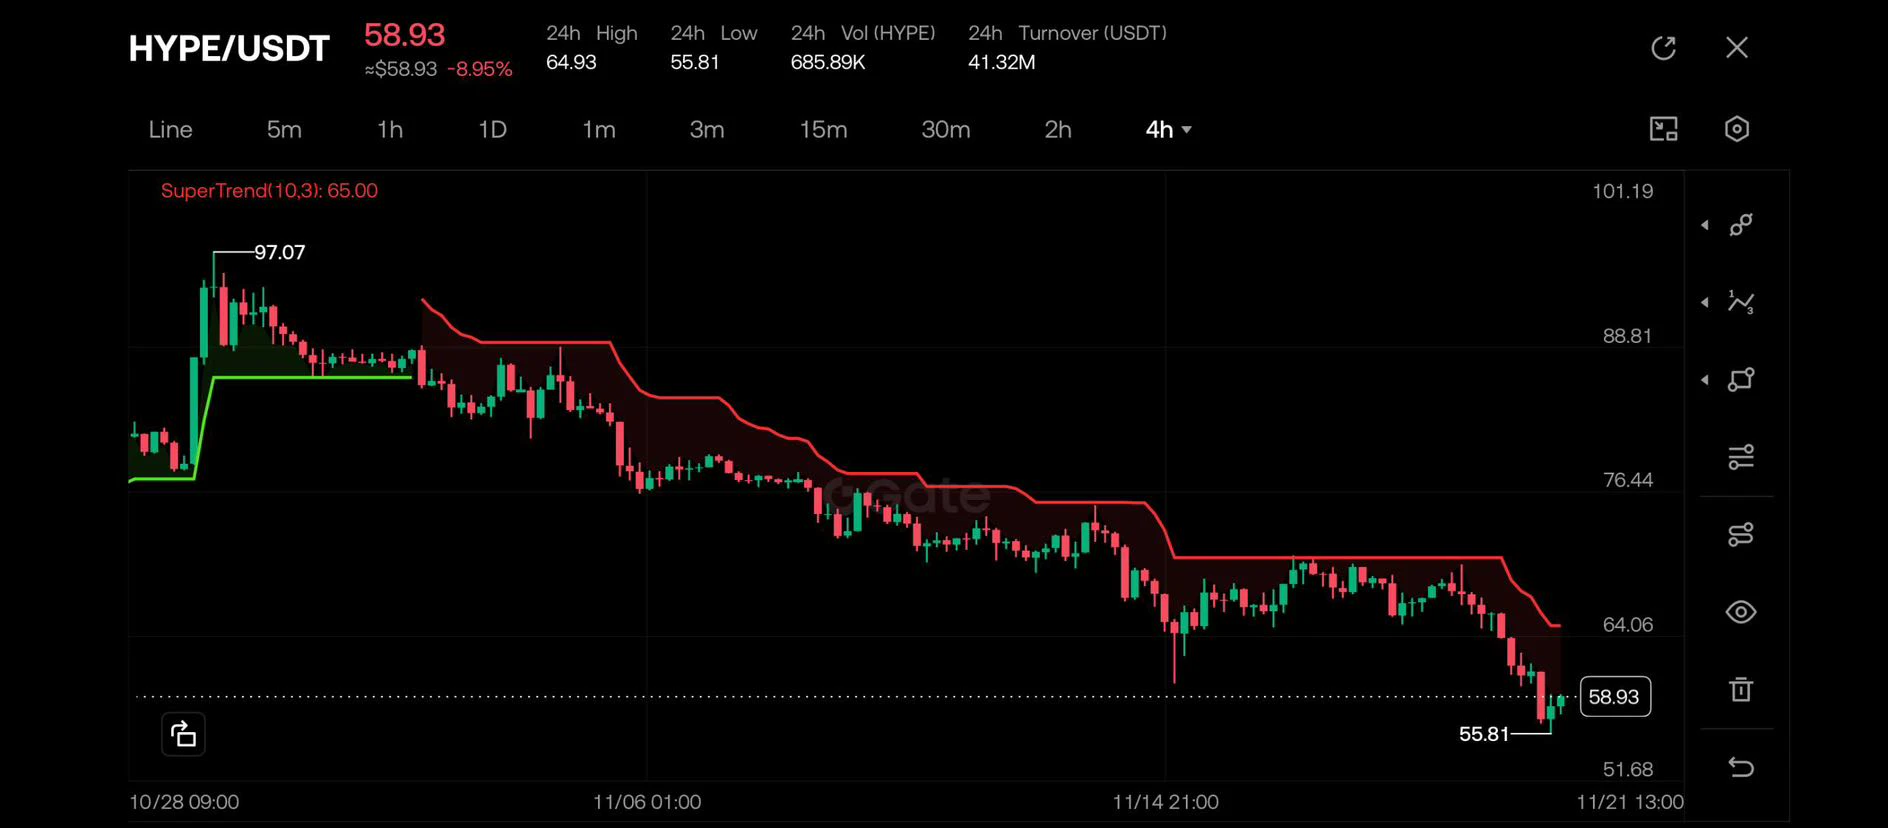
$HYPE

The broader market sell-off is weighing on price despite solid fundamentals.

$55.8 is the key support to hold, while $65 needs to be reclaimed to improve the outlook.

The chart is still under pressure, so I’d rather wait for confirmation than catch a falling knife.

Not financial advice. DYOR.
post-image
HYPE+0.24%
$EVAA This short trade capitalized on the shift in structure after the failed rally. The push near 6.6071 failed to hold, short-term highs began to descend, and then a surge in volume broke below the bottom of the consolidation range, shifting the trend from relatively strong to short-term bearish. A 10x short reached 6.2205, for a paper gain of 61.95%, mostly from the first acceleration after the breakdown. The price is now near support at the previous low, making it less attractive to chase the short. The key is whether a rebound to 6.35—6.40 can be capped.$BTC $ETH
#BTC跌破6万美元关口
post-image
EVAA-0.42%
BTC-0.65%
ETH-1.23%
🩸 Bloody Friday.

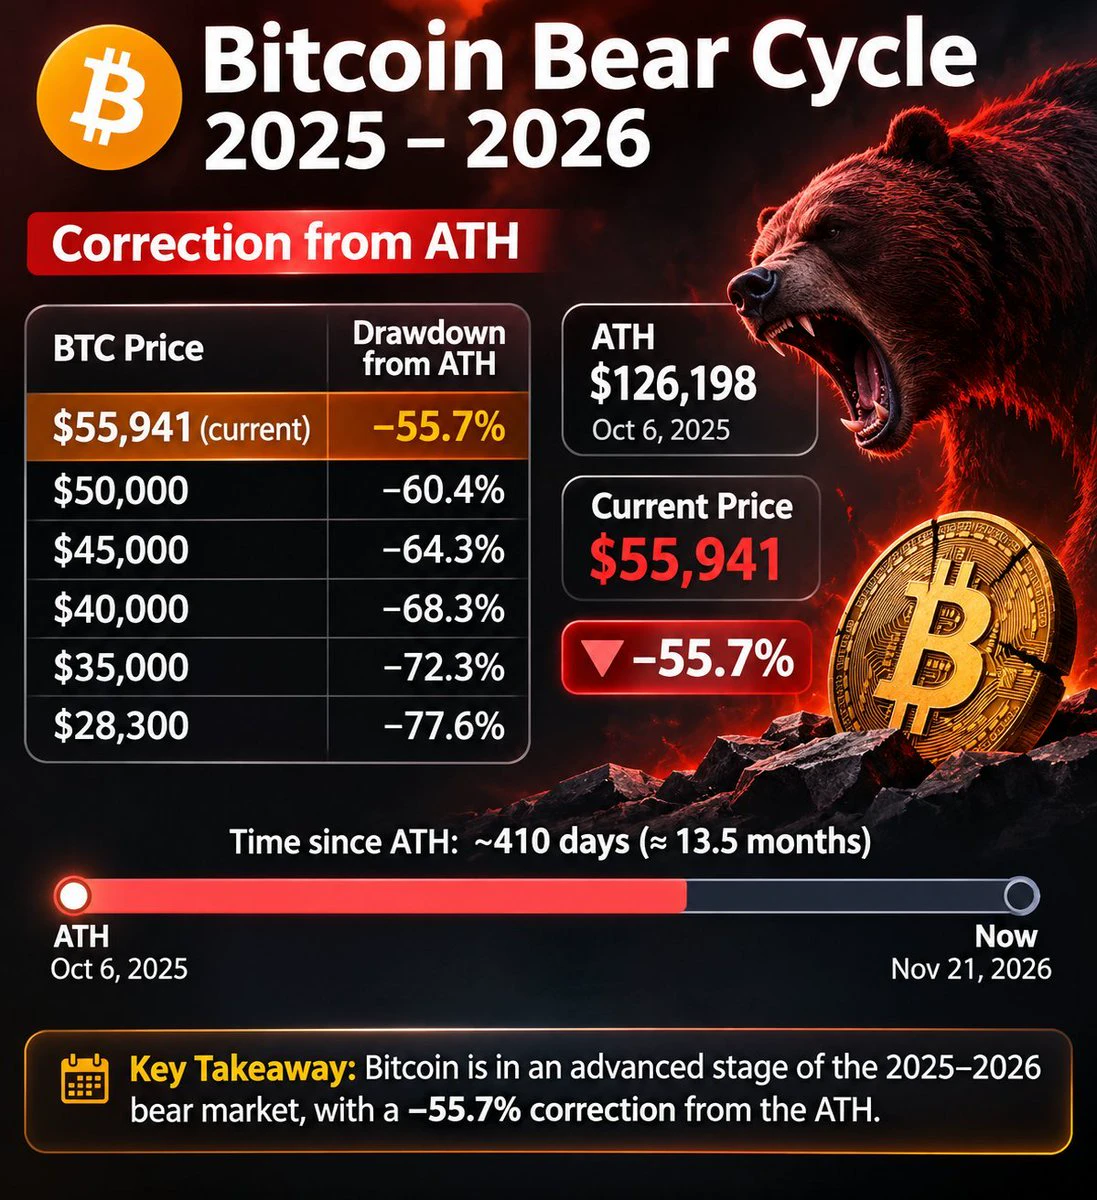
$BTC plunged to $55,500 ⚡🔻

Yesterday, the market experienced a major shock. Bitcoin lost key levels, and altcoins followed suit. But let’s break down exactly what triggered this drop.

1. The U.S. stock market plunged sharply 📉

Tech companies and the artificial intelligence sector came under pressure. The Nasdaq 100 fell about 5.5% in a single day, while Nvidia shares lost around 14%.

Investors began reducing their exposure to risky assets. Cryptocurrency also came under this pressure.

2. Investors are pulling money out of Bitcoin ETFs

In a single day, U.S. spot Bitc
BTC-0.67%
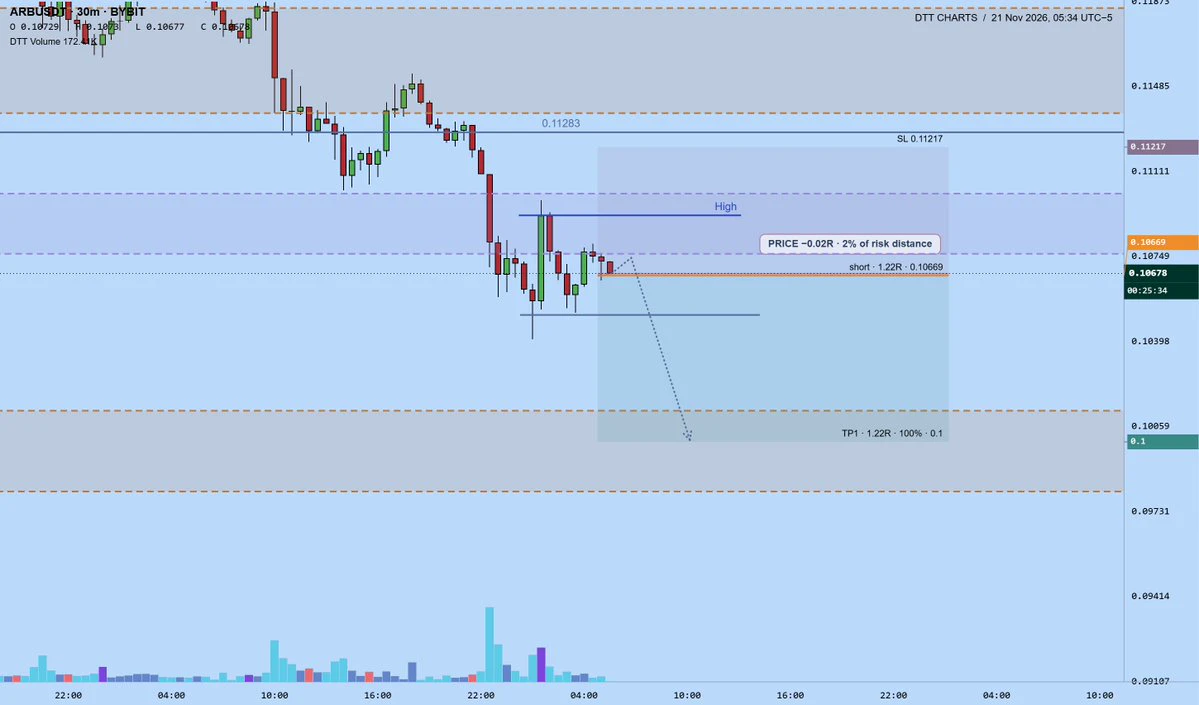
$arb scalp short
sl: $0.11217
Tp: $0.1
1.22R
— DTT
post-image
ARB+1.20%
Sorry, I was wrong 55555.55
Genes will use all kinds of means to keep you constantly transfusing blood for new genes.
post-image
On the evening of November 21, ETH rebounded from its lows and short-term buying support improved somewhat, but it has yet to truly break above the previous high, so for now this looks like a corrective rebound.

First, watch 1634–1636 below. If it holds on a pullback, there may still be a chance to retest 1646–1648 and 1655–1660. If price meets clear resistance in the zone above, then consider a pullback; only if it holds above 1661 and holds on a retest should you look next toward around 1672 and 1682.

Conversely, if 1633 is decisively breached, be alert for a short-term pullback toward the
post-image
ETH-1.23%
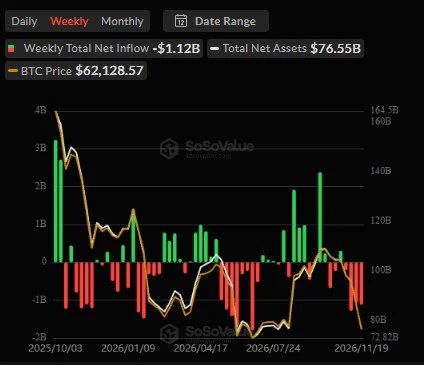
Bitcoin ETFs Face Four Consecutive Weeks of Outflows

U.S. spot Bitcoin ETFs have recorded four straight weeks of net outflows, with approximately $1.25 billion withdrawn during the latest week.

This continued outflow highlights weakening demand for Bitcoin ETF exposure and adds pressure to the market's short-term sentiment.

However, ETF flows can change quickly. The coming weeks will be important to see whether institutional demand returns or selling pressure continues.

ETF flows remain an important indicator to watch when assessing Bitcoin market sentiment.

DYOR. NFA.

#BTCBreaksBelow60K
post-image
BTC-5.94%
  • 1
Load More

Join 40 M users in our growing community

⚡️ Join 40 M users in the crypto craze discussion

💬 Engage with your favorite top creators

👍 See what interests you

Trending Topics

BTCBreaksBelow60K

2.1M Views29.4K Discussing

BTC fell below $60,000 on November 20 for the first time since July, alongside a tech stock selloff and broader pressure on risk assets. Will $60K become resistance, or can BTC quickly reclaim it? What price or volume signals would convince you that selling pressure is easing?

GateDirectIPOPhase3ANTAllocates92100Shares

754.6K Views4.8K Discussing

NvidiaDropsNearly14Percent

316.8K Views7.5K Discussing
View More