
Square
Following
Hot
News
Notifications
Profile
Share your thoughts
placeholder
Article
#ShareWeekly market Faces Heavy Selling Pressure as Bitcoin Rebounds After a Two-Year Low

The cryptocurrency market is experiencing severe volatility following a massive sell-off across global financial markets. Bitcoin (BTC) plunged to approximately $55,251, its lowest level in two years, before recovering above $60,000. The decline reflects growing investor concerns about rising interest rates, weaker technology stocks and reduced institutional demand.

Ethereum (ETH), XRP, Solana (SOL), BNB and other major altcoins also faced significant selling pressure. The market downturn triggered bil
BTC-0.65%
ETH-1.23%
XRP-1.15%
SOL-0.77%
BNB-0.76%
$SOL Under pressure—is $68 the next target???$SOL It has broken below the rising wedge, suggesting the price could fall further to $70.20; if selling pressure continues, it could even drop to $68. Will bulls defend these levels, or will the price continue to fall???
post-image
SOL-0.77%
Trenches
IDOL
I
bade
b
IDOL
0x3b...ab07
Market Cap
$.
Change
.
24h Vol
$.
Holders
.
PIEVERSE
P
bade
b
PIEVERSE
0x0e...25a9
Market Cap
$.
Change
.
24h Vol
$.
Holders
.
FIONA
F
bade
b
FIONA
B34n...pump
Market Cap
$.
Change
.
24h Vol
$.
Holders
.
Singularity
S
bade
b
Singularity
7R4M...pump
Market Cap
$.
Change
.
24h Vol
$.
Holders
.
CLAUDIA
C
bade
b
CLAUDIA
2j5S...W2ZM
Market Cap
$.
Change
.
24h Vol
$.
Holders
.
For more than a month now, we’ve been witnessing history every day. It really leaves you wanting to cry, with nothing you can do about it.
The Nasdaq 100 $QQ peaked on 10/6. Since then, this past month has been packed with nothing but epic trading days.

From 10/6 to 10/16, $SOX fell for 9 consecutive trading days, dropping a total of 16.3% and tying its longest losing streak since listing.

On 10/29, $GOOGL plunged 12.64%, its biggest single-day drop since listing in 2004, wiping out around $500 billion in a single day.
On 10/30, INTC tumbled 28.58%, its worst day at least since 1980.
On 1
post-image
GOOGL+0.11%
BTW is attempting to reclaim the 1-hour MA25; bulls are pushing, but overhead resistance is heavy. Friends, $BTW go long. Execution plan: Entry price 0.6651 - 0.6684 Take profit 0.6990 | 0.725 Stop loss 0.6451 Note: The 1-hour bearish trend is dominant, and the MA25 above presents resistance. Friends, don't go all in. Position size should match your account size.
post-image
BTW-7.42%
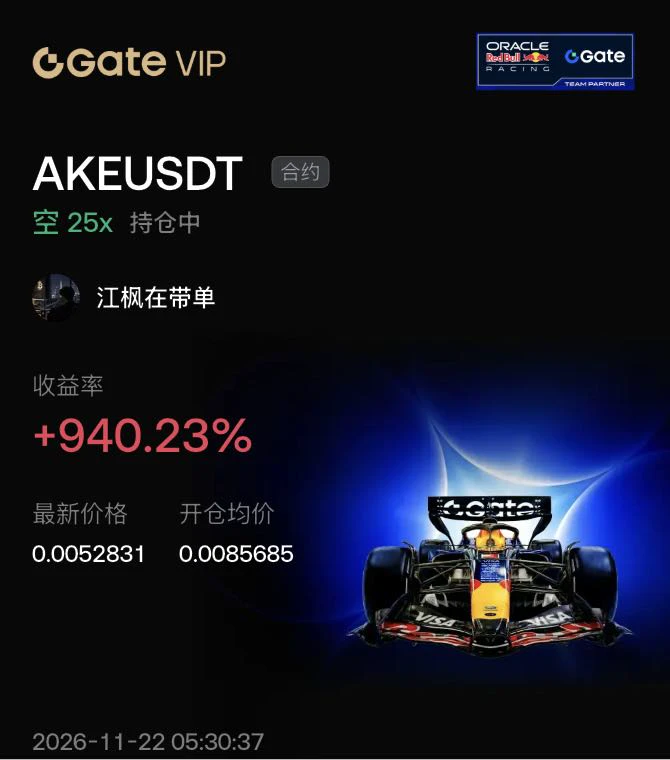
$AKE Unlike other coins, its supply keeps increasing.

Just over 20% of the total supply is circulating. About 2.1 billion tokens are released on the 21st of every month, roughly 10% of the circulating supply. The batch for November 21 has already been released, and another similar-sized batch will come on December 21. This will continue until 2029.

The price is driven by capital, but the number of tokens keeps growing every month. Without a steady influx of new buyers, every unlock is a supply shock.

After this batch was released, the price bounced and then fell, showing that buying demand
post-image
AKE+6.39%
SNDK-0.18%
ETH-1.23%
  • 1
Crypto will make it happen
post-image
Where else but the UK would I hear “I love your outfit” five times a day?
Especially when I’m wearing my Gryffindor scarf and my red boots.
Damn, it moves like a Pixiu
post-image
What kept me from adding to my position that day was that $SNDK SanDisk was starting to look less weak.

On Friday, the SOX fell 7.9%, while it fell 16%—twice as much as the sector. That day, the SOX fell 1.55%, while it was down just 2.4%, basically in line with the sector and no longer singled out for a selloff.

The previous day’s pattern of “falling harder than its peers” didn’t repeat. That suggests some of the overhead selling pressure had eased, and the short-term money rushing to exit after the split had mostly finished selling on Friday.

I opened the short at 92, and most of my profi
SNDK-0.18%
SKHY+0.86%
NVDA-0.35%
  • 1
Everyone, $IDOL is going wild! It surged 79.54% in 24 hours, with strong bullish momentum. Can IDOL sustain this rally, or is a pullback coming soon???
post-image
IDOL-6.71%
$DOGE Whales keep selling, but the price just won’t fall. That itself is a signal. Since November 3, whales holding 100k to 100 million tokens have sold a cumulative 750 million. The selling pressure is real. But after DOGE hit a low of 0.05077, buyers stubbornly pushed it back up. The bears can’t drive it lower anymore.‌

How many people kept shorting after seeing the on-chain data showing “whales trimming their holdings,” convinced that 0.05 would eventually break? But the price kept finding support above 0.05. Short sellers saw higher lows each time, and sentiment shifted from “waiting for
DOGE-0.18%
BTC-0.65%
ETH-1.23%
I signed up for the annual gala, and I’m campaigning in the plaza now. Guys, head to the event page and give me some support points. It’s completely free, and after you send them, you can still enter the support-point raffle. You’ll win the prize yourself—I just want the ranking. Just click the link below. Help me out 🙏
https://www.gate.com/zh/competition/Annual-Gala?ref_type=165&ch=Direct&ref=UVdMV1w
  • 1
BTC Technical Outlook: Bitcoin Drops Toward $60K

Bitcoin is facing strong selling pressure after breaking below its previous support structure and the rising trendline. BTC is currently trading around $60,193, following a sharp decline from the $80K–$86K region. Price is now testing the major support area near $60,155, while momentum remains heavily bearish.

The latest breakdown, combined with increased selling volume, suggests that sellers remain in control. However, the RSI has entered oversold territory, meaning a short-term relief bounce is possible if buyers defend the current support.
BTC-0.65%
  • 4
Crypto market update anylsis overall
live-cover
LIVE1,443
BTC-0.67%
ETH-1.26%
SOL-0.77%
ZEC+1.16%
XRP-1.15%
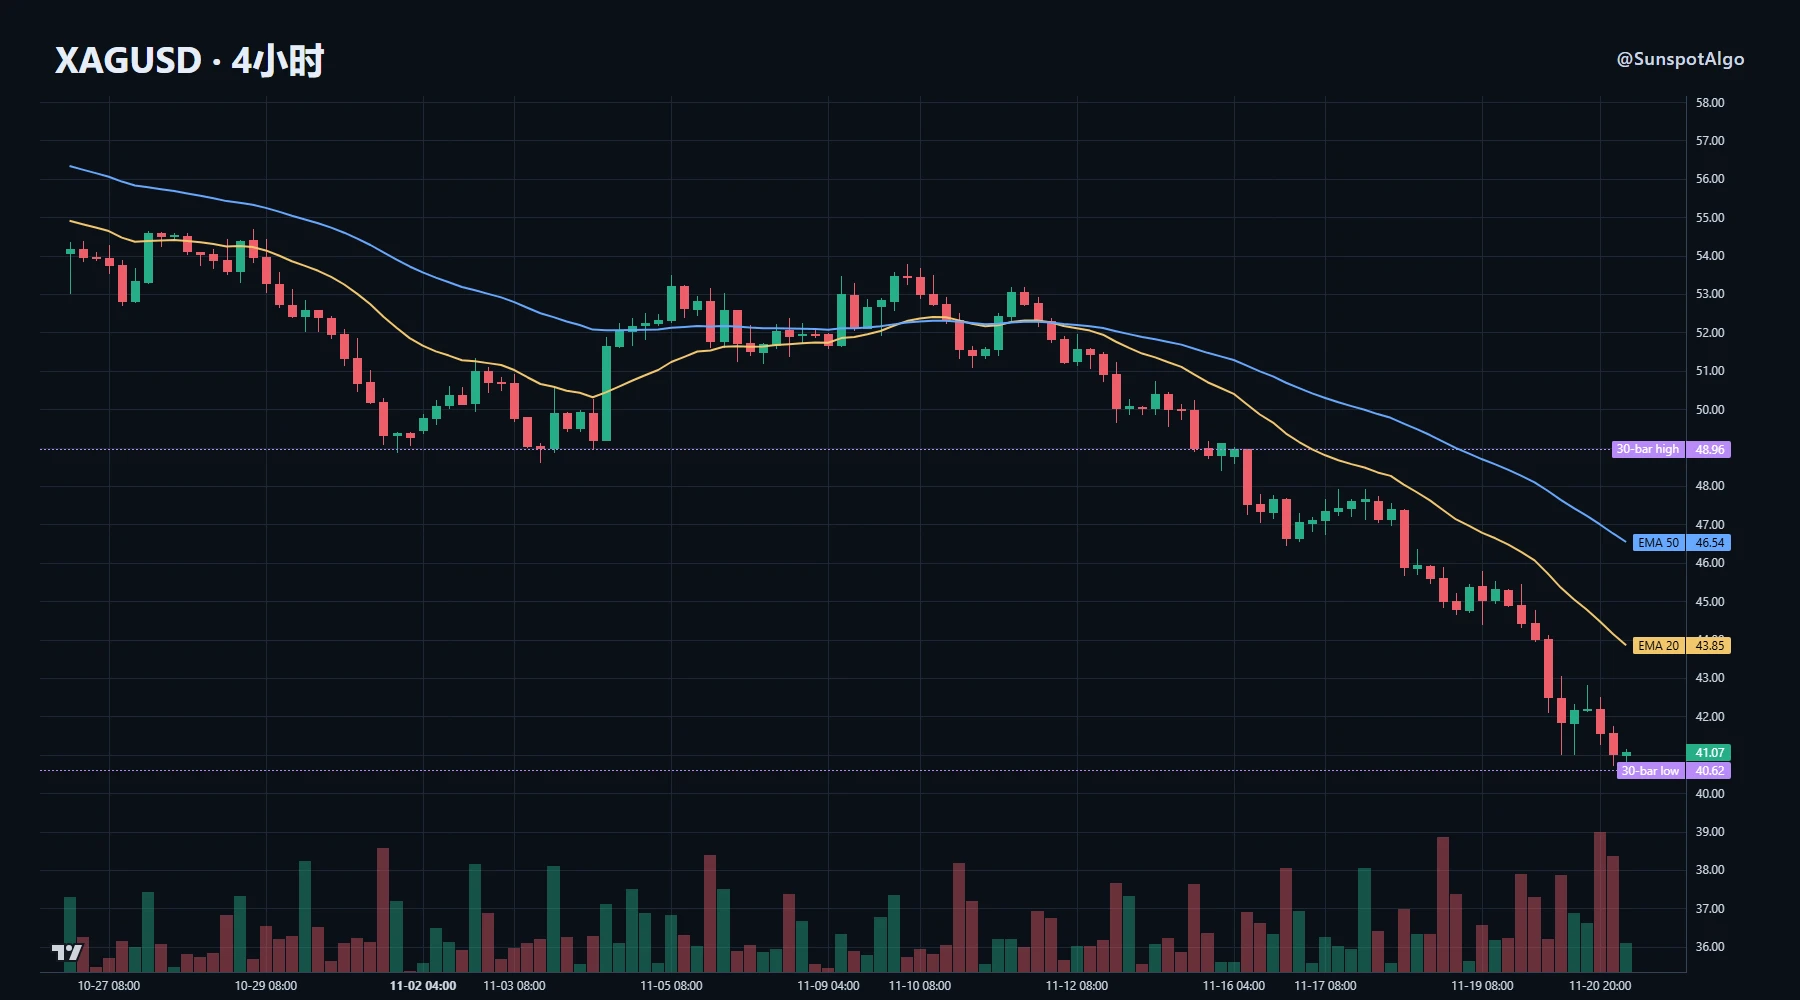
The rhythm of this silver sell-off is more noteworthy than its magnitude.

A roughly 16% drop over 5 days pushed silver to the bottom of its 30-day range at 40.9, while gold fell less than 10% over the same period. The chart’s rhythm has three notable details: the 4H 20-period moving average is at 43.9, while price is at 41.1, a deviation of over 6%; the volume ratio is 1.76, clearly indicating elevated volume; and ATR is at the 92nd percentile of the past 60 candles. The long lower wick around 40.6 was a classic stop-loss sweep: after breaking below that level, price failed to reclaim it, and
post-image
XAG+0.47%
XAU+0.38%
Whales Mves in Sync!
live-cover
LIVE85
BTC-0.67%
ETH-1.26%
ZEC+1.16%
SOL-0.77%
USDC+0.01%
I’m long $VVV . Trade parameters: Entry: 23.432 - 23.959 Target 1: 25.025 Target 2: 26.089 Exit: 22.495 VVV has temporarily pulled back at MA25 support; it’s time to add to the position again, kick off a new rally, and challenge the highs. Trade here with me. My list today includes
‍$NAORIS and $ETH .
post-image
VVV+0.37%
NAORIS+0.66%
  • 1
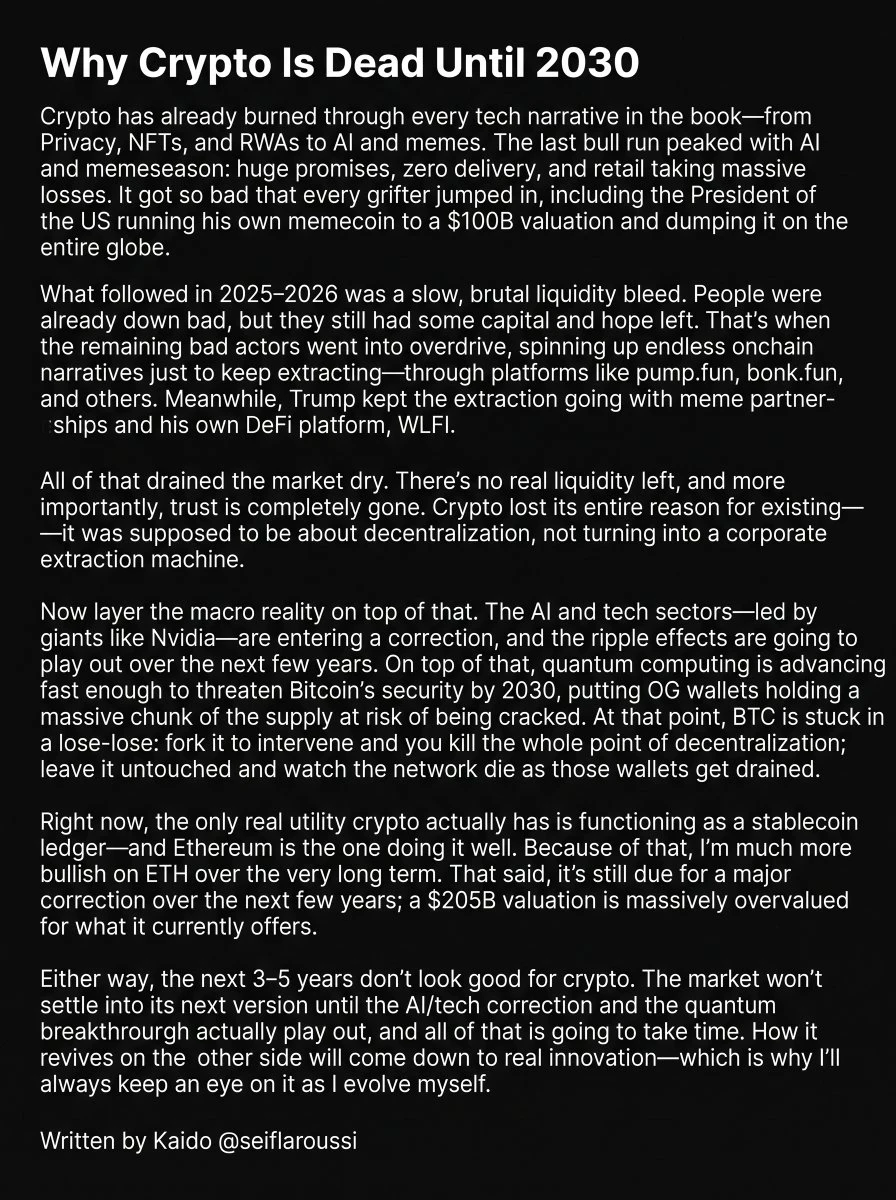
Market thoughts for the coming years
post-image
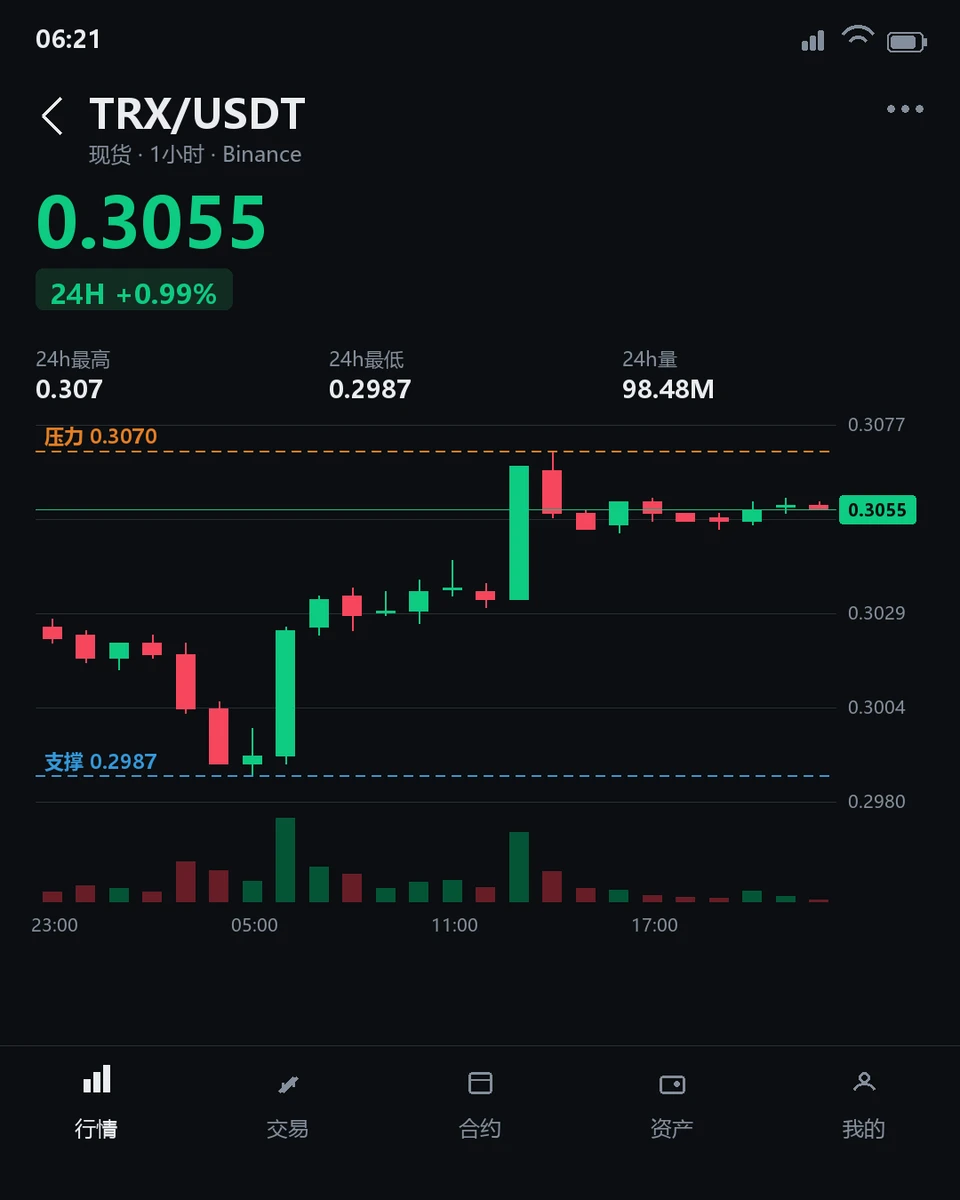
$TRX Is Strong in the Short Term but Weak on the 4-Hour Chart—Which Will Turn First?
$TRX is currently trading at 0.3055, up 0.958% over the past 24 hours, with an intraday range of 0.2987–0.307. The 1-hour chart shows strength, with the price above the EMA20 at 0.30456. The RSI14 is 67.53, in neutral-to-bullish territory, but the volume ratio is just 0.21, far below average, indicating limited participation from short-term buyers. The 4-hour chart remains weak: the price is still below the EMA20 at 0.30594, and the RSI14 at 37.21 has yet to recover from weak territory. Resistance is far above
post-image
TRX+0.42%
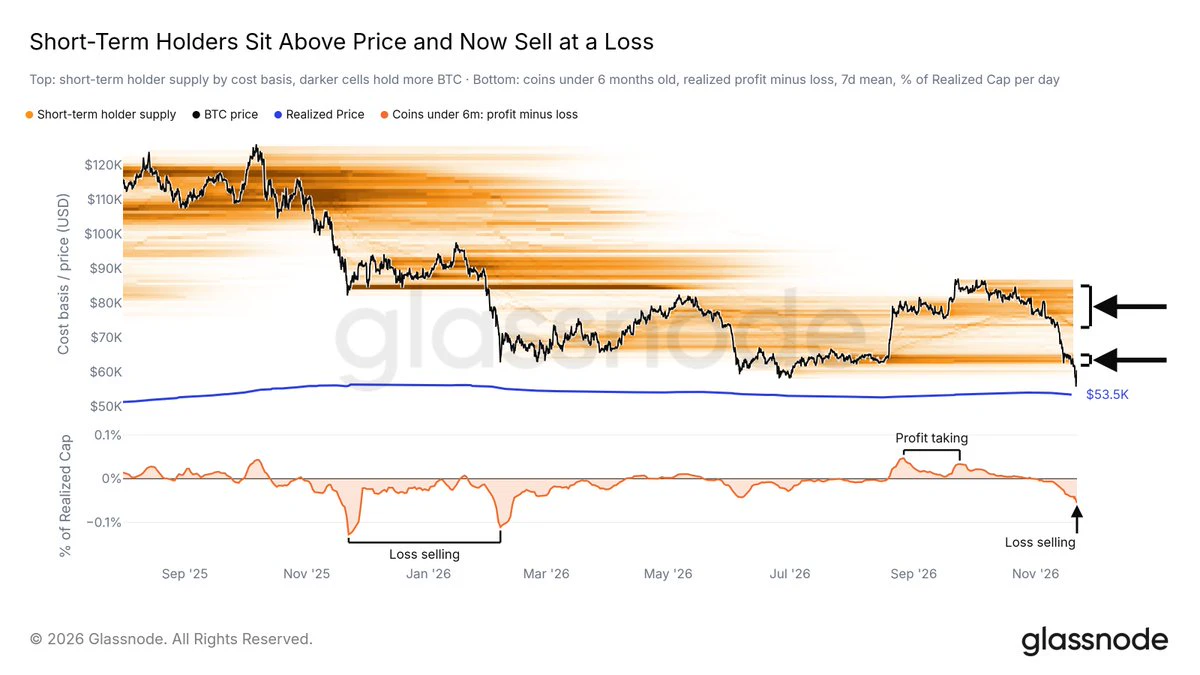
The short-term holder cluster under bitcoin:native has failed to hold.
As price broke below the $62K–$65K block, short-term holders started ramping up their selling at a loss.
Cost basis clusters like this often become resistance once price is below them.
post-image
BTC-0.67%
Load More

Join 40 M users in our growing community

⚡️ Join 40 M users in the crypto craze discussion

💬 Engage with your favorite top creators

👍 See what interests you

Trending Topics

BTCBreaksBelow60K

2.1M Views30K Discussing

BTC fell below $60,000 on November 20 for the first time since July, alongside a tech stock selloff and broader pressure on risk assets. Will $60K become resistance, or can BTC quickly reclaim it? What price or volume signals would convince you that selling pressure is easing?

GateDirectIPOPhase3ANTAllocates92100Shares

794.1K Views4.9K Discussing

NvidiaDropsNearly14Percent

332.6K Views7.6K Discussing

View More