


Square
Following
Hot
News
Profile
Share your thoughts
placeholder
Article
Shorts dump it down 22.5%, $ANIME volume ratio 5.938—I’m bullish
$ANIME Currently at 0.00291, down 22.5% in 24h. I’m bullish at this level—the shorts are dumping their bags to you.
Futures sentiment is bearish, with a funding rate of -0.00064505 and a long-short account ratio of 0.9124. Shorts are overwhelmingly dominant. But spot isn’t buying it: 24h trading volume is 5564918 USDT, and the volume ratio has hit 5.938, with huge volume being fully absorbed. Daily RSI at 63.3 is strong; MACD has formed a golden cross below the zero line, and the red bars are still growing.
The headwinds are rea
ANIME-22.38%
A whale/institutional entity holds ETH long positions worth over $270 million that are now on the ve
live-cover
LIVE1,715
Trenches
STONK
S
bade
b
STONK
6GmA...UNgx
Market Cap
$.
Change
.
24h Vol
$.
Holders
.
BTC
B
bade
b
BTC
C5xp...pump
Market Cap
$.
Change
.
24h Vol
$.
Holders
.
CNPY
C
bade
b
CNPY
0xc6...ddd2
Market Cap
$.
Change
.
24h Vol
$.
Holders
.
LAUNCH
L
bade
b
LAUNCH
AhBi...Qj6C
Market Cap
$.
Change
.
24h Vol
$.
Holders
.
ZIG
Z
bade
b
ZIG
0x8c...1145
Market Cap
$.
Change
.
24h Vol
$.
Holders
.
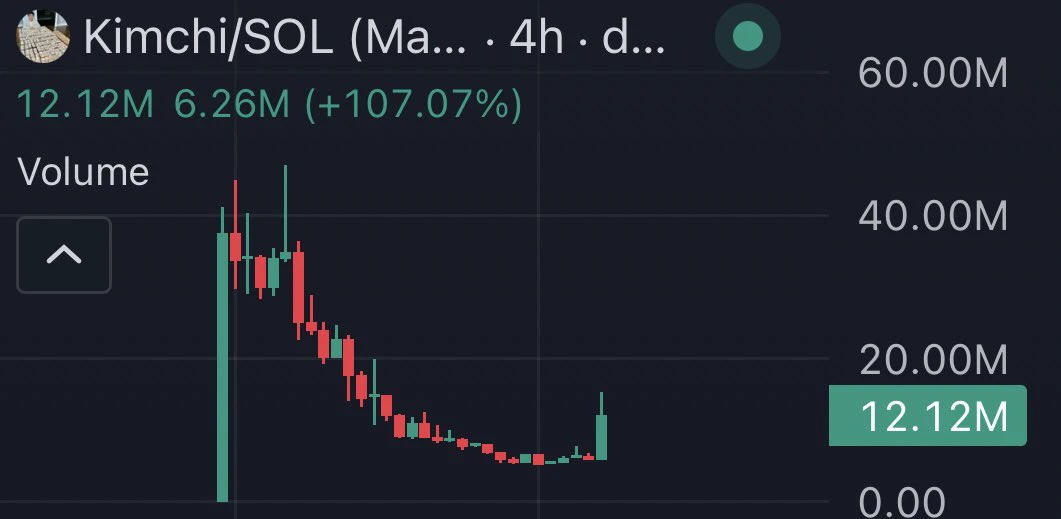
Is this pumping again just because @kimchi1x putted in his bio the link???
That means pull mfs
solana:CSocnzcRpgSCr1naKcNTieWZUxb6rABe45j844m7pump
post-image
SOL+0.18%
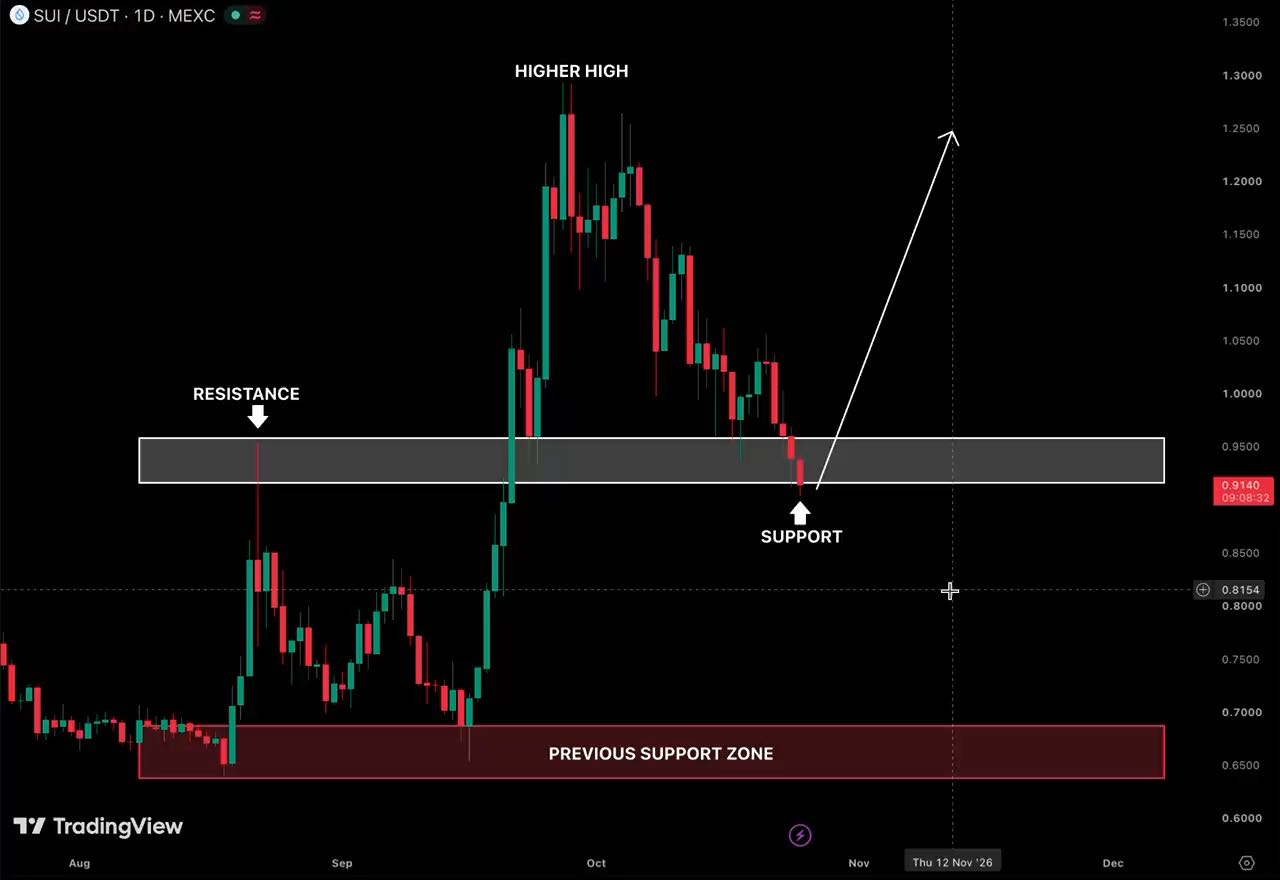
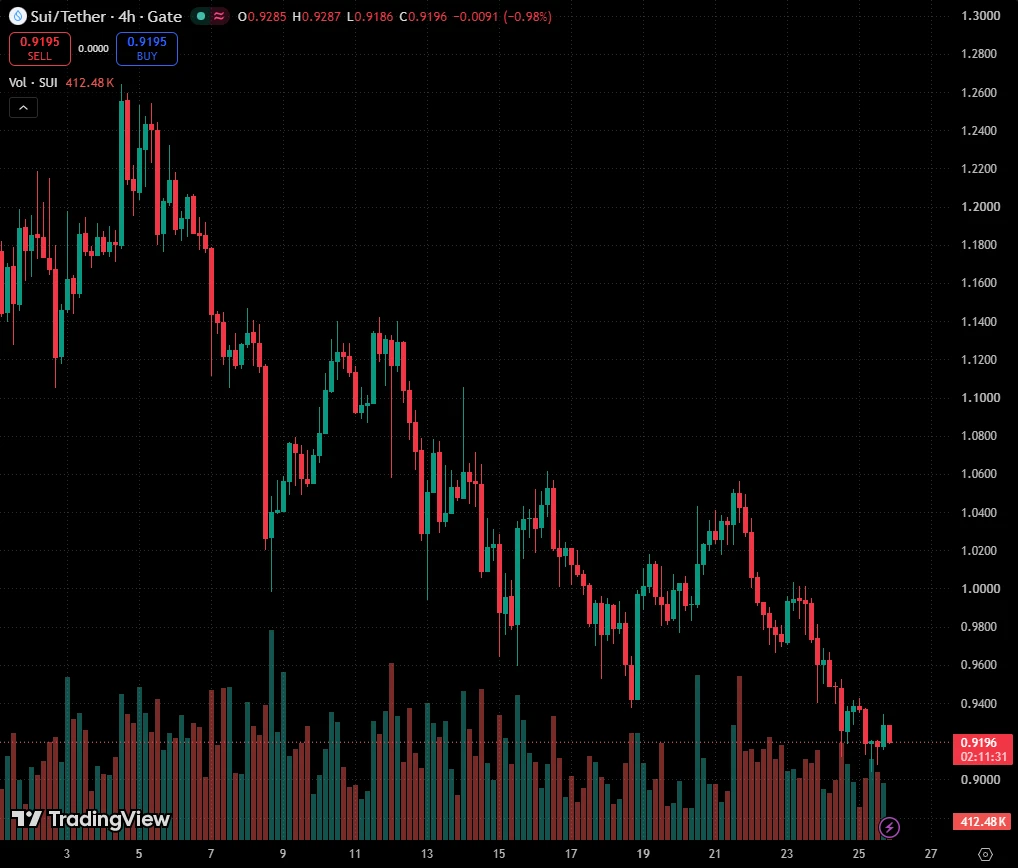
$SUI SUI analysis
SUI analysis:
The price is currently testing a major support area, which may lead to a bounce. Additionally, there is a falling wedge pattern; a breakout from this pattern could result in a significant upward rally. Consider opening long positions, but be sure to use a tight stop-loss.
post-image
SUI-0.51%
The busiest crypto week of the year.
→ Wed. 28: Fed (7 p.m., Paris), Microsoft & Alphabet
→ Thu. 29: PCE and Q3 GDP
→ Fri. 30: About $11B in options expire
$BTC : about $80.5K. Cited threshold: weekly close above $82K.
Which event will have the biggest impact?
MSFT+0.56%
BTC+0.00%
10.26 Qiqi Discusses Gold Morning Review: A slight rebound from the lows—do not mistake it for a reversal signal!
Gold prices fluctuated slightly within a low range during the morning session, recovering modestly. The current price is near 3998. Overnight, prices retested the 3990 area at their lowest, then climbed to 4004 before facing resistance and pulling back—a brief consolidation after a sharp drop.
On the one-hour chart, the moving averages remain bearishly aligned, with prices trading below them. The broader downtrend remains unchanged. The MACD is below the zero line, and the red bars
post-image
XAU+0.38%
Here's our portfolio: 📊
Top performer: SOL with a stellar +10.79% APY! 🚀 Loving the DeFi vibes and the yield potential. Always on the hunt for the next alpha.
#Crypto #Trading #Portfolio #DeFi
Ready to start your journey?
post-image
SOL+0.18%
#美股财报季 #Gate广场万圣节 Tesla: Earnings beat expectations, yet the stock closed lower—is this an unjustified sell-off?
This isn’t a collapse in performance; the market is repricing the “cost of transformation.”
Breaking down the numbers, it’s a case of “good earnings, bad stock performance.”
- Revenue: $28 billion, flat year over year; net income: $787 million, down 43%—the money wasn’t lost, it was eaten up by R&D: R&D spending was $2.76 billion (+69%), and operating expenses rose 39% overall.
​- But gross margins are rising: automotive gross margin excluding credits was 18.1% (versus expectations
post-image
ThisIsTranslateContent:
#美股财报季 #Gate广场万圣节 Tesla: Earnings beat expectations, yet the stock closed lower—is this an unjustified selloff?
This isn’t an earnings collapse; the market is repricing the “cost of the transition period.”
Break down the numbers, and it’s really a case of “good earnings, bad stock performance.”
- Revenue was $28 billion, flat YoY; net income was $787 million, down 43%—the money wasn’t lost, it was eaten up by R&D: R&D was $2.76 billion (+69%), and operating expenses rose 39% overall.
​- But gross margins are rising: automotive gross margin excluding credits was 18.1% (16.7% expected), energy storage gross margin soared to 33.1%, and Megapack capacity for 2027 is basically sold out.
​- Free cash flow was +$1.5 billion (market expectation: -$4.4 billion), and cash stood at $45.4 billion—plenty of cushion.
The truly valuable change is in the “revenue mix”:
- FSD paid subscribers reached 1.74 million (+67%); 75% of new vehicles in North America are optioned with FSD—the car-selling business is turning into a subscription business;
​- The Austin Cybercab fleet has logged nearly 2 million miles of unsupervised driving, an 8x increase in one quarter, with a launch in Dallas next month.
Why did the stock fall?
There’s only one reason: capex was cut from $25 billion to $20 billion. The market interpreted this as “pushing back the profitability timelines for Robotaxi/Optimus.” This isn’t a cut to the vision, but a cut to the pace.
Risks: BYD’s all-electric vehicle sales led by 300,000+ in the first three quarters, and Chinese automakers have overtaken Tesla in gross margin; Musk himself said Optimus mass production is “at least another year away”; Robotaxi expansion is held up by regulatory approvals.
Watch three near-term catalysts—the pace of launches in new cities like Dallas, whether net FSD subscription additions can continue, and whether Q4 cash flow stays positive.
The valuation already prices in the next ten years (Morgan Stanley’s price target is $410), making this a high-volatility transition stock that “uses the present to fund the future”—suited to tracking and validating, not going all-in on the story. #每周来晒

repost-content-media
TSLA-0.62%
  • 3
$SUI is testing the breakout zone again
This was resistance before, and now bulls need to prove it can hold as support
If it does, a bounce toward $1.10 and potentially $1.25 wouldn’t surprise me
Let’s see if buyers actually show up or if this level was just temporary support
SUI-0.48%
Futu, the Nasdaq-listed broker behind moomoo with HK$1.40 trillion in client assets, now lets professional investors in Hong Kong deposit and withdraw BNB.
They can move it over BNB Smart Chain between self-custody wallets and Futu crypto accounts.
@BNBCHAIN
FUTU+0.26%
BNB+0.93%
#Gate广场万圣节
PEPE/USDT Analysis Ahead of Halloween: Assessing the Potential for a 3x Rally
As the Halloween period approaches, market participants are watching assets for potential volatility. As for whether PEPE/USDT is poised for a 3x rally, current technical data indicate that the asset is consolidating, not on the verge of an immediate breakout.
A 3x rally from the current price of 0.000004382 would require the price to reach around 0.000013146. Although historical price action on the weekly chart shows levels above this mark, reaching this target would require significant structural change
EGY
EGYEgypt
Gate.Fun
MC:$3.61KHolders:1
0.16%
KatyPaty
#Gate广场万圣节
PEPE/USDT Pre-Halloween Analysis: Assessing the 3x Potential
As the Halloween period approaches, market participants are monitoring assets for potential volatility. Regarding the question of whether PEPE/USDT is preparing for a 3x increase, current technical data indicates that the asset is in a consolidation phase rather than an immediate breakout.
A 3x increase from the current price of 0.000004382 would require the price to reach approximately 0.000013146. While the weekly chart shows historical price action above this level, achieving this target requires significant structural changes. Here is the objective technical breakdown.
1-Week Chart Analysis
The weekly timeframe shows the price trading at 0.000004382. This is above the middle Bollinger Band at 0.000003380 but below the upper band at 0.000004726. The MACD indicator is in positive territory with the DIF at 0.000000079 and the DEA at -0.000000127. This indicates that the long term recovery trend remains intact. However, the On-Balance Volume is trending downward.
1-Day Chart Analysis
On the daily chart, the price is positioned between the middle Bollinger Band at 0.000004186 and the upper band at 0.000004666. The MACD is positive, with the DIF at 0.000000106 above the DEA at 0.000000075. The data shows short term stability within the current range.
4-Hour Chart Analysis
The 4-hour timeframe displays recent downward pressure. The price is currently below the middle Bollinger Band at 0.000004511 and is testing the lower band at 0.000004151. The MACD is negative, with the DIF at -0.00000005 below the DEA at 0.000000026. The MACD histogram is slightly negative, and the On-Balance Volume is trending down, confirming recent selling activity.
The Path to a 3x Increase
The data does not show an immediate setup for a 3x increase. The asset is currently consolidating. To achieve a 3x target, the price must first break through multiple resistance levels.
The immediate resistance is the 4-hour middle band at 0.000004511 and the daily upper band at 0.000004666.
A confirmed breakout above the recent high of 0.000005361 is necessary to establish a new upward structure.
Reaching 0.000013146 requires a sustained increase in trading volume and continuous higher highs across all timeframes.
During the Halloween holiday, market dynamics can change rapidly. Monitoring volume and resistance levels objectively is required to evaluate if the asset can transition from consolidation to a confirmed upward trend.
#GateSquareHalloween $PEPE ‌
repost-content-media
PEPE-3.73%
  • 3
If you’re thinking about buying $SUI or you already hold it...watch this first 📽️
I’m dropping it to my subscribers before it hits YouTube this week.
Link down below 👇
post-image
SUI-0.48%
ETF funds wash back and forth like tides, flowing in quickly and leaving just as fast. Market sentiment swings sharply with the direction of fund flows—inflows spark cheers that the bull market is back, while outflows trigger fears of an impending crash. 😂
But looking at the market calmly, this looks more like a typical shakeout and should not be overinterpreted.
The short-term outlook is indeed weak, and another sizable correction is likely ahead. The key variable is the Fed meeting: if it signals a continued hawkish stance, rate-cut expectations disappoint again, and U.S. stocks weaken, Bit
post-image
BTC+0.00%
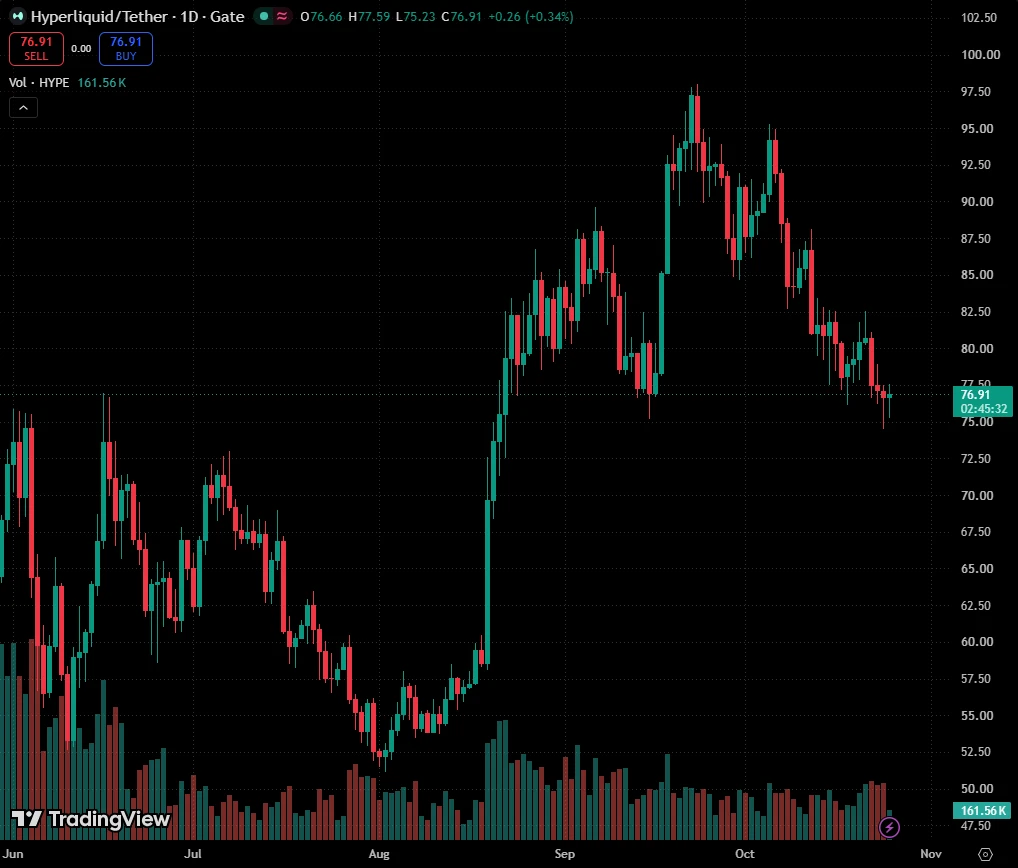
$HYPE buying zone hype?
hype holds strong on the support zone, it could be a buy zone for spot if holds
post-image
HYPE+0.79%
crypto Market updates
live-cover
LIVE1,101
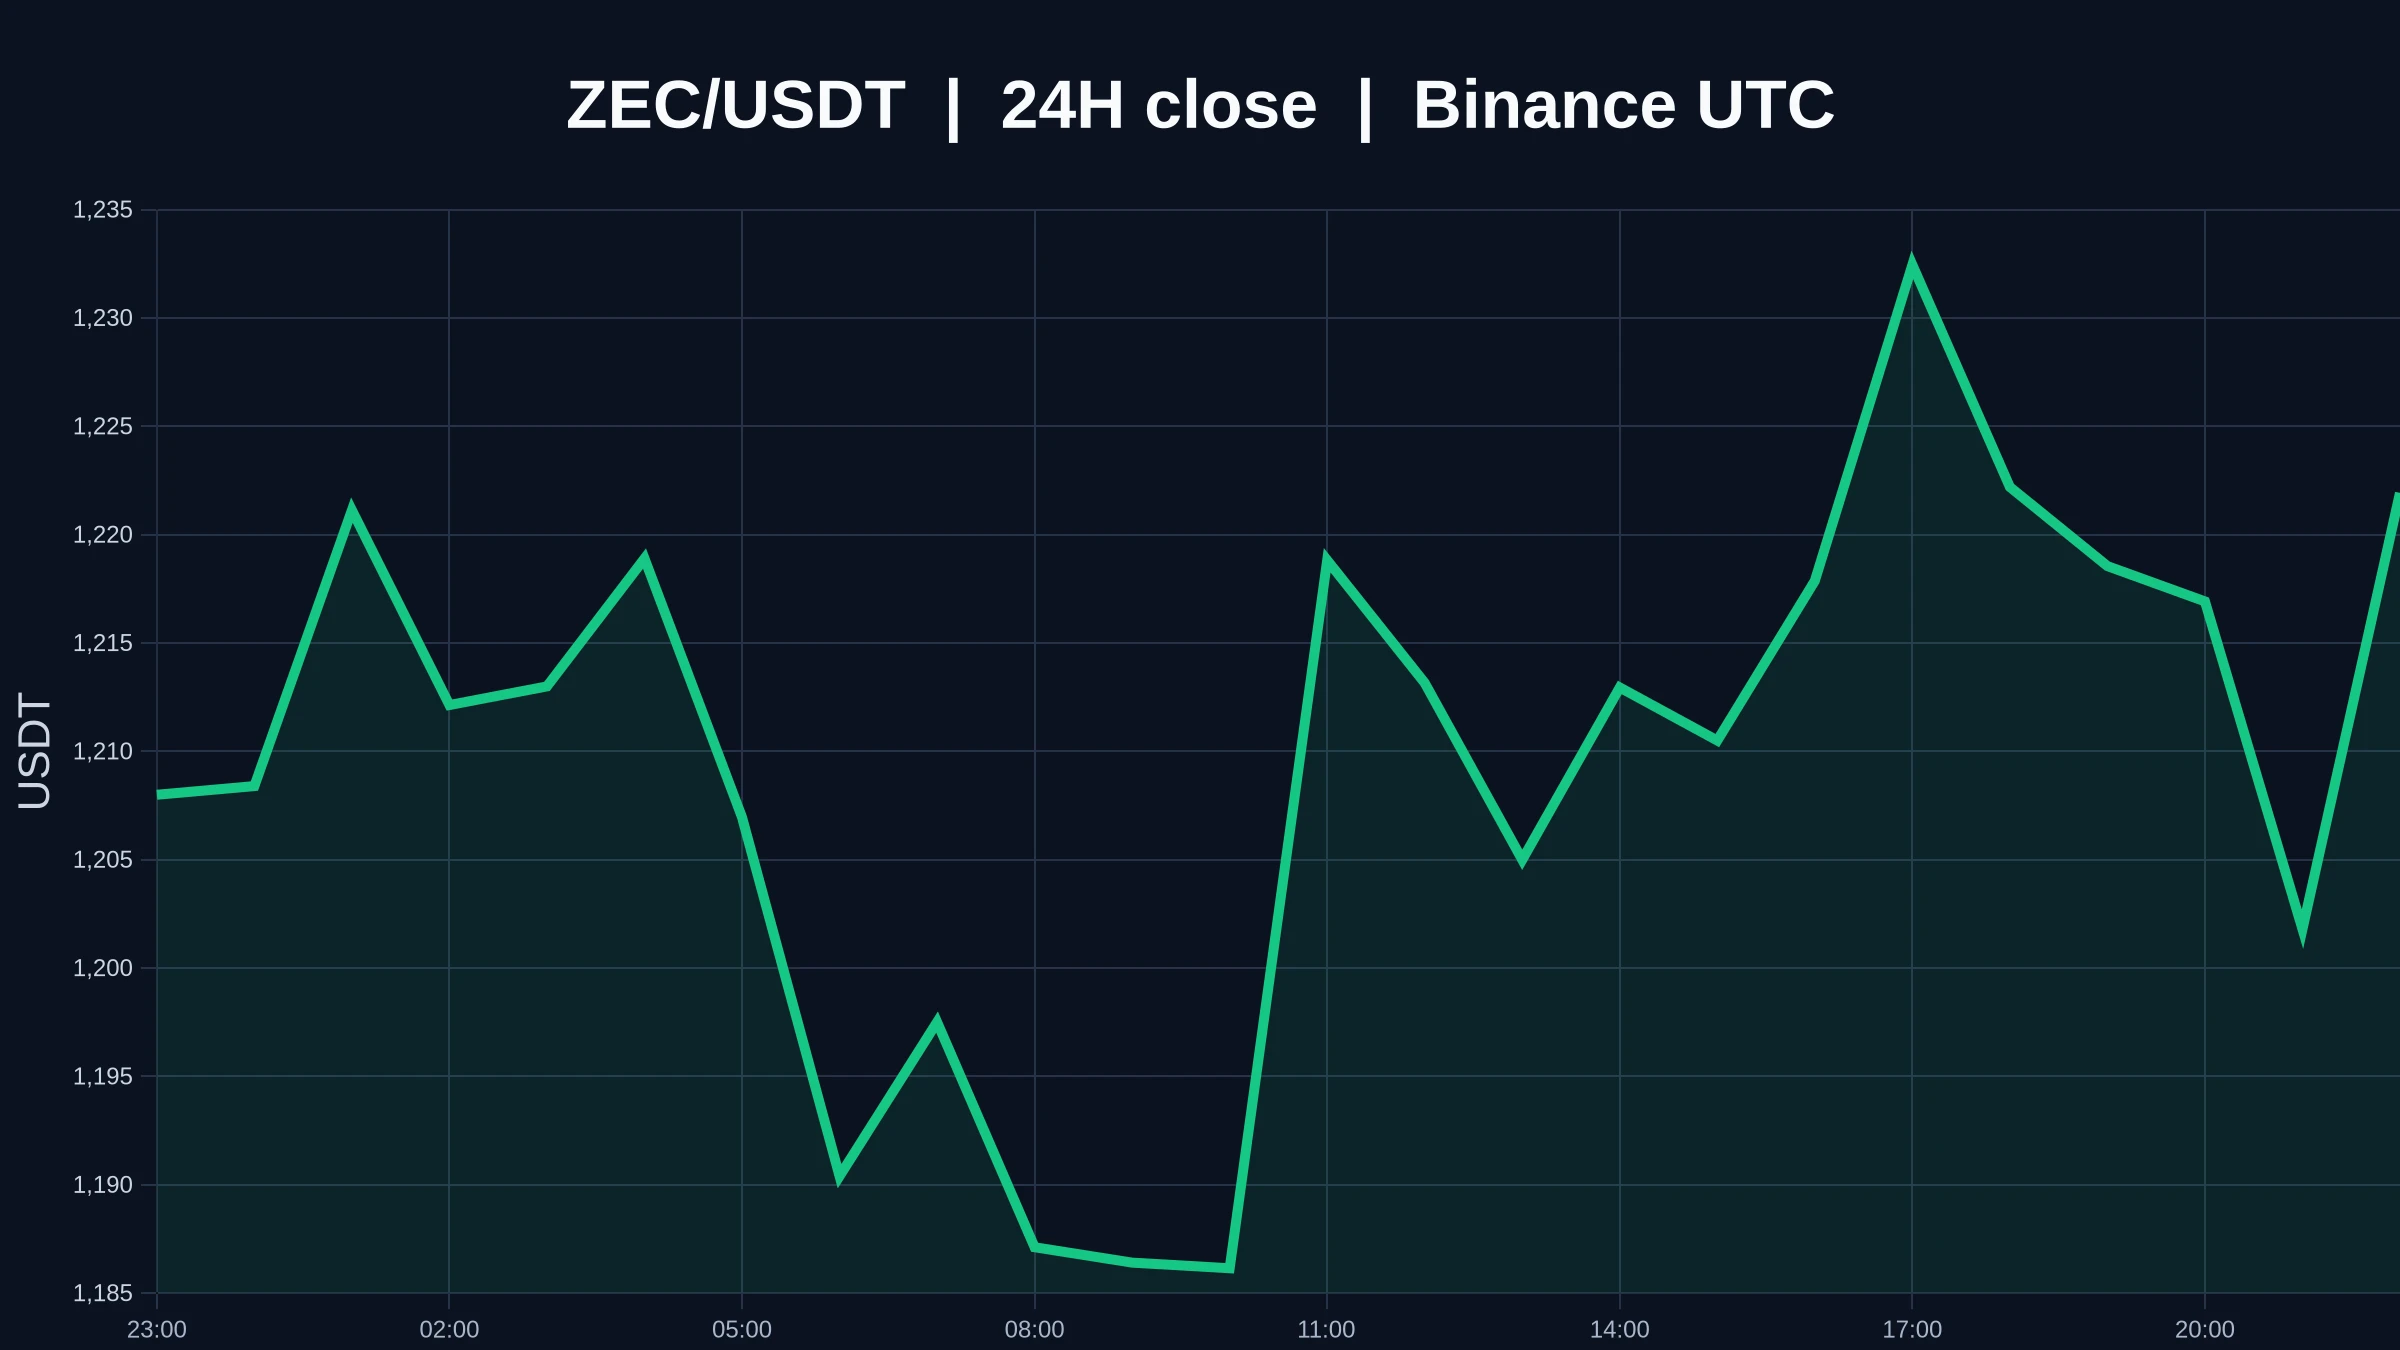
$ZEC 's 24-hour performance is +1.64%, but that is neither a cause nor a forecast. What can be confirmed now is 1,220.59, 1.17x volume, and strength on both the 1-hour and 4-hour timeframes.
The easiest mistake here is to treat a single upper wick as a completed breakout, often overlooking the real selling pressure near resistance. I would treat the first move above as a probe, and only count it as a valid breakout if price holds after a retest.
The chart can be simple: below 1,176.48 is one outcome, above 1,238.96 is another, with wider boundaries at 1,118.55 and 1,337.85, respectively.
In the
post-image
ZEC+1.50%
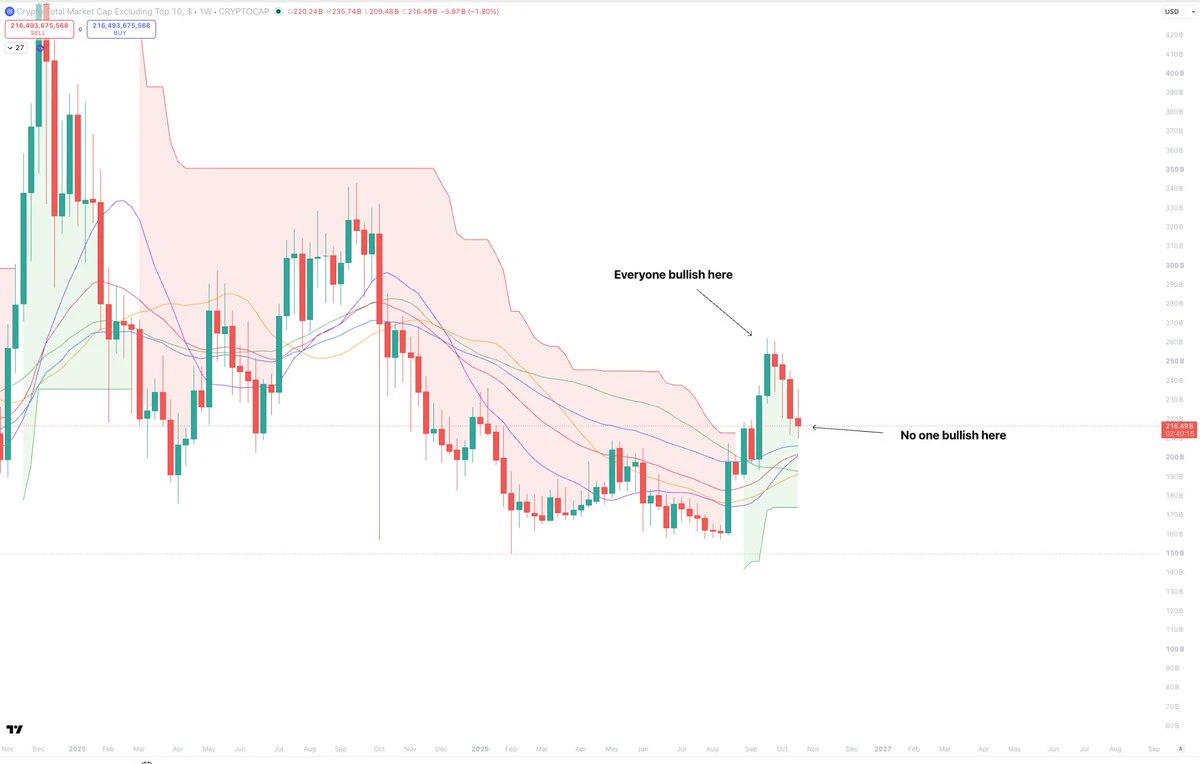
Altcoins also look great here.
It's looking like we're about to put in our 4th red weekly candle, and the crowd has turned very bearish again.
OTHERS is an a strong weekly uptrend, also has not retested any of the key EMA + SMA's yet, and is holding structure.
There is nothing bearish about this chart guys.
If you were not positioned, and then decided to buy the local top... but are not buying now, what are you doing here?
It is always the same old story.
Everyone bearish at the low
Then many bullish at the local high
Then everyone bearish again on the pullback
How can you ever sell higher if
post-image
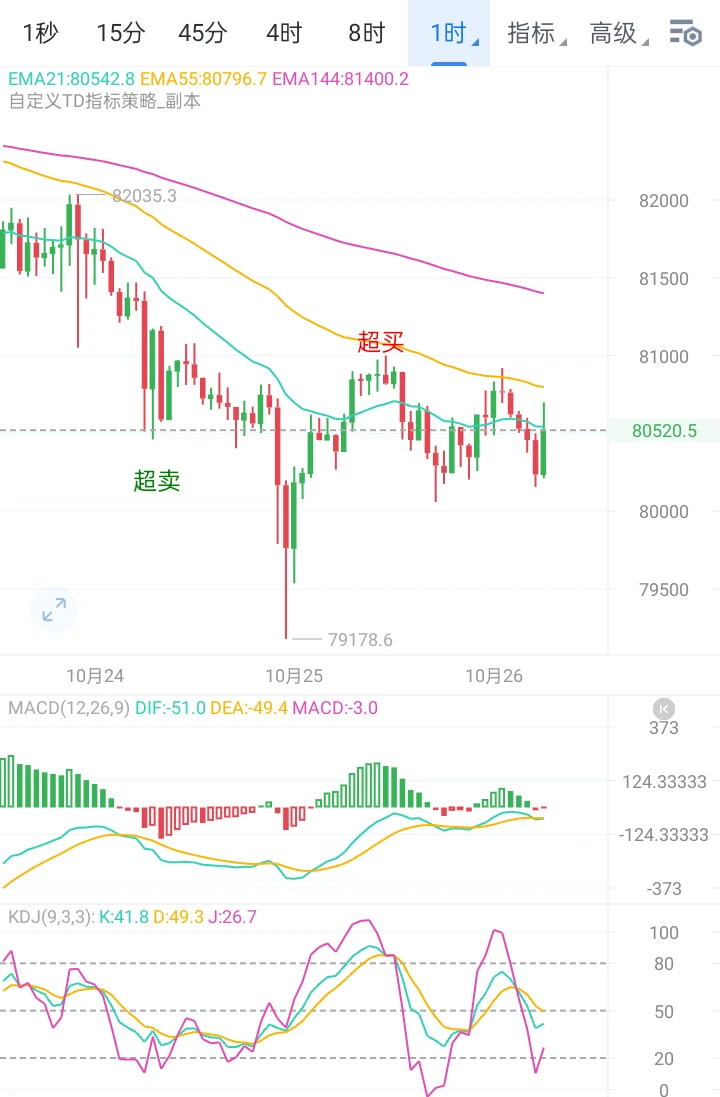
Last night, BTC faced resistance around 80900 and fell, bottoming at 80100 early this morning before stabilizing and bouncing. The price has now recovered to around 80500. Overall, the move has been characterized by “fast declines and slow rebounds.” The bounce was only 400 points, failing to reach even last night’s starting point of 80900, let alone break above the round-number level of 81000. This suggests limited buying interest, with the rebound driven more by short covering than active buying.
Structurally, the 80500–80600 area was a consolidation zone during the previous decline, where
post-image
BTC+0.00%
10.26 Jinying Gold Morning Analysis: Oversold bottoming out and rebounding after finding support; buy dips intraday to trade a corrective rebound!
Spot gold extended its downward momentum overnight, briefly dipping to a low of 3975.72 before quickly recovering. It is currently quoted at $3999.01 per ounce, consolidating in a narrow range around the 4000 mark this morning. Demand for a corrective rebound is gradually emerging after the short-term oversold conditions.
Technically, gold prices have fallen steadily from the 4-hour high of 4198, shedding over 220 points in total, with clear signs o
post-image
BTC+0.00%
ETH+0.26%
  • 1
Load More

Join 40 M users in our growing community

⚡️ Join 40 M users in the crypto craze discussion

💬 Engage with your favorite top creators

👍 See what interests you

Trending Topics

USEarningsSeason

106.47k Views3.54k Discussing

The U.S. Q3 earnings season is in full swing, with major tech companies including Tesla and Meta reporting results. Market focus is shifting beyond revenue and profit toward AI spending, capital expenditure, margins and forward guidance. Which company’s earnings are you watching most closely?

GateWCTCS9GlobalTradingCompetition

742.79k Views8.12k Discussing

USConsumerSentimentNearRecordLow

13.43k Views308 Discussing

View More