Square
Following
Hot
News
Profile

YunxiangWealthLectureHall

vip
Market Analyst
Crypto Market Researcher
Futures Trading Strategist
Guanlan | Yunxiang Research Institute · Yunxiang Wealth Lecture Hall Live at 10:30 / 20:00, Strategy Reminders + Point Analysis Proprietary Team: Follow Indicators · Quantitative · Intelligence · Asset Management Stay grounded, unify knowledge and action (Strategies are for reference only and do not constitute investment advice. The market carries risks, and follow-up risks are at your own risk.)
16
Following
13.6k
Followers
1.3k
Liked
Pin
The essence of trading: Complete real-market training closed-door course!
live-cover
420 views07-06 13:28
Ended • No Replay
The Nasdaq has turned into compound growth, while A-shares have turned into a cycle. Behind the index levels lies the gap in market ecosystems and return mechanisms.
The numbers are striking, but the fact that the Nasdaq reached new highs after 20 years while the Shanghai Composite is still treading water is certainly worth serious reflection by the A-share market.
post-image
NAS100+0.72%
October 1, Happy National Day!
This week’s four-market overview:
BTC 4H screenshot price is approximately $83,648, with key support at $83,000–$82,560 and resistance at $85,000–$85,650. Only a move above $85,650 would create an opportunity to reopen upside potential.
ETH is approximately $2,691, with support at $2,660–$2,616. It will not have the conditions for an accelerated catch-up rally until it breaks above $2,789.
Gold is approximately $4,166 and remains below the EMA30 and EMA120. $4,116 is the defensive level, while $4,200–$4,293 is the rebound confirmation zone.
The Nasdaq 100 is appr
post-image
BTC-0.10%
ETH-0.72%
GLDX-0.92%
PAXG-1.01%
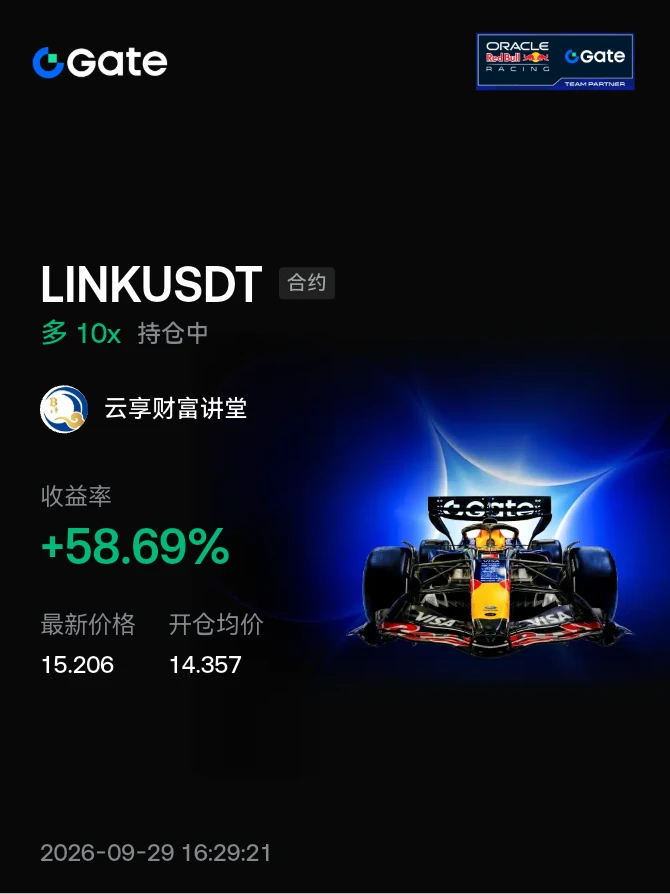
#晒出我的持仓收益 The recent market has frequently been setting bull and bear traps, so focus on the short term.$LINK
post-image
LINK-1.27%
  • 1
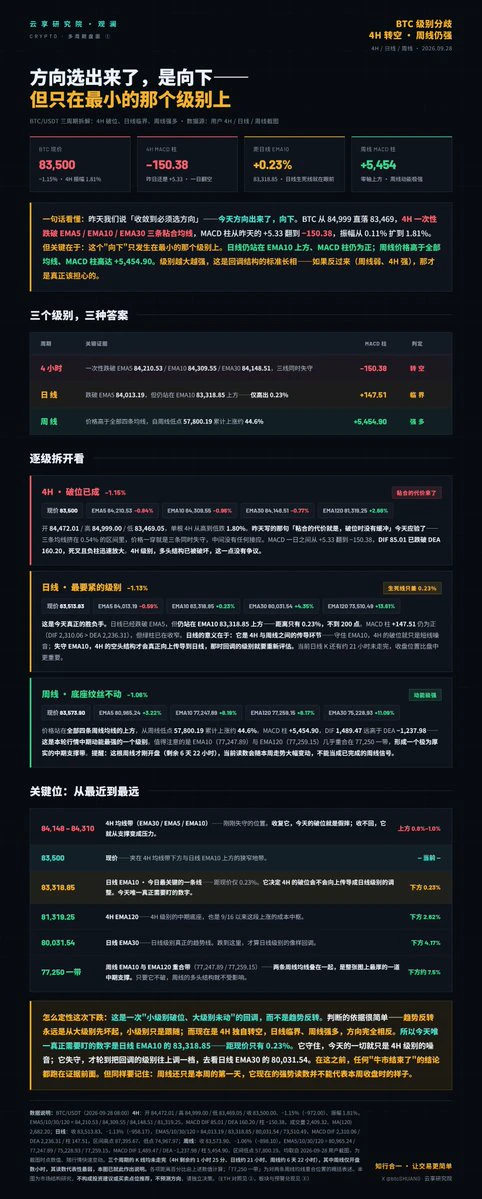
BTC 83,500, the direction is clear—downward, but only on the smallest timeframe.
4H: Broke below the EMA5/10/30 trio, with MACD flipping from +5.33 to −150.38
Daily: Still above EMA10 at 83,318.85, just 0.23% higher
Weekly: Price is above all moving averages, with the MACD histogram at +5,454.90
The larger the timeframe, the stronger it is—this is a pullback structure, not a trend reversal structure.
bitcoin:native
post-image
BTC-0.10%
  • 1
ETH today is showing a combination where the short-term and medium-term trends are completely opposite.
Short term, it is weaker than BTC: down 1.31% (BTC −1.15%), with the 4H MACD fast line DIF having fallen below the zero line to −0.21, while BTC’s is still at 85.01 above the zero line.
Medium term, it is stronger than BTC: the weekly chart has just moved above EMA120 at 2,567.59, up a cumulative +76.3% from the low of 1,505.68, while BTC gained +44.6% over the same period.
That is the two sides of beta.
ethereum:native
post-image
ETH-0.72%
BTC-0.10%
Yesterday, I wrote a distinction: “During an ebb tide, everything falls; during rotation, some rise as others decline. Today is the latter.”
Today, it has become the former.
All 12 assets fell, with none rising. NEAR, which led the entire market yesterday at +6.87%, turned to −2.04%. Even gold fell by about 1%.
The money isn’t flowing between sectors; it’s leaving the market.
post-image
GLDX-0.92%
PAXG-1.01%
#晒出我的持仓收益 Midday market analysis:
Weekend consolidation and adjustment, with the market moving sideways instead of falling; repeated attempts at 85000 faced resistance and pulled back. Long positions had room for profit, but it was short-lived. Early this week, BTC weakened on the four-hour chart with a MACD bearish crossover. Support below is around the 83/81 area. The weekly chart remains bullish overall, but the daily chart has seen a pullback. This is a pullback structure, not a trend-reversal structure; however, if the support zone below breaks, the market structure will shift and continu
post-image
BTC-0.07%
ETH-0.77%
LTC+4.02%
DASH+1.10%
AAVE+8.49%
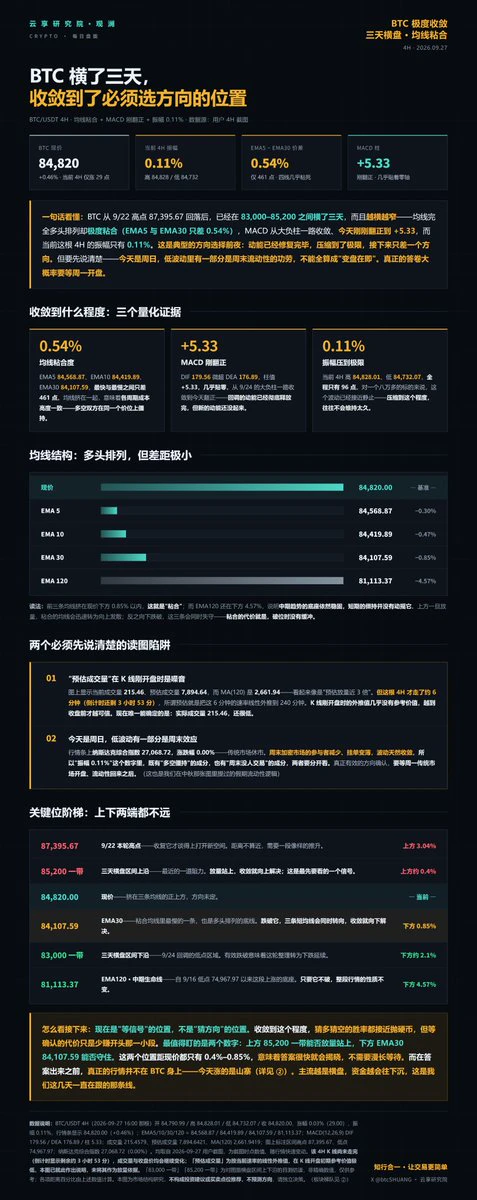
BTC 84,820, has been moving sideways for three days, with convergence reaching an extreme:
EMA5 and EMA30 differ by only 0.54%, and the four moving averages are nearly stuck together
The MACD histogram has just turned positive at +5.33, almost touching the zero line
The current 4H amplitude is only 0.11%
Momentum recovery is complete, compression has reached its limit, and only a direction is needed.
85,200 above and EMA30 at 84,107 below—both are less than 1% away.
bitcoin:native
post-image
BTC-0.10%
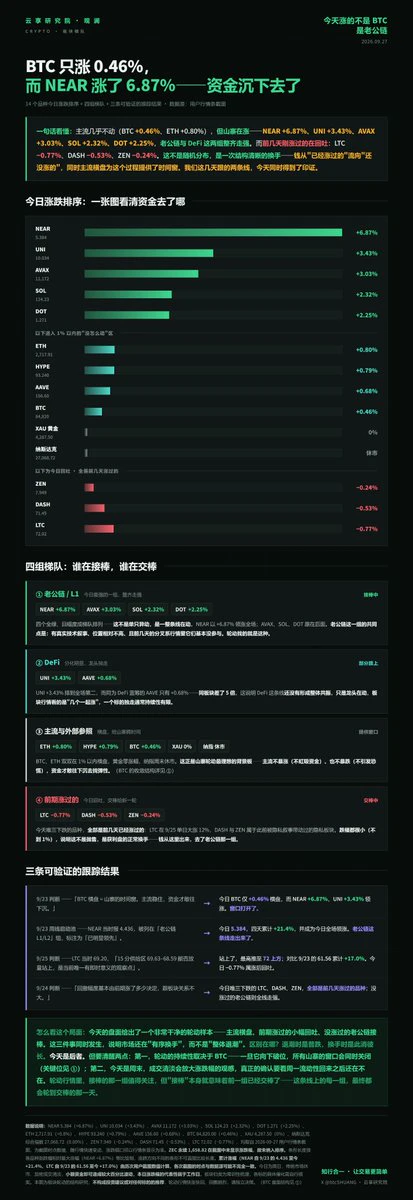
BTC is up only 0.46%, while NEAR is up 6.87%.
The only three decliners today—LTC −0.77%, DASH −0.53%, and ZEN −0.24%—had all already risen in the past few days.
Meanwhile, the older public blockchains that rose today (NEAR, AVAX, SOL, and DOT) had basically not participated in the gains over the past few days.
This isn’t random; it’s a clean rotation: money is flowing from the coins that have already risen into those that haven’t.
near:native
post-image
BTC-0.10%
LTC+4.02%
DASH+1.10%
ZEN0.00%
AVAX+0.71%
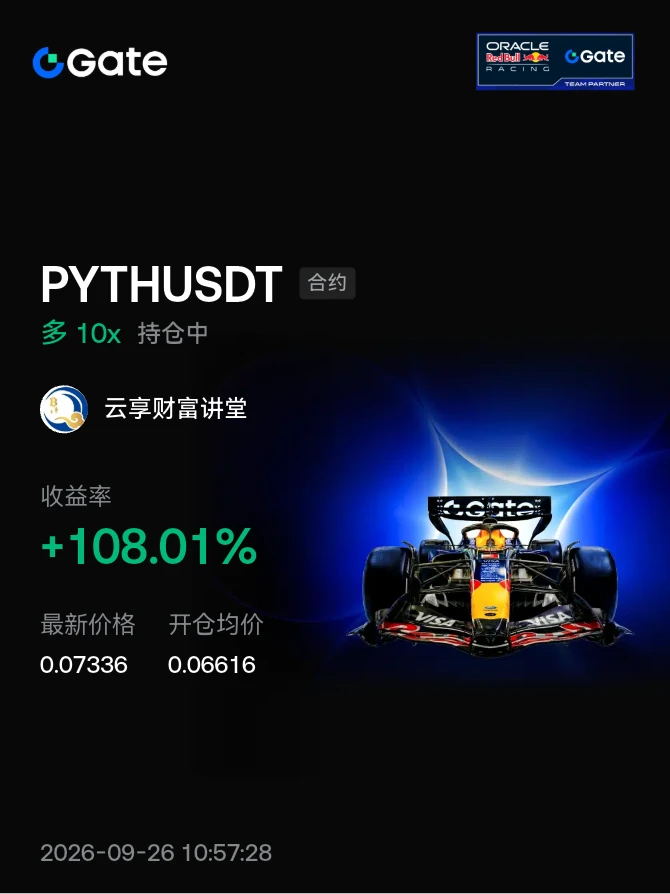
#晒出我的持仓收益 link continues to surge, with rotation into the oracle sector
post-image
  • 3
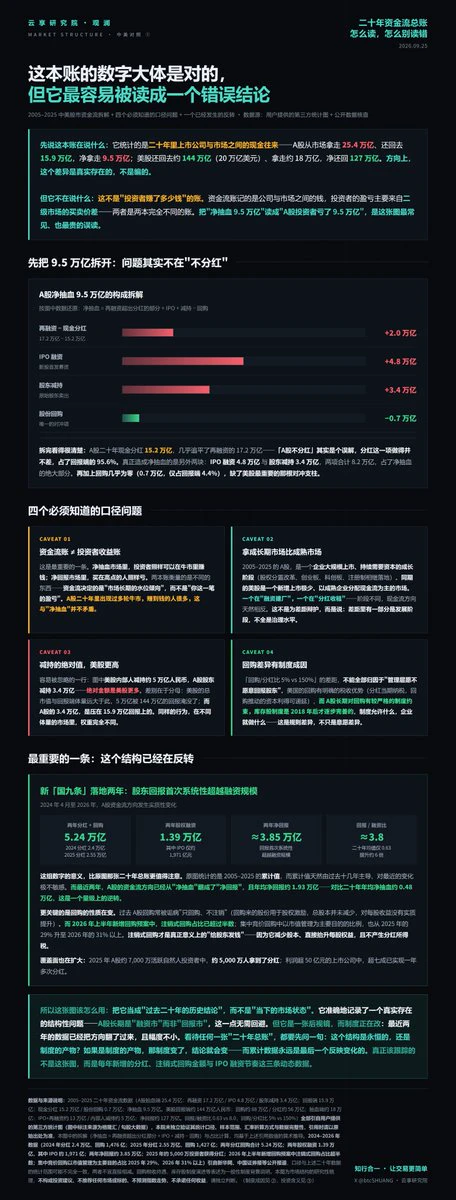
Twenty-year capital flow ledger for Chinese and U.S. stocks: A-shares saw a net drain of 9.5 trillion yuan, while U.S. stocks generated a net return of 127 trillion yuan.
But when broken down, the problem with A-shares is not “not paying dividends”—dividends over the past 20 years totaled 15.2 trillion yuan, nearly matching the 17.2 trillion yuan raised through refinancing.
The real drain was 4.8 trillion yuan in IPOs plus 3.4 trillion yuan in share disposals, while buybacks were virtually nonexistent at just 0.7 trillion yuan.
What’s missing is the most important pillar of the U.S. stock mark
post-image
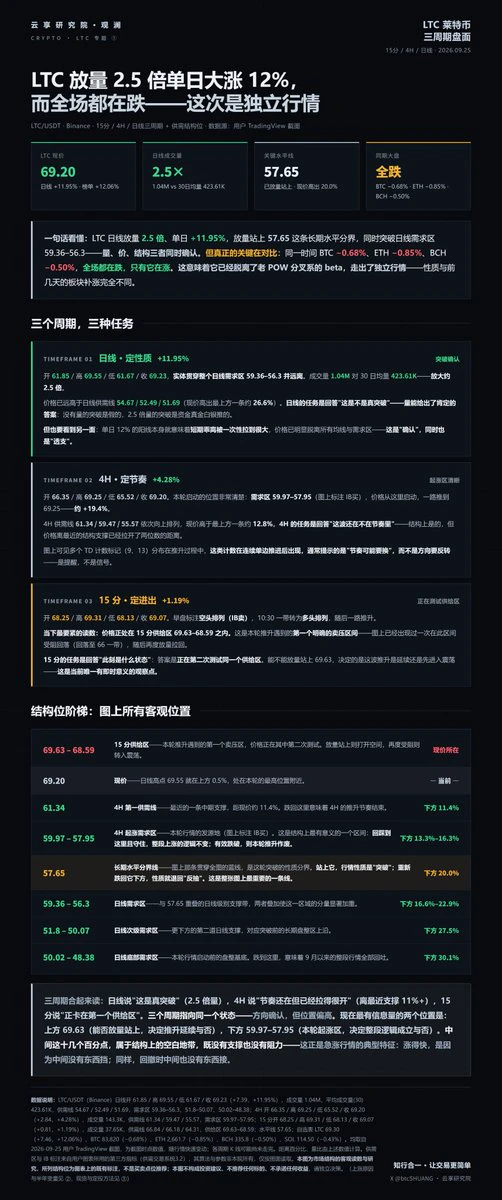
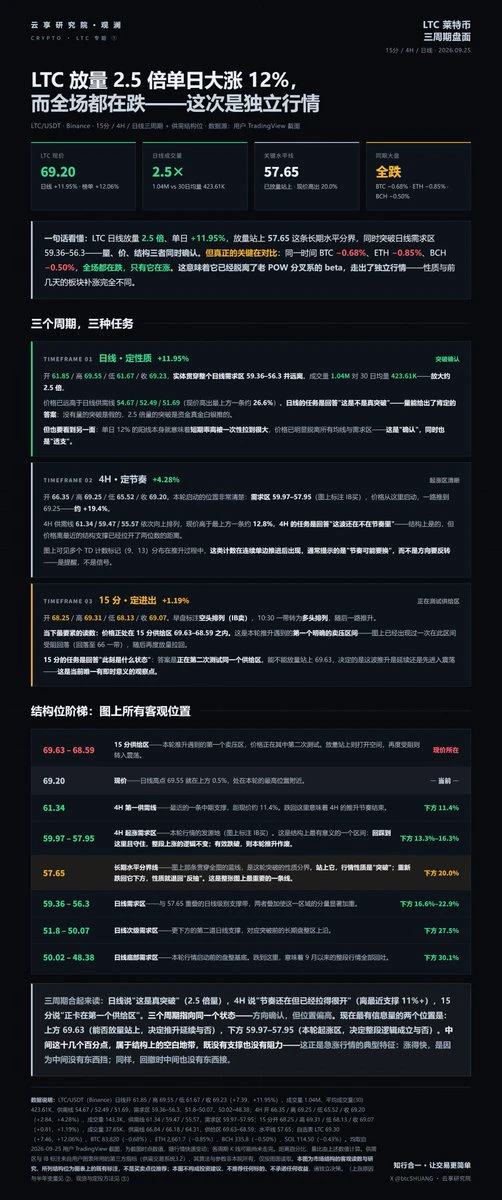
LTC +11.95% in a single day, with 1.04M in trading volume versus a 30-day average of 423.61K—that’s 2.5x higher, breaking above the long-term dividing line at 57.65 on heavy volume.
Meanwhile, BTC −0.68%, ETH −0.85%, and BCH −0.50%.
The entire market is falling, and it’s the only one rising. This is no longer a beta catch-up move from the fork-related group—it’s an independent rally.
litecoin:native
post-image
LTC+4.02%
BTC-0.10%
ETH-0.72%
BCH+0.51%
The question “Where should I enter to buy LTC spot?” is the wrong one to ask.
With the same invalidation level, chasing at 69.20 means 16.3% risk, while waiting for a pullback to 61.34 means 5.5% risk—a difference of nearly 3x.
With the same amount of money, you can take approximately 3x the position at the pullback level while taking on the same absolute loss.
What determines the outcome has never been the entry price. It is the distance between your entry price and the price at which you admit you were wrong.
The four things you should lock in for dollar-cost averaging
① The time horizon mus
post-image
LTC+4.02%
BTC-0.10%
LTC +11.95% in a single day, with volume at 1.04M versus the 30-day average of 423.61K—2.5 times higher, breaking above the long-term boundary at 57.65 on strong volume.
Meanwhile, BTC −0.68%, ETH −0.85%, and BCH −0.50%.
Everything else is falling, and only LTC is rising. This is no longer a beta catch-up move from the fork family; it is an independent rally.
litecoin:native
post-image
LTC+4.02%
BTC-0.10%
ETH-0.72%
BCH+0.51%
The crypto market has been doing great lately, and everyone has been winning big this round!
Everyone has been receiving the community’s carefully customized Mahjong 🀄 mooncake gift boxes [偷笑]. Wishing all our friends in advance:
May the moon be full, your wealth be abundant, and your accounts be flush with gains. Happy Mid-Autumn Festival, and keep winning big!
There’s a clear divergence in today’s U.S. stock watchlist:
U.S. compute is falling—GOOG −3.58%, NVDA −1.47%, MU −2.22%
Asian memory is rising—SK hynix +1.20%, KOSPI +0.90%
This isn’t a contradiction. It’s the AI chain shifting gears: capital is spreading from compute chips toward memory/HBM.
How broadly that rotation spreads will determine how long this rally can last.
$NVDA
post-image
GOOG+1.79%
NVDA+1.52%
MU-1.76%
SK Hynix+0.43%
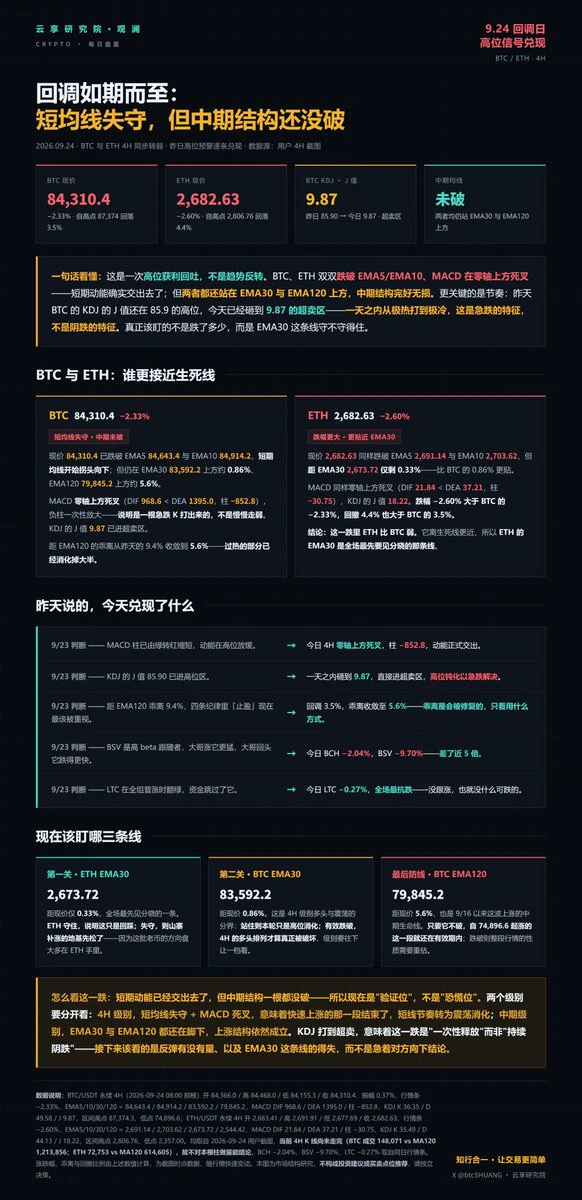
September 24 Market Analysis:
BTC 84,310 (−2.33%), down 3.5% from its high of 87,374.
ETH 2,682 (−2.60%), down 4.4% from its high of 2,806.
Both broke below EMA5/EMA10 simultaneously, while the MACD formed a death cross above the zero line. Short-term momentum has indeed been lost.
post-image
BTC-0.10%
ETH-0.72%