



Square
Following
Hot
News
Notifications
Profile
Share your thoughts
placeholder
Article
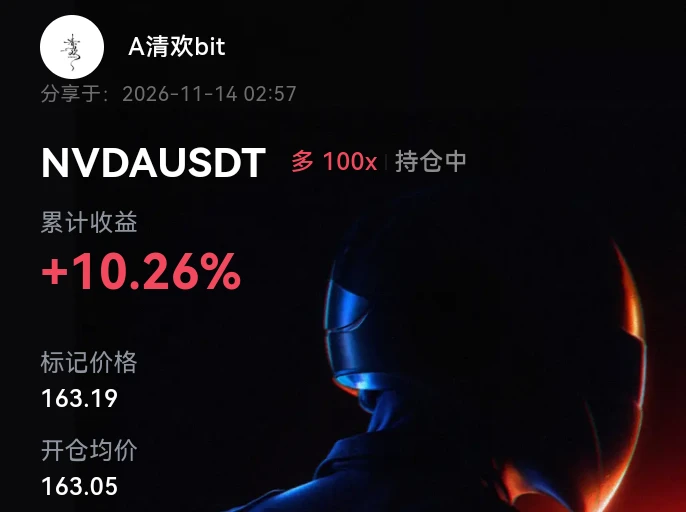
Scalped a quick trade, banked 13 points, then off to bed; back at it tomorrow

Good luck, everyone
ETH-1.26%
#Gate股票畅聊季
AI Tech Stocks: A Comparison of AMD and NVDA

Recent data shows two different pictures in AI tech stocks. AMD shows a strong recovery, while NVDA follows a more cautious path.
AMD: Strong Recovery
AMD closed at 583.11 dollars. In after-hours trading, it fell by 2.30 dollars, -0.39%, a limited pullback. In intraday trading, it rose to 585.41 dollars, up 32.44 dollars, +5.86%, a strong gain. The prior close was 552.97 dollars, the open was 569.28 dollars. The 24-hour high was 594.00 dollars, the 24-hour low was 550.64 dollars.

The low on the chart is 400.00 dollars, the high is 648
post-image
AMD-9.06%
NVDA-2.14%
Trenches
FOOD
F
bade
b
FOOD
FTu5...pump
Market Cap
$.
Change
.
24h Vol
$.
Holders
.
mihao
m
bade
b
mihao
4Cxj...pump
Market Cap
$.
Change
.
24h Vol
$.
Holders
.
AGT
A
bade
b
AGT
0x5d...e274
Market Cap
$.
Change
.
24h Vol
$.
Holders
.
IDOL
I
bade
b
IDOL
0x3b...ab07
Market Cap
$.
Change
.
24h Vol
$.
Holders
.
Sakura
S
bade
b
Sakura
9sFG...pump
Market Cap
$.
Change
.
24h Vol
$.
Holders
.
Can't sleep? Let's get up and trade NVDA
post-image
ETH-1.26%
BTC-0.67%
$BTC The 200-week moving average is in danger—is the bull market floor being tested?

Bitcoin has fallen back to its 200-week moving average for the first time in nearly three months, with this key level roughly corresponding to $68,000. The moving average is seen as the price center over the past four years, and multiple bear-market bottoms have historically formed around it. Bulls and bears are now locked in repeated battles around this line, and the market’s concern is no longer just an ordinary pullback, but whether the long-term trend is quietly shifting.
This wave of selling pressure is
post-image
BTC-0.67%
btc might drop to 58k🤯
post-image
GateLive
🌈 Gate Live Streaming Inspiration - Nov.13
Today's Topic Recommendations:
🔹BTC Falls Below $71,000 to Its Lowest Level Since September! With the $70,000 Mark Under Threat, How Much Further Could Bitcoin Fall?
🔹A Break Below $70,000 Could Trigger $622 Million in Long Liquidations! Can the Bulls Defend Their Last Line of Support?
🔹Is BTC Losing Its Status as a Safe-Haven Asset? Grayscale Finds That Crypto Sectors Are Increasingly Moving Independently of Bitcoin. Is the Altcoin Market Heading for a Major Shift?
🔹South Korean Chip Stocks Rebound Against the Trend! KOSPI Gains Over 2%, While SK Hynix and Samsung Rise More Than 3%. Is AI Capital Starting to Flow Back In?
🔹Nvidia's Valuation Falls to a 14-Year Low as Shares Retreat Over 30% From Their Record High! Is This a Golden Buying Opportunity or a Value Trap?
🔹Buy the Dip or Sell the Rally on Nvidia? Tom Lee Calls for Buying the Dip, While Michael Burry Warns Investors to Get Out. Who Has the Better Call?
🔹The Fed Signals a Long Fight Against Inflation! How Long Will It Take to Bring Inflation Back to 2%, and When Can BTC and U.S. Stocks Catch a Breather?
🔹Fed Makes Major Changes to Its 2027 Meeting Schedule! October's Meeting Will Shift to Monetary Policy Discussions. How Could This Change the Fed's Policy Timeline?
Pick any topic and go live for a chance to be featured on the homepage!
🔥 More livestream topic ideas and tips: https://www.gate.com/help/community-center/live_chat/49345

repost-content-media
BTC-0.67%
[new streamer] MARKET UPDATE
live-cover
LIVE549
Everyone is saying this pullback is a chance to buy in, but I haven’t seen enough reason to believe that. The list is full of stocks that have been cut in half from their highs, which looks tempting. But a 50% drop doesn’t mean a stock is cheap—it could also mean the fundamentals have changed. Take some new energy and consumer stocks: they’ve pulled back 50% or even 60% from their highs, and their valuations have fallen from 60x to 30x. On the surface, they look “half off,” but if industry growth has slowed from 30% to 10% and the inventory cycle hasn’t bottomed, 30x may not be cheap. For exam
post-image
  • 2
#SP500PostsBiggestGainIn7Months
The strong rebound seen in United States shares has changed in a moment the mood of investors who had long stayed under pressure, and this move suggests that the market has begun to gain strength again with a daily gain on a scale not seen in seven months.

The broad share gauge rose 2.3 percent in trade, and by the close it had risen 173.08 points, or 2.35 percent, to 7549.94, a move recorded as the strongest daily gain seen since April 8.

Behind this rebound stood buying in response to the sharp selling wave seen last week in artificial intelligence shares
post-image
NVDA-2.14%
AAPL+0.83%
AMZN-0.71%
MSFT+0.30%
GOOGL-1.28%
SOL Technical Outlook: Solana Breaks Below $80 as Selling Pressure Intensifies

Solana is showing significant weakness on the daily chart, with price falling toward $80.25–$80.31 after breaking below several important support levels. SOL is trading below all four major exponential moving averages (EMAs), while RSI has dropped to 20.98, indicating deeply oversold conditions.

The key question now is whether buyers can defend the $79–$78 support region or whether SOL will extend its correction toward the $74–$73 area.

1. EMA Structure: Bearish Momentum Dominates

Current EMA levels:

- EMA 20:
SOL-0.74%
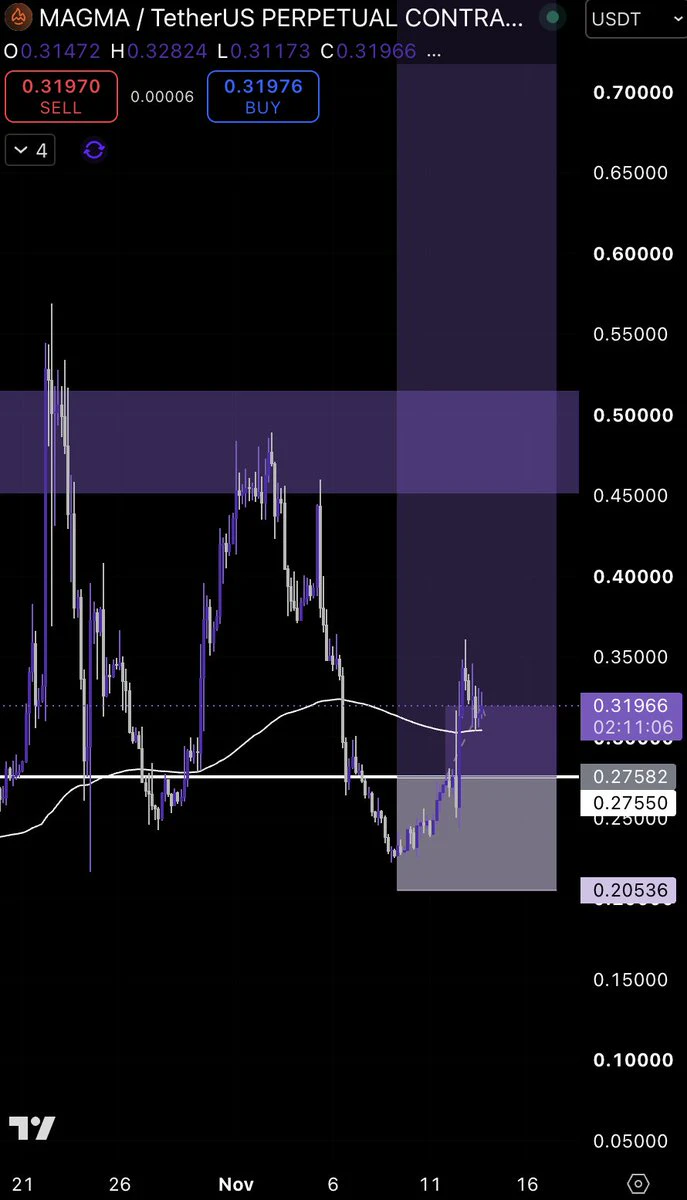
🔥 magma-finance:native — VIP RE-ENTRY PLAYING OUT
Re-entered the setup in VIP and already in profit. 💰
Price reclaimed the $0.275 area, pushed toward $0.35, and is now holding above the breakout zone.
Let's see if buyers can keep the momentum going. Partial profits are always an option — protect your position. 🎯
post-image
MAGMA-0.57%
$ZORA — Long entry: 0.004917 Take-profit 1: 0.005030 Take-profit 2: 0.005200 Stop-loss: 0.004650 The latest trading session shows positive signs of recovery. Sustained accumulation near the current price could help trigger another attempt to rise.
post-image
ZORA-9.75%
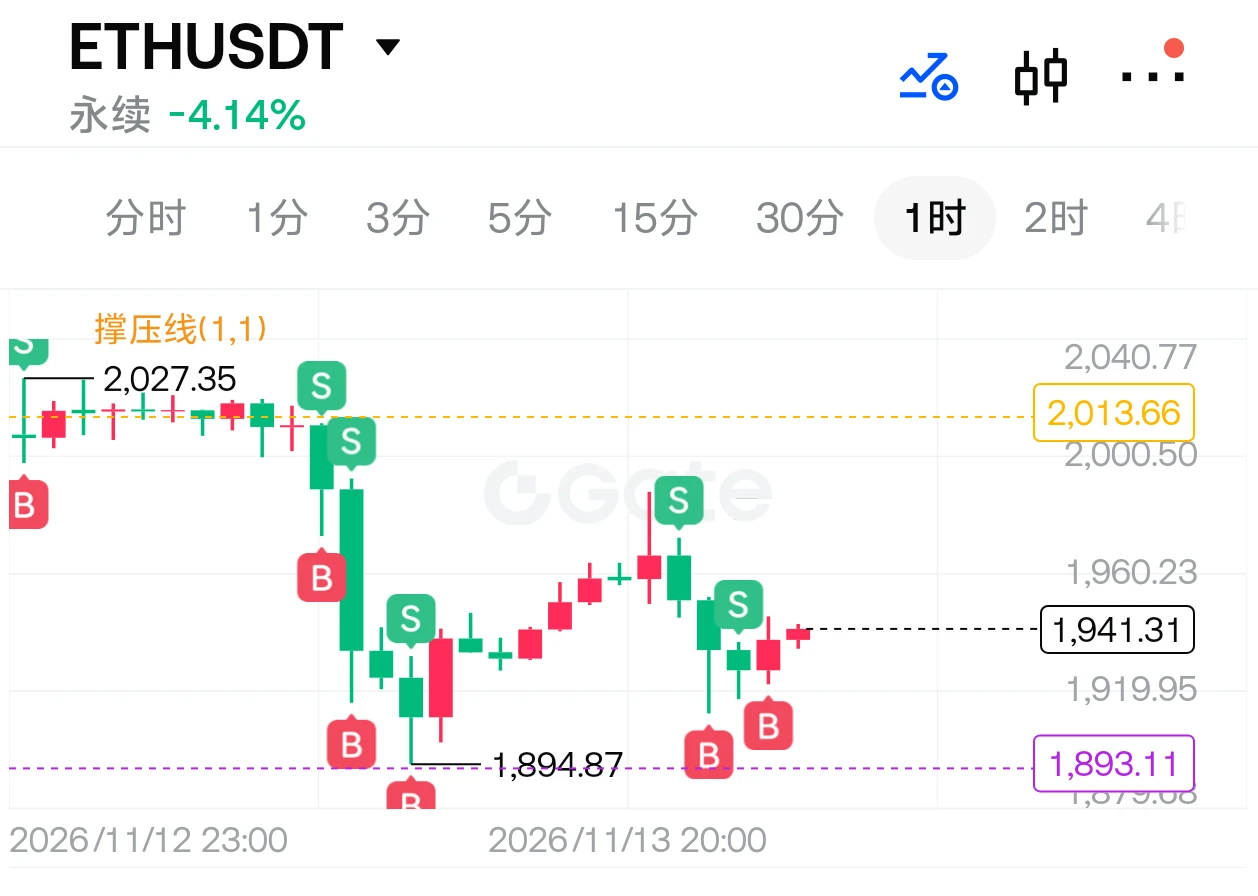
Although this chart has very little trading activity, looking at it, I don't think you can still view it as a pattern where bears have complete control of the market. Earlier, when you saw 1894, you could interpret it that way, but after 1894, you'll notice the lows have risen by 20 points. At the very least, we can see the downward momentum fading, and there are a lot of short stop-losses clustered above. Once it breaks above 2000 on heavy volume, the resulting long rally could be devastating. When everyone is fearful and short sellers have been rewarded multiple times, you absolutely must st
post-image
$ETH Market Recap: After a New Seven-Day Low Was Set, the Rebound Was Too Weak to Recover Lost Ground

Ethereum fell to a new seven-day low on the 13th. Although it rebounded in the evening, it failed to decisively reclaim the 12th’s low, let alone rise back above the 12th’s closing price of 2009. The breakdown formed during the day was never reversed. Around 11:00, trading volume reached about 70.72 million, the heaviest wave of the day, as the price fell through the 12th’s low of 1983. It hit a low of 1895 at 13:00. The strongest rebound afterward only reached 1989; after barely clearing the
post-image
ETH-1.26%
#Gate直通IPO第三期Anthropic
A $70-78 Band, 825 Million Shares, and a High Bar for Error

A $70-78 price band for 825 million shares does not leave much room for error. When a private AI lab moves to list at this scale, the market does not ask only whether the technology works. It asks whether the price already reflects years of future growth.

Anthropic is the firm behind the Claude family of large language models. It serves both individual users and enterprise clients. Its enterprise use covers software development, customer support, document review, code generation, data summary, and workflow au
From 69 all the way down to 52, I’m bearish on the $SOXL contract: this semiconductor bloodbath isn’t over yet. The trigger was still NVIDIA: Jensen Huang resigned on November 12, with the CFO taking over on an interim basis. NVIDIA shed nearly $490 billion in market cap in a week, AMD fell 10% in a day, Broadcom dropped 7%, and the Philadelphia Semiconductor Index followed with a 6% decline. Even PPI coming in below expectations couldn’t save the market. The price action was even more alarming: SOXL was still range-bound at 63–66 during the day, but plunged straight through those levels when
SOXL-1.16%
$IDOL I keep calling you “dear, dear,” and yet you’re not dear at all😂😂😂IDOL
post-image
IDOL-6.71%
[New Streamer] btc update
live-cover
LIVE1,420
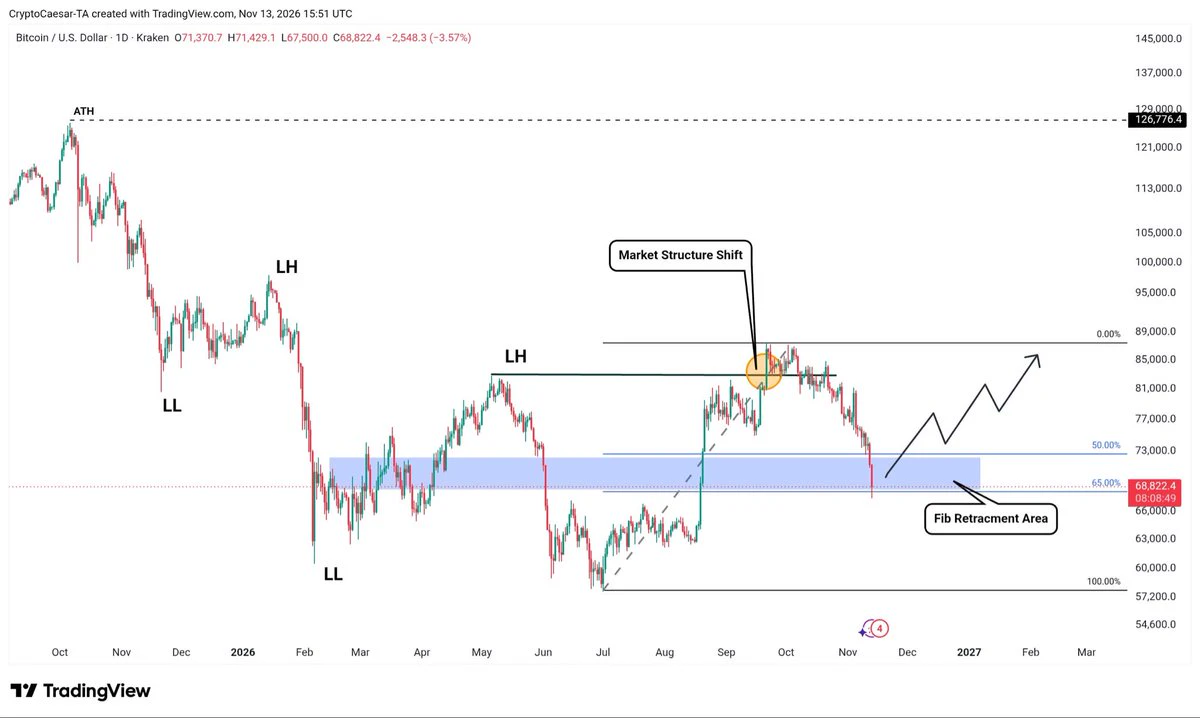
$BTC reached the fib retracement zone. In my opinion we will be back above 81K sooner than you’ll ever think.
post-image
BTC-0.67%
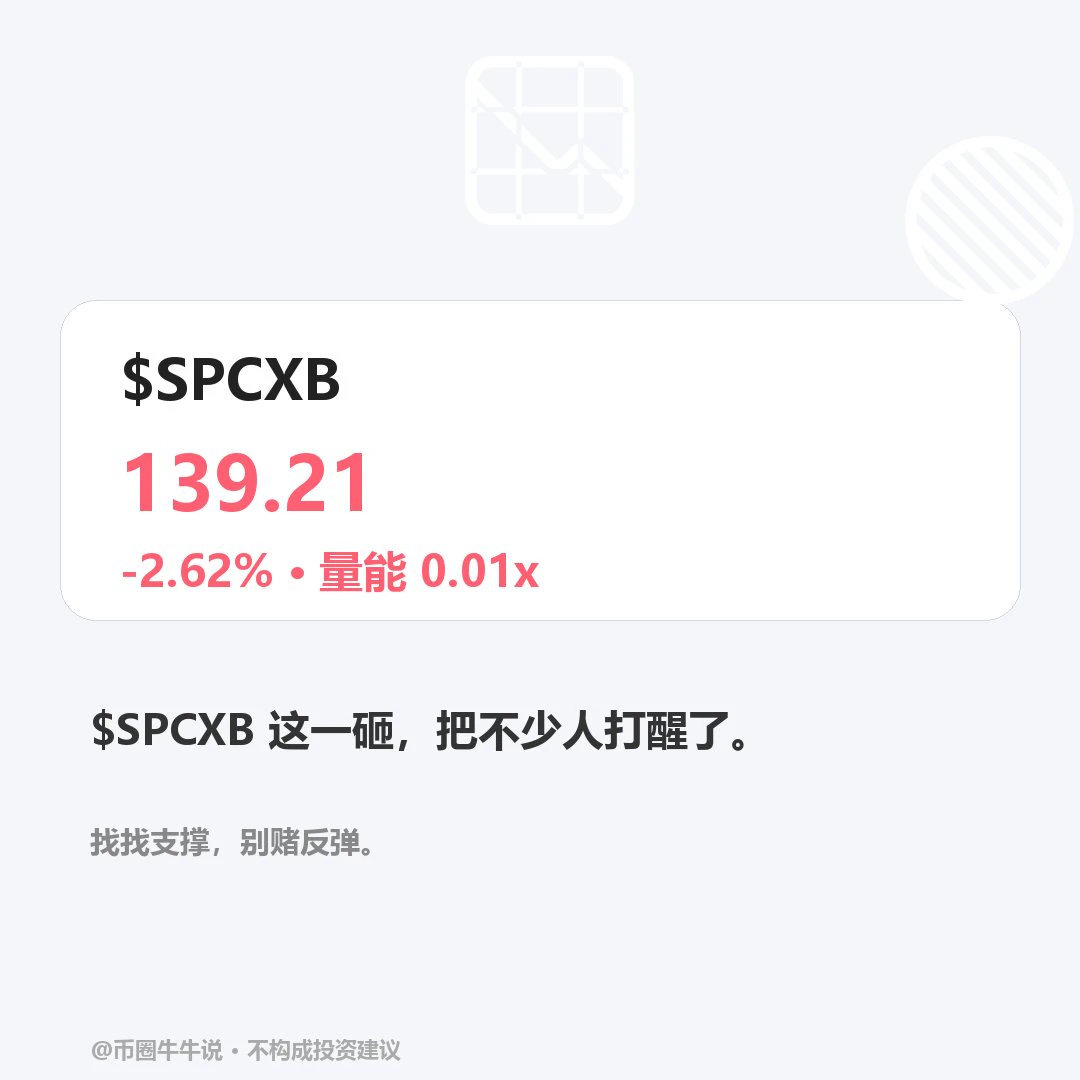
$SPCXB is currently at 139.21, down 2.62% over 24H (range: 136.73–143.05). The 1H is weak with RSI at 42, and the 4H is weak with RSI at 35. Both EMA20s are below the current price. Watch: The direction may become clearer if price holds above the 142.77 resistance or breaks below the 136.73 support. In follow-up reviews, focus on whether resistance holds and whether price can recover after losing support. Volume is only 0.01x, so a single break beyond either level needs confirmation of participation. Markets are volatile; for observation only.
post-image
Load More

Join 40 M users in our growing community

⚡️ Join 40 M users in the crypto craze discussion

💬 Engage with your favorite top creators

👍 See what interests you

Trending Topics

JensenHuangResigns

531.3K Views8.6K Discussing

Jensen Huang has resigned as NVIDIA CEO and stepped down from the board. CFO Colette Kress will serve as interim CEO while NVIDIA considers internal and external successors. $NVDA fell more than 10% in premarket trading following the announcement. With one of AI’s most influential leaders stepping aside, markets are now reassessing NVIDIA’s leadership stability, AI strategy, and long-term valuation.

GateIPOAccessAnthropic

289.7K Views2.7K Discussing

Dr.HanOxfordUnionSpeech

145.6K Views509 Discussing

View More