Square
Following
Hot
News
Notifications
Profile
Share your thoughts
placeholder
Article
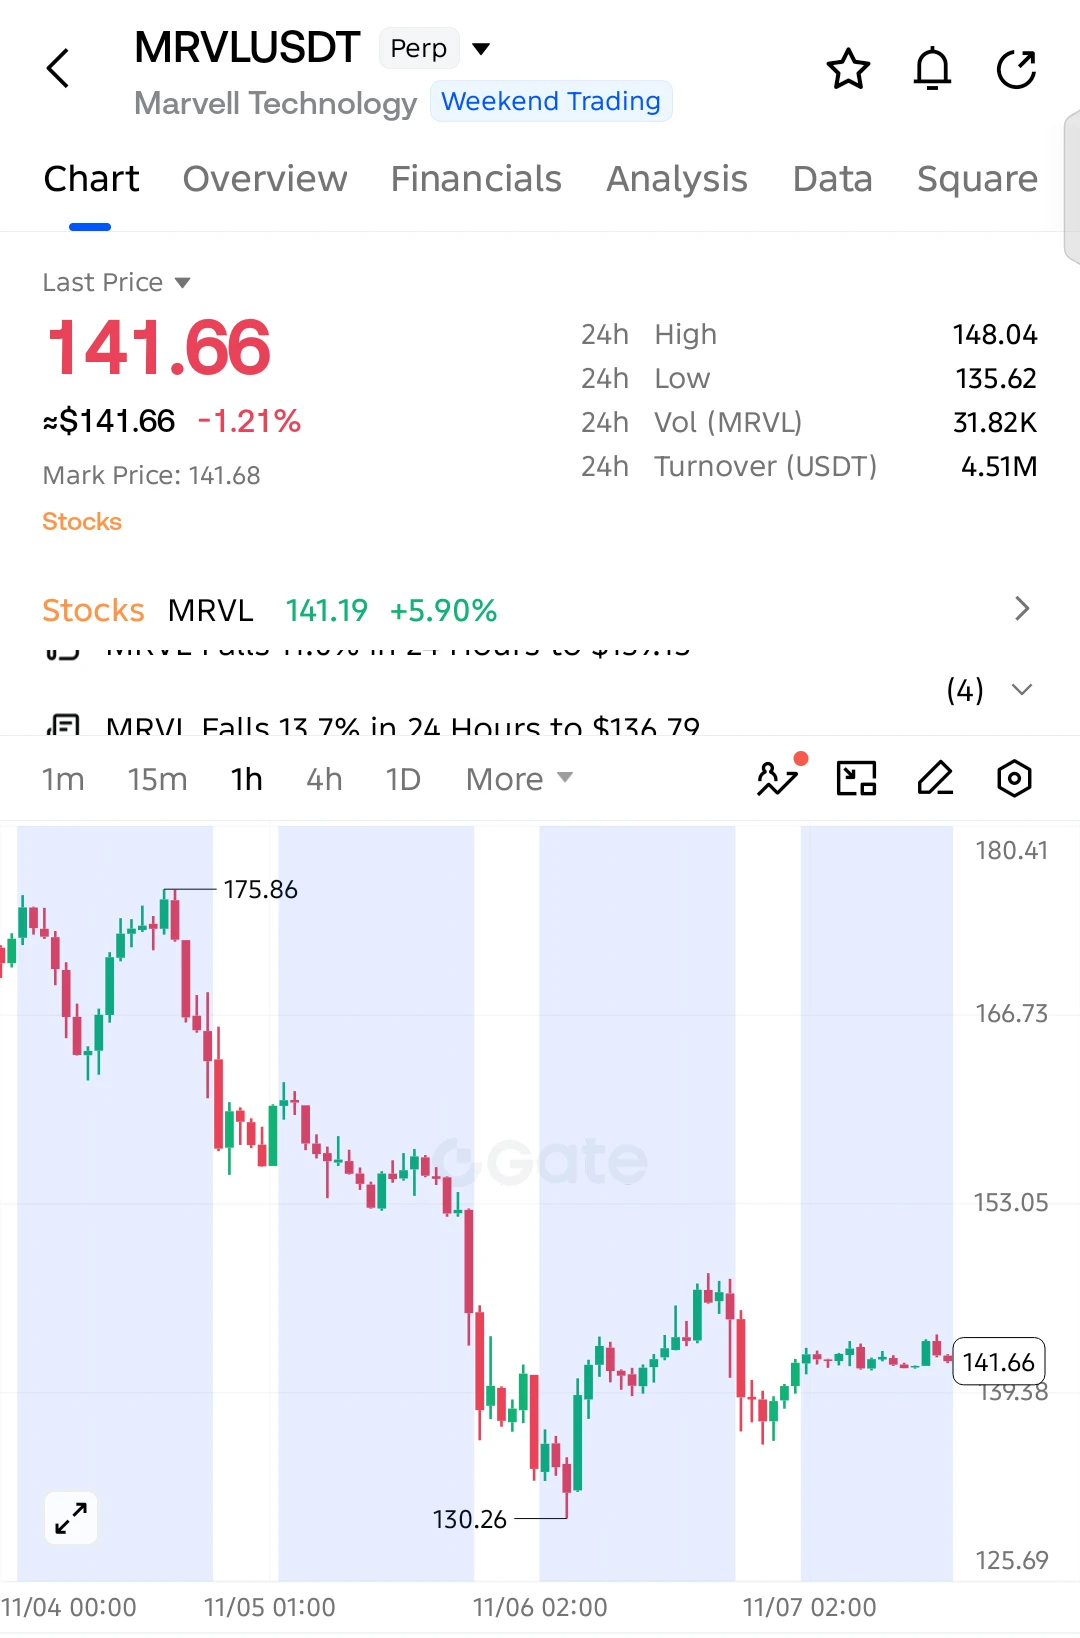
$MRVL SHORT SETUP — BEARS STILL IN CONTROL!

$MRVL remains under pressure after a sharp decline from 175.86. The recent recovery is losing strength, with price consolidating below resistance.

Entry: 141.66
SL: 145.50

TP1: 138.50
TP2: 135.62
TP3: 132.00
Final Target: 130.26

Sellers continue to defend the 143–148 resistance area, while buyers are struggling to build momentum. A break below 139 could trigger another decline toward 135.62 and potentially retest 130.26.

Invalidation: A sustained recovery above 145.50 weakens the bearish setup.
post-image
MRVL-0.84%
[Trending Topic] After the Nonfarm Payrolls Report, the probability of a Fed rate hike in December
live-cover
LIVE1,546
Trenches
ZIG
Z
bade
b
ZIG
0x8c...1145
Market Cap
$.
Change
.
24h Vol
$.
Holders
.
BTC
B
bade
b
BTC
C5xp...pump
Market Cap
$.
Change
.
24h Vol
$.
Holders
.
Diamond
D
bade
b
Diamond
5VCE...pump
Market Cap
$.
Change
.
24h Vol
$.
Holders
.
DOGE
D
bade
b
DOGE
DoGE...fm7R
Market Cap
$.
Change
.
24h Vol
$.
Holders
.
STONK
S
bade
b
STONK
6GmA...UNgx
Market Cap
$.
Change
.
24h Vol
$.
Holders
.
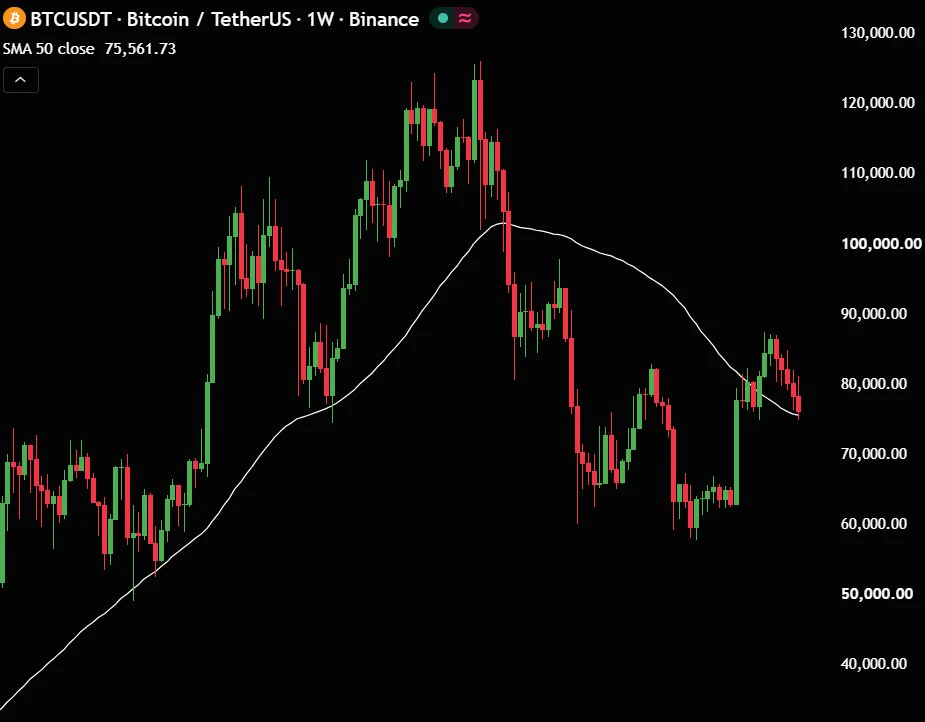
$BTC is testing the crucial 50-week MA.
Hold it, and bulls could regain control.
Lose it, and more downside may follow.
Pay attention!
post-image
BTC-0.67%
#ShareWeekly #BTC #WCTCS9

Bitcoin approaching the $80,000 level creates an interesting situation for the crypto market. This is not just another psychological price milestone. It could become an important turning point for market sentiment, especially if a large number of leveraged short positions are forced to close.

The reported $1.45 billion in potential short liquidations deserves attention, but I believe traders should understand how a short squeeze actually develops before assuming that BTC will automatically experience a massive rally.

Why Is $80,000 So Important?

The $80,000 level
BTC-0.65%
  • 2
Came across a regulatory update first thing this morning
The U.S. FinCEN and Federal Reserve
withdrew their 2020 proposal to revise the cross-border Travel Rule
It had sought to lower the threshold from $3,000 to $250
Now it stays at $3,000
Small cross-border transactions face one less layer of mandatory information collection
There were nearly 3,000 public comments
Officials said the proposal was too old and the industry had changed
Any future changes will require soliciting public comments again
Last month, the proposals on non-custodial wallets and mixers were also withdrawn
Now another old
post-image
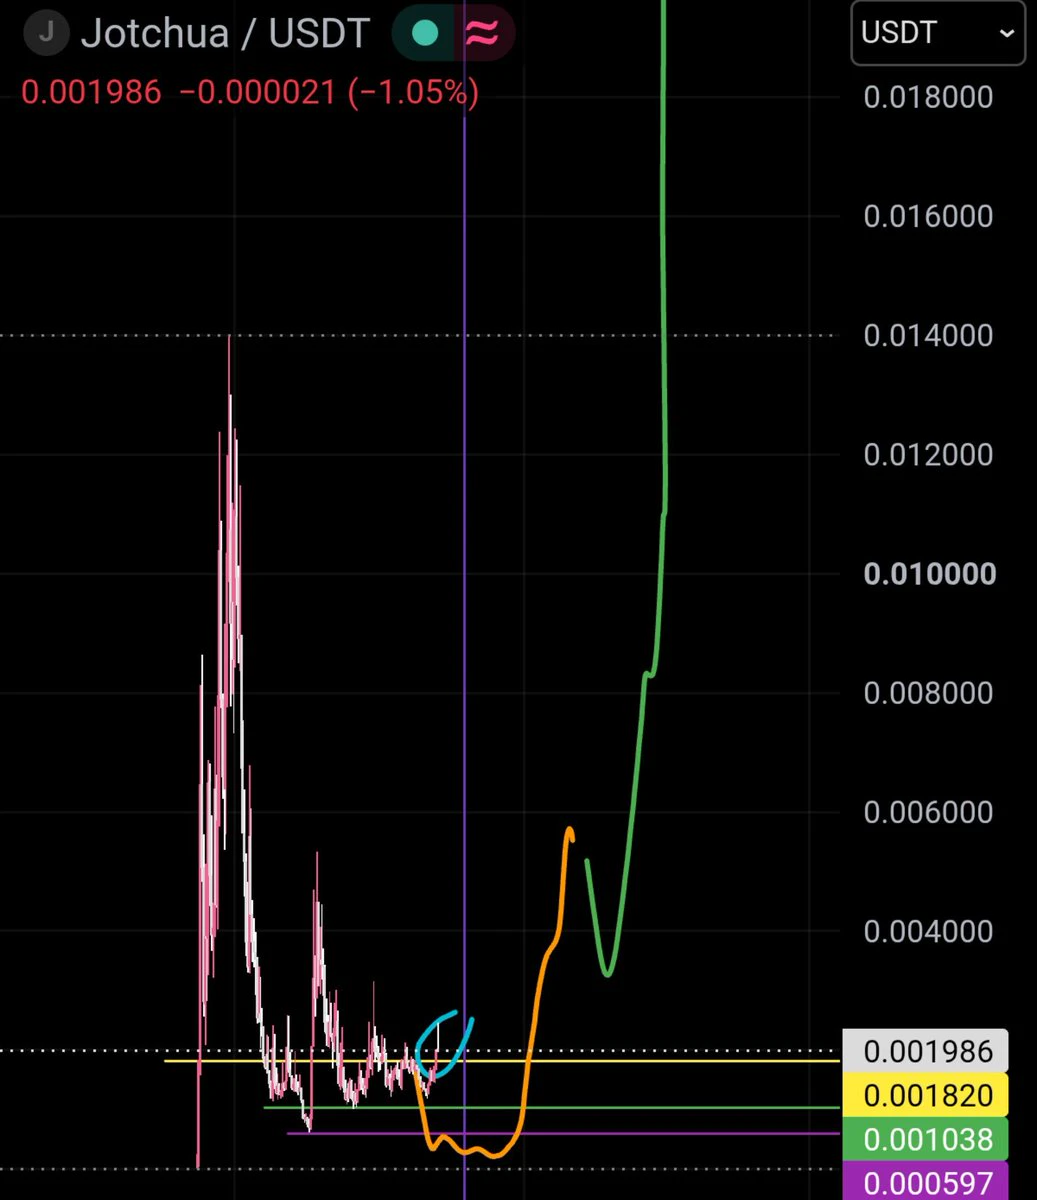
Master criminals
Here dey go again
$JOTCHUA
post-image
GT markets predictions
live-cover
LIVE2,556
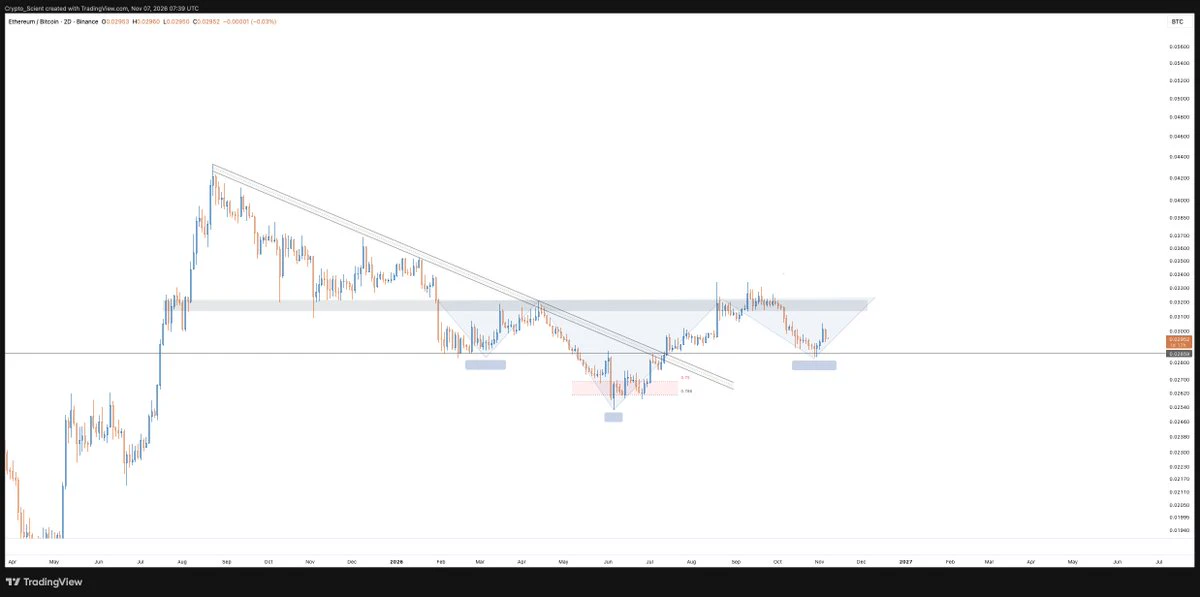
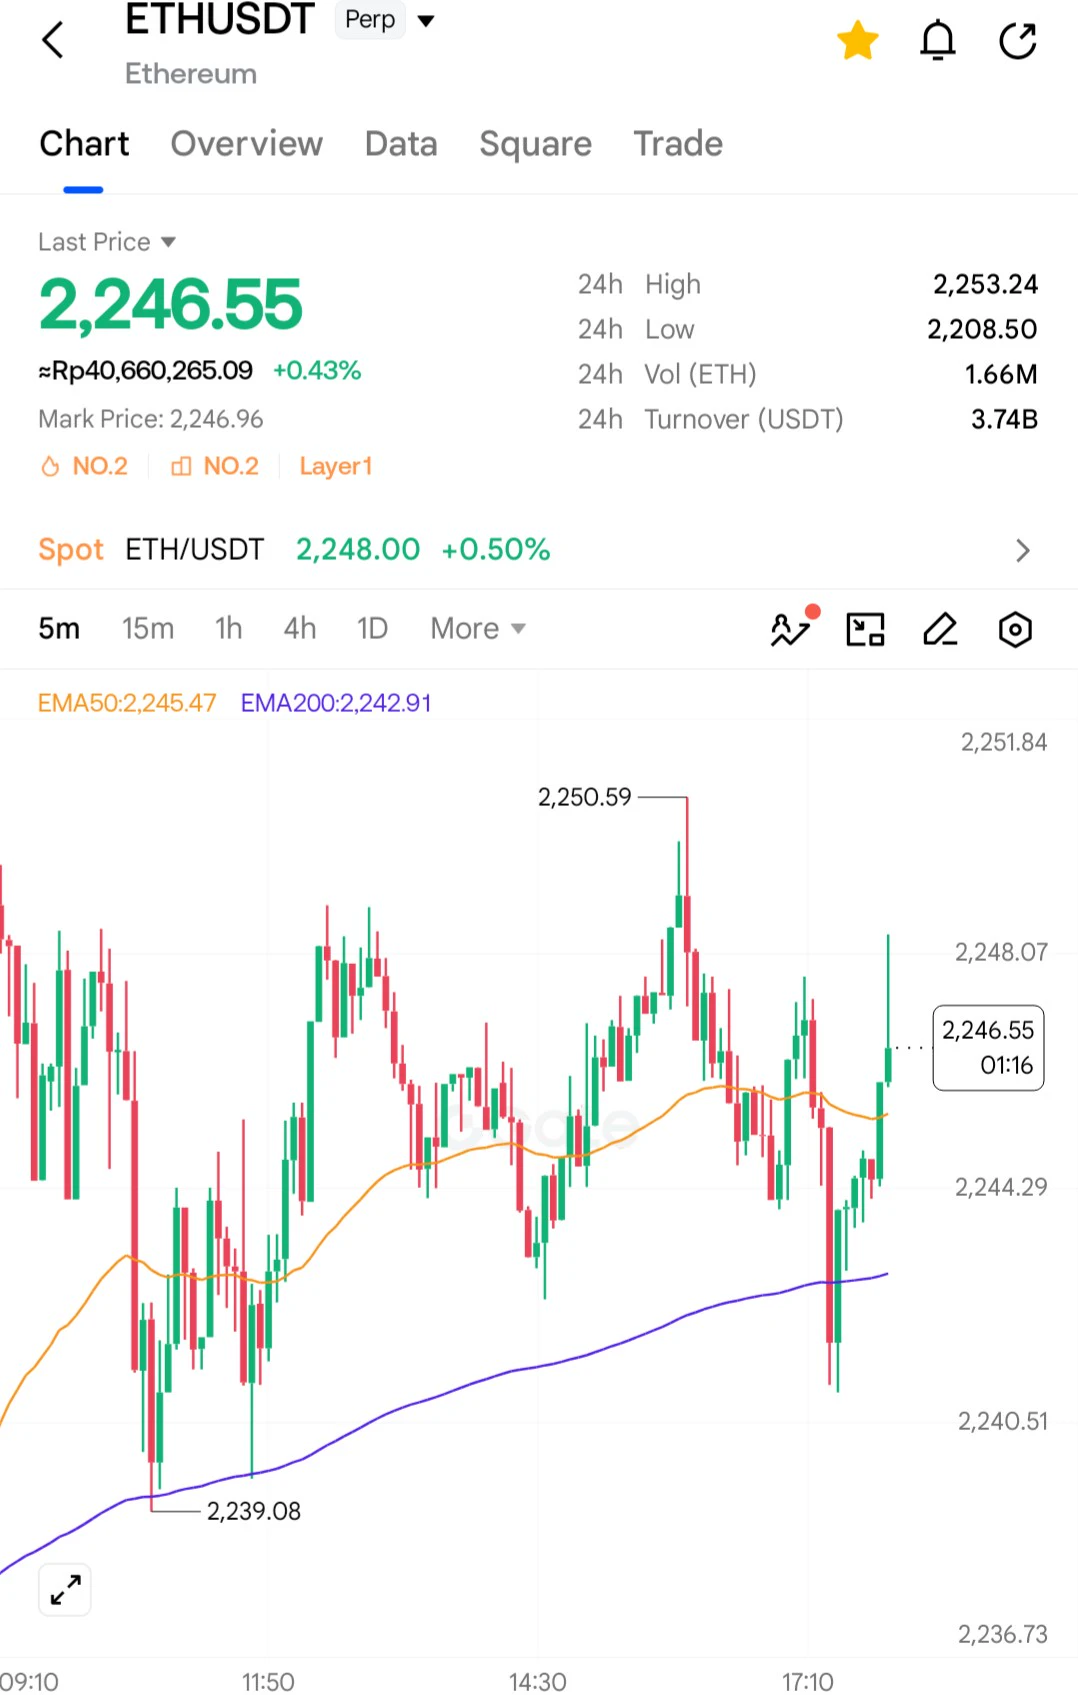
$ETH BTC has potentially bottomed on this local correction and is forming an inverse head and shoulders.
Left shoulder in Mar, head in Jun at 0.0254, right shoulder printed last week right on the 0.0285 support.
As long as 0.0285 holds, ETH should see a steady rise against BTC. Neckline is 0.032, a close above it confirms the pattern.
#ETH
post-image
ETH-1.26%
BTC-0.67%
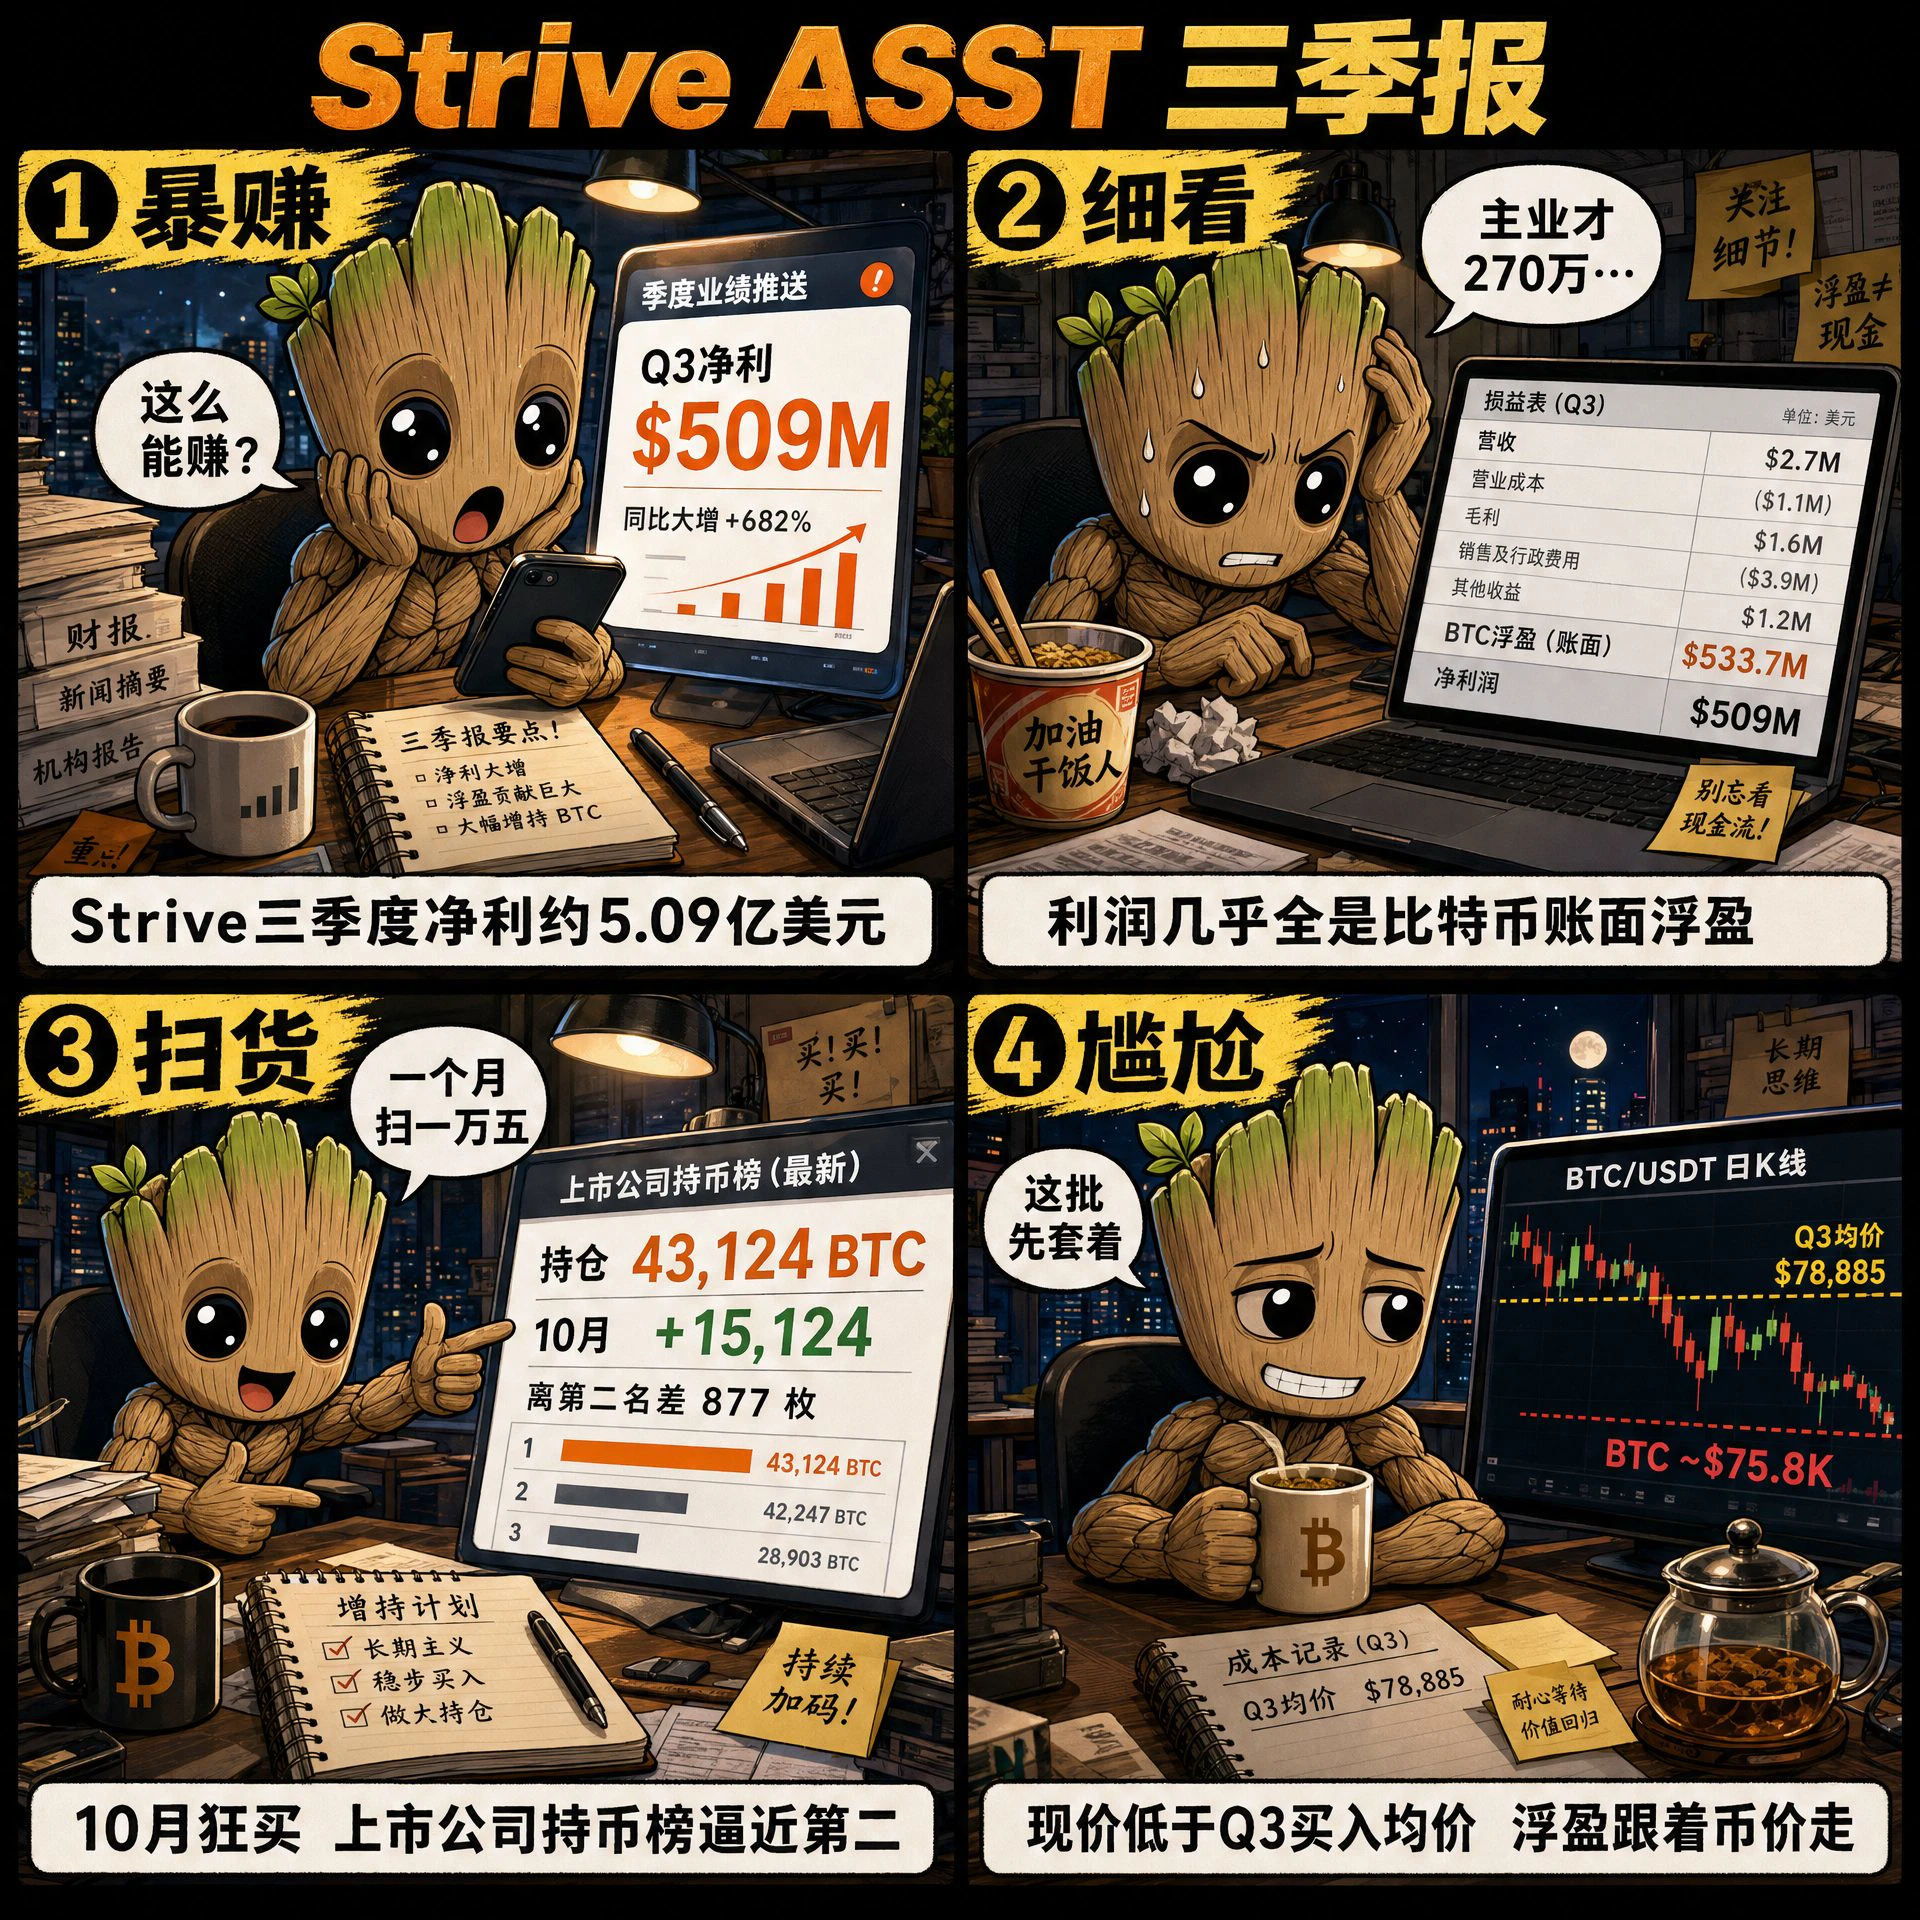
I saw Strive ASST's Q3 report at noon
Q3 net income was about $509 million
Revenue was actually only $2.7 million
Profit was basically about $534 million in unrealized BTC gains
It bought another 15,124 BTC in October
Total holdings: 43,124 BTC
Only 877 BTC short of becoming the second-largest publicly listed company holder
Q3 average purchase price was about $78,885
BTC is now around $75.8k
This batch is underwater for now
A treasury company's earnings report is just a reflection of the coin price
I'll see whether it buys more next month$US30 $US500 @
post-image
US30+0.08%
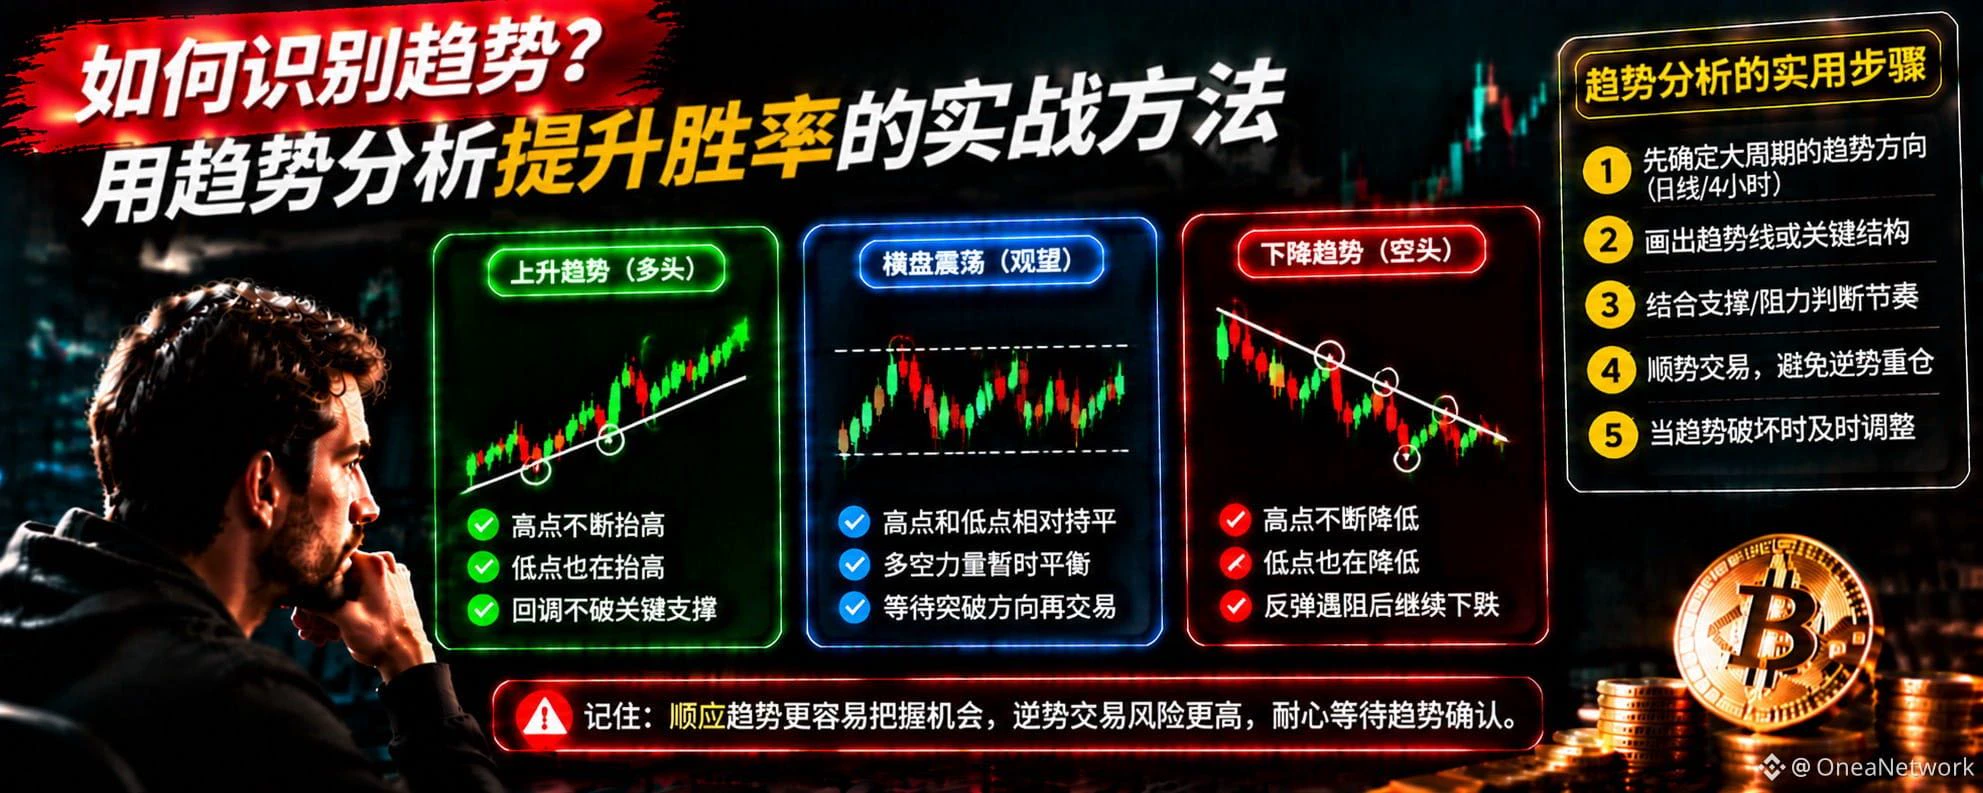
How to Identify Market Trends? Improve Your BTC Trading Win Rate with Trend Analysis
In cryptocurrency trading, many people search for the best entry and exit points every day, but overlook a more fundamental question: What trend is the market in right now?
If you haven't clearly identified the market's direction, even using more technical indicators may still lead to repeated bad decisions.
First, learn to identify three basic market conditions.
First, an uptrend. Prices keep forming higher highs and higher lows, indicating that buyers have the upper hand. In this situation, focus on potentia
post-image
BTC-0.67%
$UAI ‌
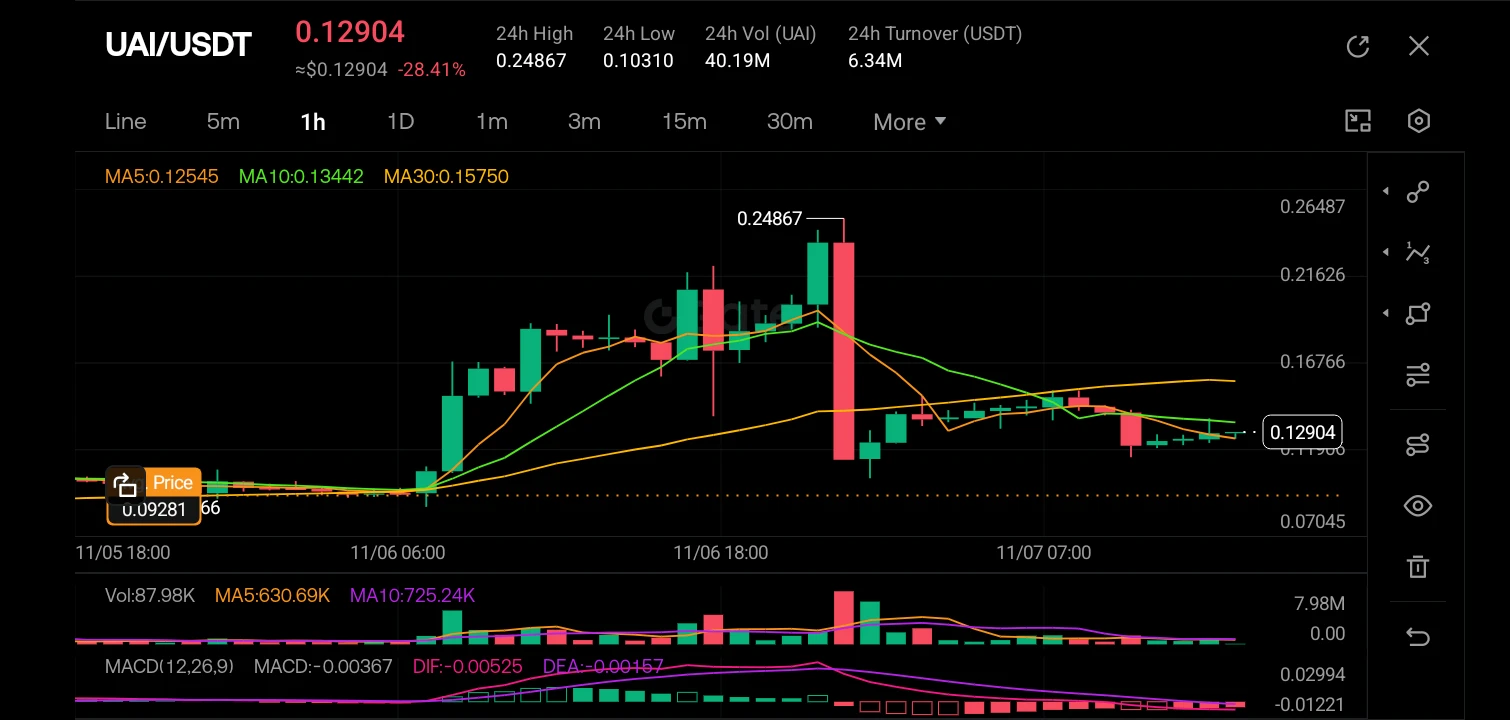
The UAI/USDT 1-hour chart shows a classic "pump and dump" structure, having spiked aggressively from a base around 0.09 to a high of 0.24867 before suffering a massive single-candle rejection that wiped out nearly 28% of value. Currently, price is consolidating in a tight range around 0.12904, trading below the short-term moving averages (MA5 at 0.12545 and MA10 at 0.13442), which act as immediate dynamic resistance. The volume profile shows the heaviest trading occurred during the spike and subsequent crash, while current volume is drying up, indicating a period of indecision and pote
post-image
UAI-7.58%
  • 4
Red broth nine-grid hot pot is still so satisfying!
People from elsewhere think hot pot just needs to be numbing and spicy enough and tasty!
But that's not the case—hot pot places can differ a lot.
If the hot pot base is stir-fried well and the ingredients are fresh, it's delicious.
post-image
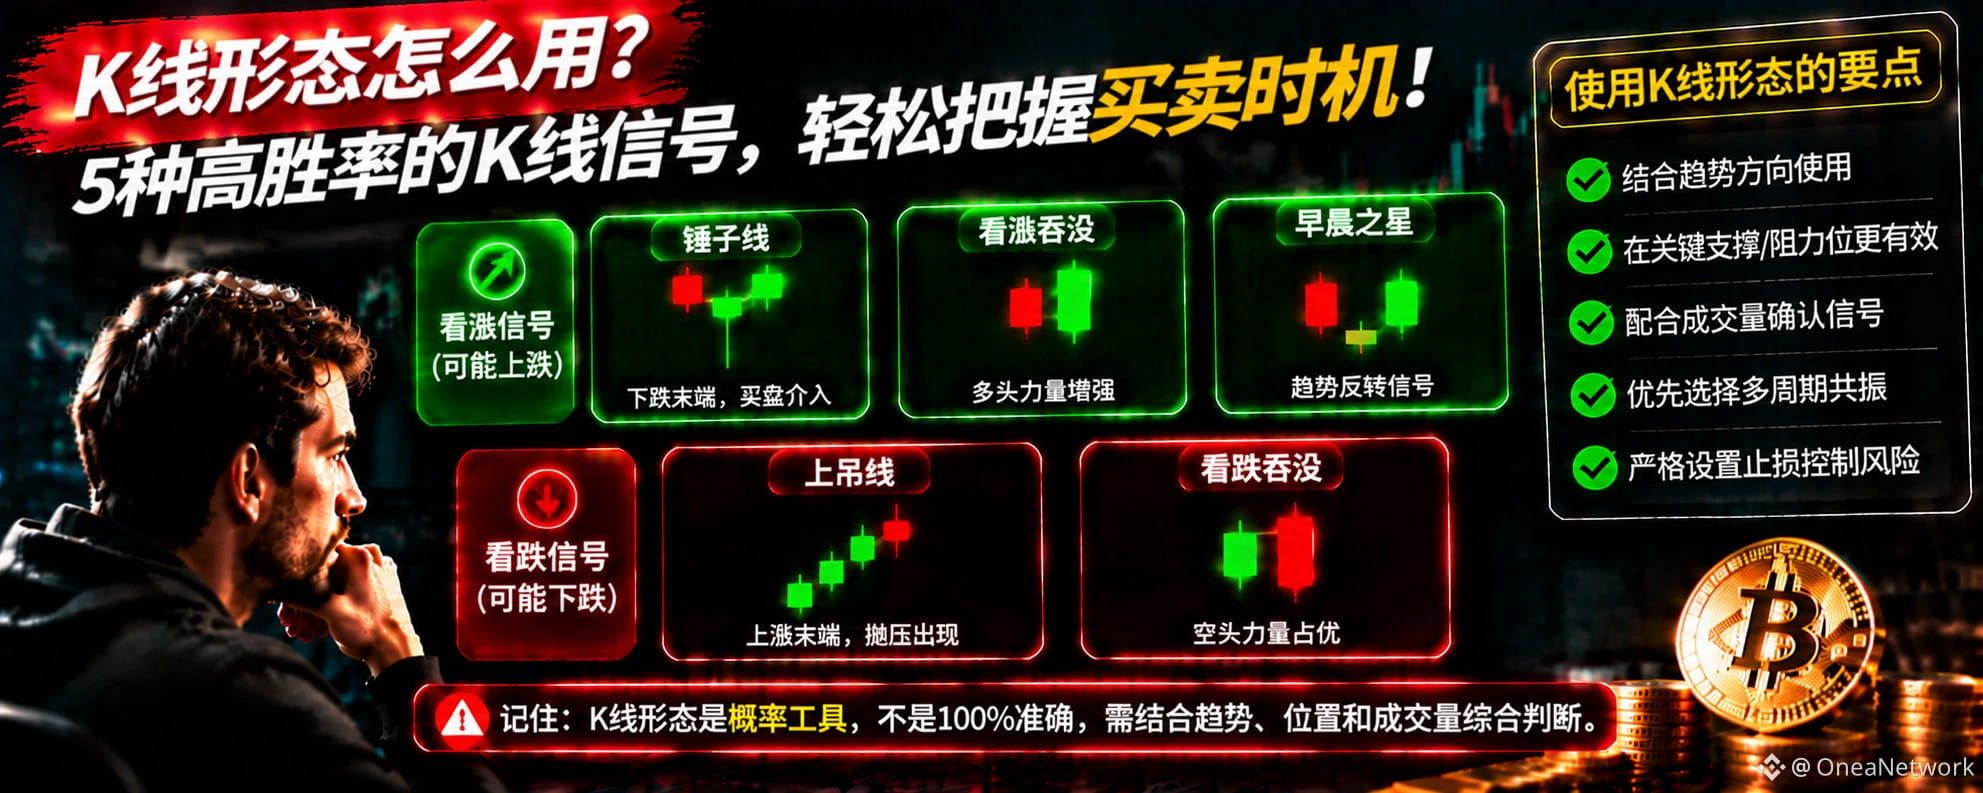
How to Use Candlestick Patterns? 5 Common Signals to Help Identify BTC Buying and Selling Opportunities
In cryptocurrency trading, many people look at candlestick charts every day, but few truly understand the market sentiment behind them.
Why does BTC rise quickly after some candlestick patterns appear? Why does the price continue to fall after other patterns appear?
Today, we’ll introduce 5 common candlestick patterns.
First, the hammer. It usually appears during a downtrend, with a long lower wick and a relatively small body. It indicates that some buying support emerged after the price fel
post-image
BTC-0.67%
There are two things in the world that should not be mocked,
one is your birth,
the other is your dream,
We cannot decide our own birth,
but we can decide to make our dreams come true.
post-image
  • 1
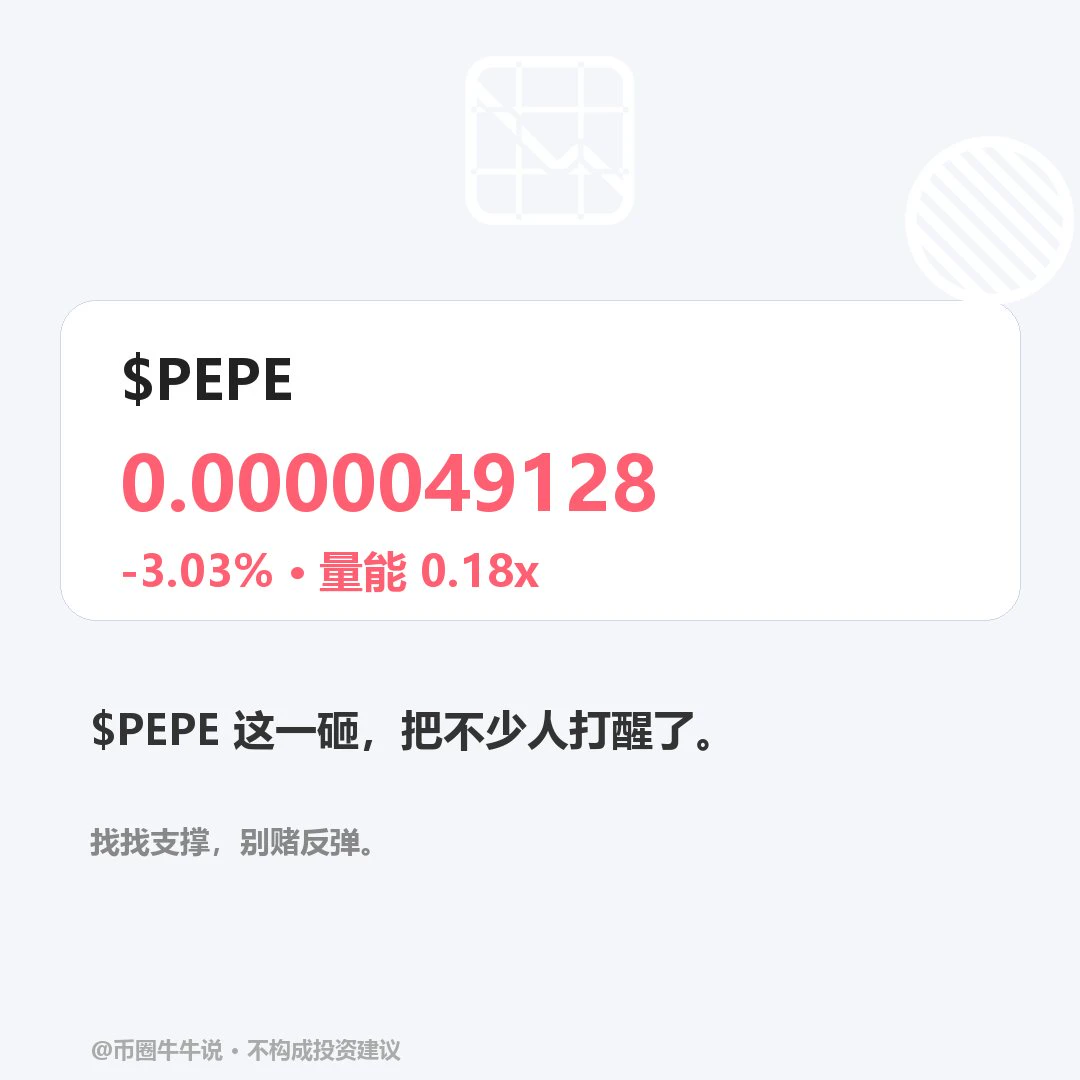
$PEPE Currently at 0.0000049128, down 3.03% over 24H. 1H is weak (RSI 31.32, price below EMA20 at 0.0000049747); 4H is weak (RSI 45.78, price below EMA20 at 0.0000049446), with a volume ratio of 0.18. Holding above the 0.00000520 resistance could point to continued upside; breaking below the 0.0000048871 support would signal short-term weakness. On review, confirm that price holds above 0.00000520 and reclaims 0.00000489; volume is only 0.18x, so a single break across either level needs confirmation from participation. Failure to reclaim the level invalidates the signal. Both timeframes are we
post-image
PEPE+0.97%
How Can You Control Your Trading Mindset? 5 Practical Methods to Avoid Emotional Trading!
In cryptocurrency trading, one phenomenon is very common: many people have studied technical analysis and made trading plans, but once they enter the market, they often make decisions that are completely contrary to their plans.
After a loss, they rush to make their money back; when they see BTC rise rapidly, they fear missing out; after making a small profit, they worry it will disappear. In the end, they keep chasing rallies and selling dips.
Why is trading psychology so important?
First, revenge tradin
post-image
BTC-0.67%
From 81,196 down to 74,888—a $6,308 drop. For anyone long with 10x leverage, that drop was enough to liquidate you twice.

The structure is laid out here, one level at a time:

Downside: 74,888 is the low of this move. Below that is the daily MA200 at 73,200, the last major-cycle threshold. A break below it would mean a genuine change in trend.

Upside: The daily MA100 at 77,200 is the first hurdle; above that, 77,500–78,000 is a double resistance zone formed by the 4H MA20 and MA50. Until price reclaims 77,200, any bounce is just a bounce.

Moving averages: The daily MA5, MA10, MA20, and MA50
post-image
BTC-0.65%
This beef hot pot spot in Kunming is so good 🍲
post-image
Taxes on ETH and BTC are very high. Even though I had set the SL at the Break Even Price, it was still hit at a loss, and then the price immediately took off 😏.
#SquareTradingExpert
#WCTCS9
$ETH ‌
post-image
ETH-1.23%
“Lose 100 trades first, then talk about making money” has discouraged many people, but it’s true: the fastest way for beginners to grow isn’t to learn more—it’s to start with the smallest possible position and seriously lose 100 trades. Why 100 trades? With fewer than 10, you’re relying on luck; after 30, you can spot a few habits; by 100, your patterns of mistakes start showing up again and again—chasing highs, moving stop-losses, adding to losing positions. They’re exposed time after time. Without a sample, your “I feel like I’m improving” is just an illusion. I once met a beginner who’d bee
post-image
BTC-0.65%
Load More

Join 40 M users in our growing community

⚡️ Join 40 M users in the crypto craze discussion

💬 Engage with your favorite top creators

👍 See what interests you

Trending Topics

USAIStocksHitHard

17.41k Views3.65k Discussing

U.S. stocks sold off sharply on Thursday, November 5 (UTC). The Nasdaq closed down around 5.5%, entering correction territory, while the Philadelphia Semiconductor Index plunged roughly 12%, with chip stocks including $NVDA and $AMD posting steep losses. Beyond profit-taking, investors are growing concerned about the pace of AI data center construction, capital spending, and future returns on investment. The key question now is whether the AI sector’s lofty growth expectations need to be repriced. Where do you think the next opportunities will emerge: chip stocks, tech giants, or other sectors?

USNonfarmPayrolls

26.04k Views4.29k Discussing

StakeOnLaunchpoolToShare450KVLX

4.29k Views790 Discussing

View More