








Square
Following
Hot
News
Profile
Share your thoughts
placeholder
Article
A home in Yemen was bombed, killing 7 people, including two children!
When I saw that number, I really wanted to curse someone; another 6 children were injured
Houthi health authorities said the attack took place in Maqbanah district, Taiz governorate, and blamed Saudi Arabia; Saudi Arabia did not immediately respond when AP reported on it
I'm not trying to pin blame on anyone, but a residential home was attacked, and the Houthis say the 7 dead were civilians and another 6 children were injured—this alone is sickening enough
Of the 7 people killed, 2 were children, and all 6 of those injured w
post-image
11.05 BTC Market Analysis
Long: 79900–80300, stop-loss at 79500, targets 81000/81500.
The market saw a classic short-squeeze rally last night, with the price surging from around 75600, breaking through the 80000 mark and reaching a high of 81111. Although this sharp rise was driven by liquidations in derivatives and had considerable strength, short-term indicators need to recover after the sustained rally. There is also profit-taking pressure around 81100, making it risky to chase the price higher.
Structurally, the 79900–80300 area is a key support zone where resistance turns into support aft
post-image
BTC-0.65%
Trenches
ZIG
Z
bade
b
ZIG
0x8c...1145
Market Cap
$.
Change
.
24h Vol
$.
Holders
.
BTC
B
bade
b
BTC
C5xp...pump
Market Cap
$.
Change
.
24h Vol
$.
Holders
.
HIGH
H
bade
b
HIGH
7ymF...high
Market Cap
$.
Change
.
24h Vol
$.
Holders
.
STONK
S
bade
b
STONK
6GmA...UNgx
Market Cap
$.
Change
.
24h Vol
$.
Holders
.
RAM
R
bade
b
RAM
6QUH...pump
Market Cap
$.
Change
.
24h Vol
$.
Holders
.
About to take off for Dalian.
It's the first time we truly explore the northern provinces.
The digital nomad lifestyle lives within us now.
See you soon 🥳
post-image
$FLUID These numbers don’t add up. I chased in at 2.31, and with 25 points in unrealized gains, my hands are shaking a bit.
I watched it slowly climb from 2.00 in the early hours yesterday, with volume picking up moderately. I placed a limit order at 2.31 and set my stop-loss at 1.98. Then today it shot straight up to 2.77, and now it’s at 2.61. The key is that 24h trading volume is 39.8M. Turnover is this strong, but the price hasn’t crashed, which means there’s money buying in.
Three possibilities: first, the major players have finished shaking out the market and are starting to push it up,
FLUID-1.92%
  • 12
  • 1
Why can you be right about the market and still not necessarily make money?
Because trading results depend not only on direction, but also on position size.
An oversized position can turn normal volatility into a severe drawdown; the deeper the loss, the higher the return needed to break even.
First decide how much loss you can tolerate, then determine how much capital to invest.
Which do you find harder: predicting the market or managing position size?
post-image
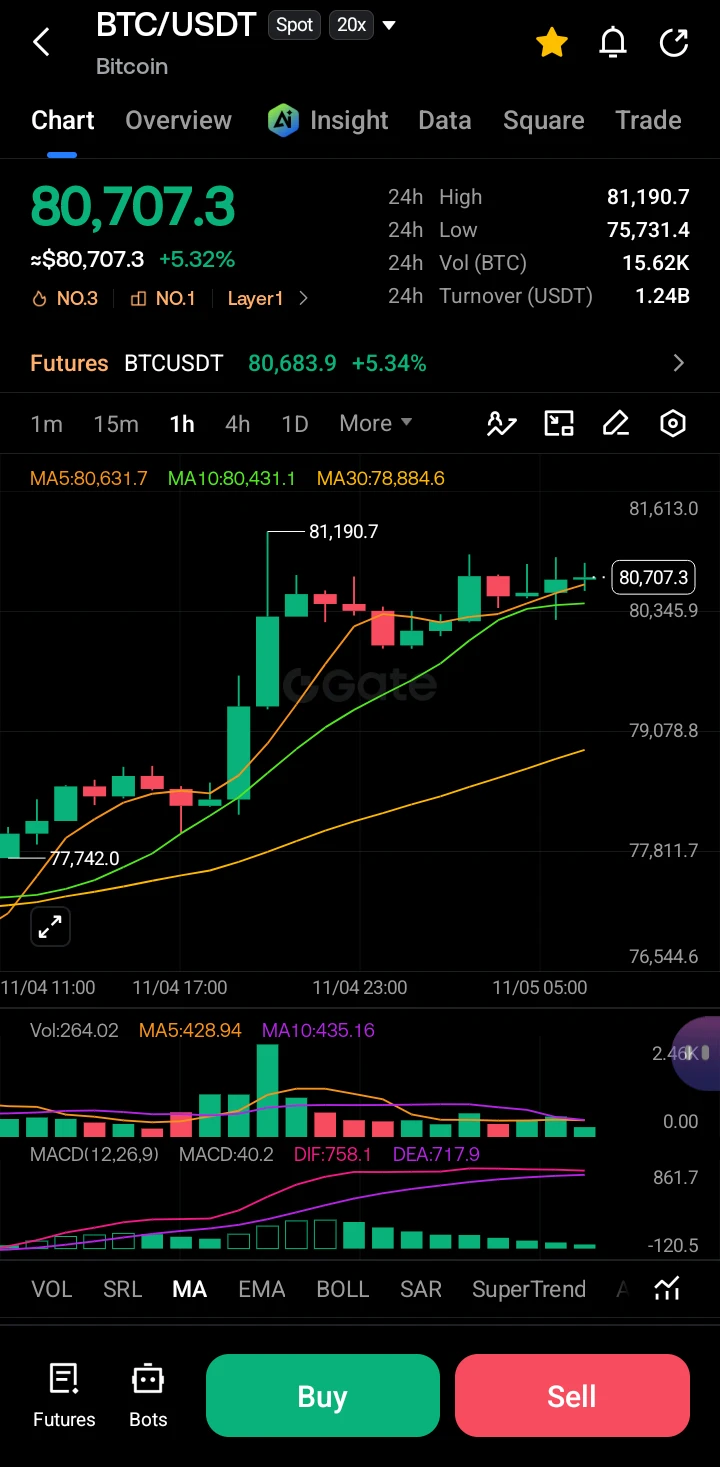
BTC/USDT Market Analysis (Current Price: $80,707)
$BTC ‌
Current Market Situation: Bitcoin is displaying strong bullish momentum, currently trading up over 5.3% at $80,707 after a sharp breakout from the $77,742 support zone. The market is consolidating near its 24-hour high of $81,190.
Key Level: Immediate resistance is at the $81,200 psychological barrier. Crucial support rests at the $80,431 (MA10) and $78,884 (MA30) zones.
The 1-hour chart shows a massive impulsive green candle followed by a tight consolidation phase. Price is holding well above the MA5 ($80,631) and MA10 ($80,431), confi
post-image
BTC-0.67%
  • 7
  • 1
$XAUUSD Starting with 100U, I slowly grew it to more than 10x. A fellow trader liked my track record and chose to copy my trades.
Then I got carried away, broke my rules, and took reckless oversized positions, losing 400U in a single day. My account was down to just 83U. I felt awful and apologized to him, expecting him to leave disappointed. Instead, he just said: “I believe you can win it back.”

Those words brought me to my senses. The crypto market is unforgiving, and the hardest thing to overcome is always our own greed and wishful thinking.
I took a step back and adjusted my strategy, s
XAUUSD+1.78%
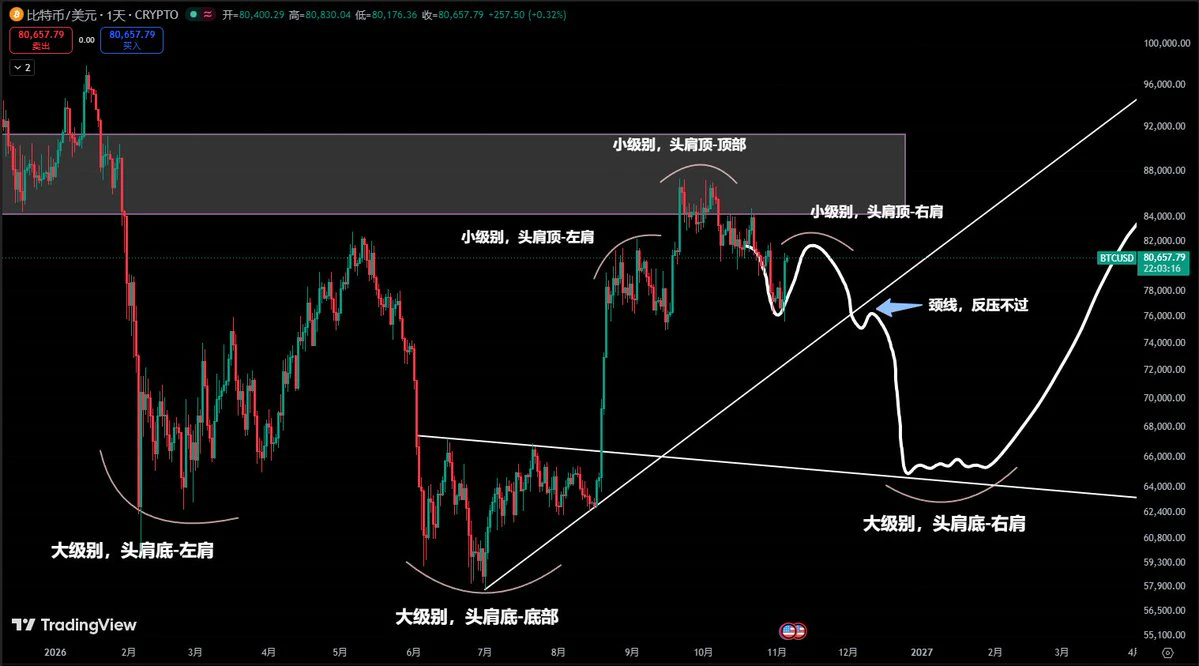
I don't even know what I'm imagining here, but I saw it, so I'll post it anyway👀
Of course, I also don't think BTC has this much downside potential right now
Just for entertainment:
On the larger timeframe, $BTC is near the right shoulder of an inverse head and shoulders, with a potential pullback ahead
On the smaller timeframe, $BTC is near the right shoulder of a head and shoulders top, with a potential pullback ahead
On the smaller timeframe, the right shoulder's pullback breaks below the neckline and fails to reclaim it; then price moves down, completing the right shoulder of the larger i
post-image
BTC-0.67%
#$XAU Gold has shot up to 4100—how did it get there? I haven’t even gotten in yet. Yesterday, all our trades except BTC kept getting pushed up and stopped out. The ETH 2355 short was initially in profit, but that lasted only five minutes before the price pulled back and then broke higher. I was watching the market closely and got out quickly when I saw things weren’t going right. All our long orders got filled. Apart from the BTC contract, the ETH 2244 order was definitely filled—we told everyone to place it, and it wasn’t stopped out! The spot position #ETH #BTC that I assured everyone about
XAU+0.38%
BTC-0.67%
ETH-1.23%
XAG+0.47%
Democrats Continue Pushing the CLARITY Act! With the SEC Potentially Gaining More Authority, Is U.S.
live-cover
LIVE2,926
An English version of “All Is Love” sings of the sorrow of a municipal party secretary, the confusion of a bureau chief, the loneliness of a department director, the regret of a rank-and-file officer, and the grievance and despair of a married secretary. It also plays out a pain that even ibuprofen can’t relieve. Heartbreaking the first time you hear it; after a second listen, there’s nothing left to live for.
In cryptocurrency trading, many people know they should analyze rationally, yet when it comes time to place an order, their emotions take over. When they see BTC rise rapidly, they fear missing out and can’t resist chasing the rally; when the price suddenly drops, they panic and rush to close their positions.
Why is it so easy for trading to become emotional?
First, fear of missing out. When the market suddenly becomes highly volatile, many people worry about missing a chance to make money. They rush in without waiting for confirmation from the signals, often ending up buying near a short-term
post-image
BTC-0.67%
Tron (TRX) is trading around 0.32 this morning, down about 0.6% over the last 24 hours, after holding between about 0.319 and 0.323.
The network keeps doing the heavy lifting on stablecoins: about 19.4 billion in USDT moved on Tron in a single day on 4 November, and its Q3 report put average stablecoin supply at a record $92.25 billion.
$TRX ‌
Its Proposal 108 upgrade, which optimises smart-contract storage, went live on 2 November.
Tron still ranks eighth by market value at around 30.5 billion, down roughly 3% over the past week.
It is worth monitoring whether TRX can recover toward the 0.33
TRX+0.40%
  • 1
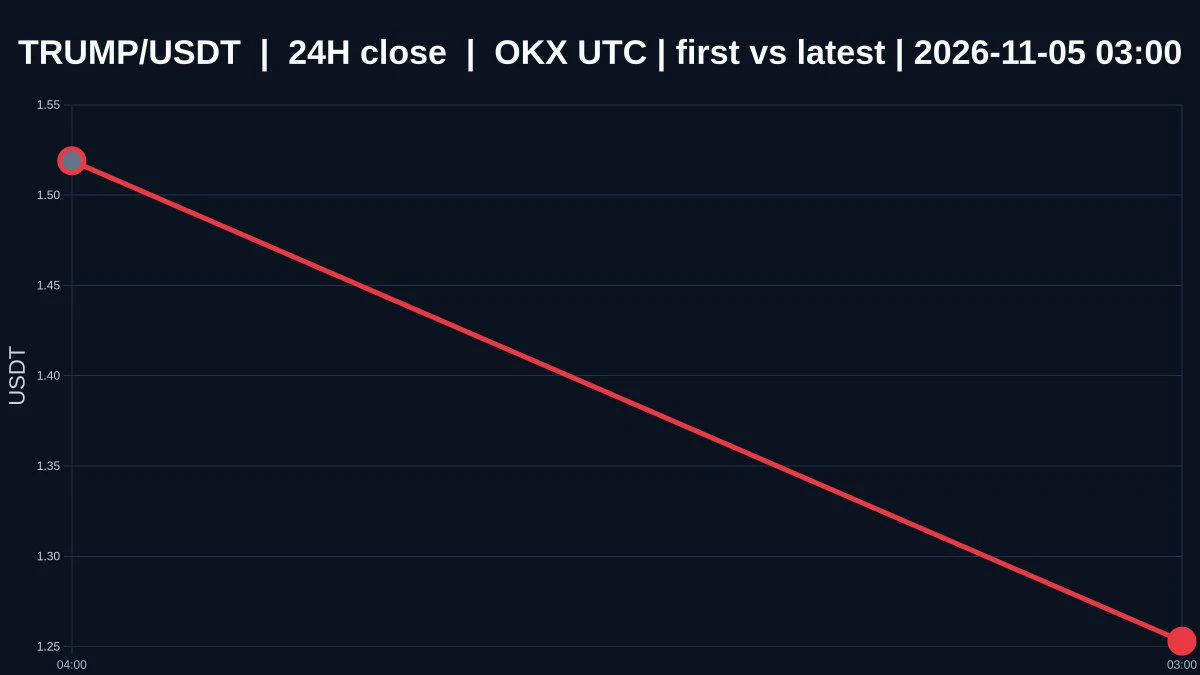
$TRUMP Rebound Demand Is Increasing, but One Piece of Evidence Is Still Missing for a Reversal
$TRUMP The current price is 1.252, down 15.860215053763438% over 24 hours, with an intraday high of 1.538 and a low of 1.218. The 1-hour and 4-hour trends are both weak, and the 1-hour volume ratio is only 0.009428594337919304, far below 1. The price fell from 1.538 to around 1.218. That decline is deep enough that demand for a rebound is indeed increasing, but “oversold” describes a condition, not a conclusion. Until the structure stops weakening, I won’t equate oversold conditions with a bottom.
A
post-image
TRUMP-0.95%
In crypto futures trading, 10x leverage may not sound particularly high, but many traders underestimate the risks behind it.
Suppose you have 1000 USDT and use 10x leverage. This means you can open a position with a notional value of about 10000 USDT (depending on the margin mode and trading fees).
If the market price moves 1% against you, your position will incur an unrealized loss of about 100 USDT, equivalent to 10% of your principal. If the price moves 5% in the opposite direction, the theoretical unrealized loss could reach 500 USDT.
This does not include trading fees, funding rates, or s
post-image
$BTC That four-hour bullish candle looks intimidating at first glance, but a closer look reveals that big money has no intention of sticking around. The past 30 days tell the story: net outflows of 10.1 billion from the derivatives market, with another 1.777 billion pulled from spot. The current excitement is just short-term money hyping itself up, while real big capital packed up and left long ago. This rally is essentially paving the way for a sell-off; anyone chasing it now is voluntarily putting themselves under the market makers’ feet as a stepping stone.
#BTC$BTC
Risk warning: The above
post-image
BTC-0.67%
11.5 Bitcoin Public Trading Plan
[Short setup] $BTC
  Entry range: around 826-834
  Stop-loss defense: 839
Tiered take-profit levels
  First target: 822
  Second target: 812
Third target: around 805
Fourth target: below 796
Trading factors: Price has returned to the upper Bollinger Band, and bullish MACD momentum continues to build. This is a recovery market after prolonged pressure. Market depth observations show bulls in the lead, but their share has weakened noticeably.
Trading advice: The current market is consolidating at a high level. During the day, range-bound
post-image
BTC-0.65%
#BTC重返8万 #每周来晒 #广场交易达人 #WCTCS9 BTC Market Analysis
BTC is currently around $80,650, up 4.9% in 24 hours, and has indeed reclaimed the $80,000 level. But this rebound has mainly been driven by short liquidations, while spot inflows have yet to catch up, so near-term price action is more likely to be choppy.
Here are the main things to watch
ETF flows: There have been cumulative net outflows of about $1.157 billion over the past three trading days, so this source of buying has yet to return.
U.S. stocks and macro factors: Falling Treasury yields and a rebound in U.S. stocks have supported this r
ThisIsTranslateContent:
#BTC重返8万 #广场交易达人 #WCTCS9 BTC Price Analysis
BTC is currently around $80,650, up 4.9% in 24 hours, and has indeed climbed back above $80,000[1]. But this rebound is mainly driven by forced short covering, while spot market inflows have yet to catch up, so near-term trading is more likely to be choppy.
Key factors to watch
ETF flows: Net outflows totaled around $1.157 billion over the past three trading days, so this source of buying has yet to kick in.
U.S. stocks and macro: Falling Treasury yields and a rebound in U.S. stocks have supported this recovery; U.S. employment data on November 6 will affect rate expectations.
· Leveraged positions: When the price quickly rebounded from $75,700, concentrated short liquidations amplified the gains. This type of buying often lasts only until the positions are closed.
Several key price levels
$81,000–$82,000: Near-term resistance; a move up to this level could easily be followed by a pullback.
$80,000: The key support level now. A daily close below it could lead to another test of around $77,600.
$85,000–$87,500: The area with the heaviest concentration of underwater holders and sell orders, making a near-term breakout difficult.
Two possible scenarios
If BTC holds above $80,000, ETFs see consecutive inflows, and trading volume expands: upside opens up, with $90,000 as the next target.
If BTC falls back below $80,000: Previous downward pressure will return, and the price could retest $77,600.
For now, trading within a range looks more suitable. Wait for ETF inflows to return and for the daily close to hold above $80,000 before deciding whether a new uptrend has begun.
Whether this rebound can last mainly depends on whether new money enters the market. A price rise accompanied by inflows into ETFs and stablecoins would indicate a more sustainable move.
On-chain data: See who holds the coins
Exchange balances: A decline means coins are being withdrawn and held, easing selling pressure; a rise suggests people are preparing to sell.
SOPR: Above 1 means most sellers are making a profit; below 1 means people are selling at a loss.
Long-term holder activity: Little movement in older coins suggests large holders are not selling.
Realized market cap: If it rises along with the price, that suggests new money is entering; if only the price rises, existing funds are probably just changing hands.
Market indicators: See whether money is flowing in
ETF net flows: Consecutive days of net inflows would show institutional buying has returned.
Total stablecoin market cap: A rise means money on the sidelines is still waiting to enter.
Trading volume: A rally on rising volume is much more solid than one on declining volume.
Funding rates: A return to neutral means leveraged chasing has cooled, making the market healthier.
Watch for these signals
Bullish: Consecutive ETF inflows, growth in the total stablecoin supply, and closes holding above $80,000.
Bearish: A fall below $80,000, a return to net ETF outflows, and a marked increase in exchange balances.
ETF outflows have yet to show a consistent slowdown, and the total stablecoin supply has not reached a new high, so this looks more like a short-term rebound; a trend reversal still needs confirmation from fund flows.$BTC

repost-content-media
BTC-0.67%
  • 3
$ETH First short-term trade closed at take-profit
ETH-1.26%
Load More

Join 40 M users in our growing community

⚡️ Join 40 M users in the crypto craze discussion

💬 Engage with your favorite top creators

👍 See what interests you

Trending Topics

BTCBackAbove80K

16.93k Views41.09k Discussing

After a sharp dip, Bitcoin climbed back above $80,000 on May 9 and is currently trading around $80,200. Over 50,000 traders were liquidated in the past 24 hours amid fierce long-short battles. The recurring Iran-U.S. tensions remain the primary short-term variable. Following U.S. airstrikes, Iran\'s Revolutionary Guard claimed to have breached the Strait of Hormuz defense line, leaving the ceasefire outlook uncertain. On the technical side, the daily SMA20 ,$77,970 serves as key support, with the RSI recovering from oversold levels to 43. The $80,000 level is both a psychological barrier and a bull-bear dividing line.Holding above it could lead to a challenge at $85,000, while a break may trigger a retest of the $77,000 area.

DemocratsWinBothChambers

15.81k Views410 Discussing

GateLaunchesTaiwanStockTrading

13.86k Views269 Discussing

View More