Square
Following
Hot
News
Profile
Share your thoughts
placeholder
Article
I did nothing—just went to the restroom, and when I came back, the candlestick chart had already done the work for me.

I was watching $HOOKED while it was bottoming out intraday. It held after the pullback, and buying pressure was clearly strengthening. My bullish call was simply to wait patiently for confirmation. While others were still doubting, I had already written out the plan: hold if it doesn’t break down; accept it if it does. At levels like this, impatient people get nothing—only the steady-handed get their share. I don’t guess the top or the bottom; I only trade the move after con
post-image
BNB-4.89%
SNDK-4.77%
Some buyers have started stepping in for Bitcoin, but it’s still too early to say the decline is over.
BTC dropped as low as $80,394 yesterday and has now rebounded to around $81,900.
A few changes in this rebound are worth noting: open interest has declined significantly, buying demand is beginning to recover, and U.S. Treasury yields have also pulled back somewhat. Market pressure is lighter than it was yesterday.
But one question remains unanswered: Did large players actually enter the market to buy the dip, or did shorts simply take enough profit and start closing their positions, pushing
post-image
BTC-1.85%
$QNT
is stuck in an awkward phase, with the founder frantically moving funds to exchanges and retail traders trembling in fear. But the whales are still lurking in the market—who would dare open a heavily leveraged short? A huge bullish candle could teach you a lesson in minutes. Meme coins don’t dawdle; a major move is coming 😏🔥
post-image
QNT-4.57%
$MU /USDT is quietly building a trap that most traders will miss entirely.

$MU /USDT - SHORT

Trade Plan:
Entry: 1036.44 – 1041.20
SL: 1061.64
TP1: 1021.70
TP2: 1010.29
TP3: 993.17

Why this setup?
Why now? The 1h price is sitting at 1038.82 inside a tight entry zone between 1036.44 and 1041.20, which means the market is coiling right at the edge of a decision. The 15m RSI at 38.74 confirms short-term momentum is already fading without yet being oversold, so the move is likely to continue rather than reverse. The 1h ATR of 9.510169 tells us each candle carries enough volatility to push thr
MU-4.31%
Financial News, Crypto Updates, Real Trading Strategies
live-cover
LIVE880
$SOL has entered the oversold zone, but “it’s due for a rebound” and “it has bottomed” are completely different things.
I’m watching just one divergence: whether there is still buying support after breaking above 116.81. The current price is 110.33, with volume at 0.11x. The 1-hour and 4-hour trends are both weak, with RSI at 33 and 18, respectively.
If volume continues to expand after breaking above 116.81, control will favor the bulls; if it breaks below 105.71 and fails to reclaim it, the short-term outlook is invalidated. Stop trying to call the bottom for now and wait for a new support s
post-image
SOL-5.86%
🔥 $JCT
Going big on a long position again, brothers. Yang is here 💰 Entry 0.00259-0.00262, stop loss 0.00199, take profit 0.00300-0.00350-0.00400. Go long $JCT 👇
post-image
JCT+47.13%
The day before yesterday, someone said NVIDIA hit a new high, and many retail traders started fantasizing that the AI bull market would continue. How is that any different from FOMOing into BTC at $126k?
In many cases, the final subwave of Wave 5 has to set a new high,
This is not the bull market continuing, but a signal that the bull market has reached its highest point.
If you short it at this point, the win rate is absurdly high.
#NVDA #英伟达 #BTC
post-image
NVDA-2.86%
BTC-1.84%
$ZEC
This ZEC move is absolutely insane—one short after another happily got back to breakeven, while I just had to get wiped out at 1678 in one sweep, right at the very top! So frustrating😭 Watching everyone else hold on until they recovered their losses, I didn't even get the chance to hold on.
post-image
ZEC-10.35%
[new streamer] btc market update
live-cover
LIVE64
Shill me the next #memecoin that's going parabolic.
post-image
🟢Uptober!
Which community will build up?
#crypto #gems
post-image
GEMS-3.87%
The Federal Reserve's September meeting minutes were released on October 7, and the market's interpretation of them has been far from straightforward. All nineteen officials supported the quarter-point hike that lifted the benchmark rate to 3.75%–4.00%, and most participants believed another increase by year-end could be appropriate. Yet within days, the implied probability of a hike at the October 27–28 meeting fell below 20%, down from roughly 70% in the period immediately after the September decision. That gap between the minutes' language and the market's pricing is the central fact shapin
post-image
User_any
When the Federal Reserve released the minutes from its September meeting, the immediate reading was that the central bank was still leaning toward tightening. All nineteen officials supported the quarter-point hike that lifted the benchmark rate to 3.75%–4.00%, and most participants believed another increase by year-end could be appropriate. Yet the market’s response over the following days told a different story. The odds of a hike at the October 27–28 meeting have fallen to roughly 17%–20%, down from nearly 70% in the days right after the September decision. That gap between what the minutes said and what traders are pricing is the central tension in the market right now.
Part of the explanation lies in the language the minutes used. While most officials saw another hike as potentially appropriate, the document also stressed that decisions would remain data-dependent and gave no indication that October was the intended venue. The phrasing “by year-end” rather than “at the next meeting” left room for interpretation, and the market chose to read it as a signal that the Fed is in no rush. Officials have reinforced that view in public remarks since the meeting. Fed Governor Christopher Waller said this week that further rate hikes are needed, but he also noted that the labor market is cooling and that the central bank can afford to be patient. That combination—a willingness to tighten, but without urgency—has kept October hike odds low.
The data that has come in since the September meeting has supported the patient approach. The August PCE price index, the Fed’s preferred inflation gauge, rose 3.4% year over year, below the 3.7% consensus estimate, while core PCE came in at 3.0%. The September jobs report, released on October 2, showed the economy added just 29,000 jobs, far below expectations, with the unemployment rate ticking up to 4.2%. Softer inflation and a cooling labor market give the Fed room to hold rates steady at the October meeting without risking a surge in price pressures. The market has interpreted that combination as reducing the case for an immediate hike.
That brings us to the October 14 CPI report, which is now the single most important data point on the calendar before the Fed meets. Forecasts point to headline inflation rising to around 3.6%–3.7% year over year, up from 3.4% in August. Core CPI, which strips out food and energy, will draw the most attention because it is a better gauge of underlying price pressures. If core CPI comes in at 0.3% month over month or higher, the case for an October hike will resurface, and the odds could climb back toward 40%–50%. A softer reading, closer to 0.2%, would confirm that inflation is continuing to cool and would likely keep October hike odds where they are—or push them lower still.
So how would a hotter-than-expected CPI print affect the Fed’s decision? The minutes already noted that inflation risks are skewed to the upside, with some participants concerned that energy prices and the AI buildout could keep price pressures elevated. A hot CPI reading would validate those concerns and give the hawks on the committee a stronger argument for acting in October rather than waiting until December. But it is worth remembering that the Fed has repeatedly emphasized its data-dependent approach. One inflation report alone is unlikely to force a hike if the broader trend still points toward gradual cooling. The bar for an October move is high, and it would likely take a combination of hot inflation and resilient jobs data to clear it.
For crypto and U.S. stocks, the transmission channel runs through rate expectations and the dollar. When hike odds fall, the opportunity cost of holding risk assets declines, which tends to support prices. Crypto investment products recorded $3.55 billion in inflows in the week after the September hike, the largest weekly figure of 2026, showing how sensitive digital asset flows are to the rate outlook. But the relationship is not one-directional. The 10-year Treasury yield is holding near 5.28%, and the 30-year is near 5.63%, both at multi-decade highs. Those elevated yields continue to weigh on valuations, particularly for high-growth sectors that depend on discounted future earnings. A softer CPI print would ease that pressure by reducing the probability of further tightening. A hotter print would do the opposite.
Is the current outlook already priced in? Largely, yes—but not entirely. The market has priced a pause for October and a hike for December, with December odds around 70%. Those expectations are reflected in current asset prices. What is not fully priced is the possibility of a meaningful surprise in the CPI data. If the report comes in significantly above or below expectations, the repricing could be sharp, because so much of the market’s positioning is built around the assumption that the Fed will hold in October. A hot print would force traders to reconsider that assumption, and the adjustment could ripple across bonds, currencies, equities, and crypto simultaneously.
My own view is that the Fed is unlikely to hike in October unless the CPI report delivers a genuine upside surprise. The labor market is cooling, inflation is trending in the right direction, and the committee has signaled that it sees no urgency to act. The December meeting remains the more likely venue for the next move, if there is one at all. But the October 14 CPI release is the variable that could change that calculus. Until it lands, the market is operating on incomplete information, and the gap between the hawkish minutes and the dovish pricing will remain unresolved.
This article is not investment advice. Analysis is based on publicly available information and does not guarantee future outcomes.
$BTC $ETH $GT
#ShareWeekly #FedSeptemberMinutesLeanHawkis
BTC-1.84%
ETH-3.71%
GT-2.43%
NVDA-2.86%
SNDK-4.91%
  • 1
  • 1
$BTW For it to truly collapse violently, there needs to be a top-to-bottom arc sweep and whisker-pulling move. Ae is shorting it and has moved the stop loss farther away. If a slight collapse is already profitable, take profit and cut it directly.👌
Short, short, short🔥🔥Tp1: 1.25 Tp2: 1.05 Tp3: 0.9—into the ground💸Stop loss: 1.97 $Lobster $B
post-image
BTW+3.41%
龙虾+20.18%
I just opened a buy order $CT
. Entry now: buy at 0.31500 or 0.31200; first target 0.32500, second 0.3400, third 0.3500, final target 0.3600-+; stop-loss set below 0.2900.
post-image
CT-14.99%
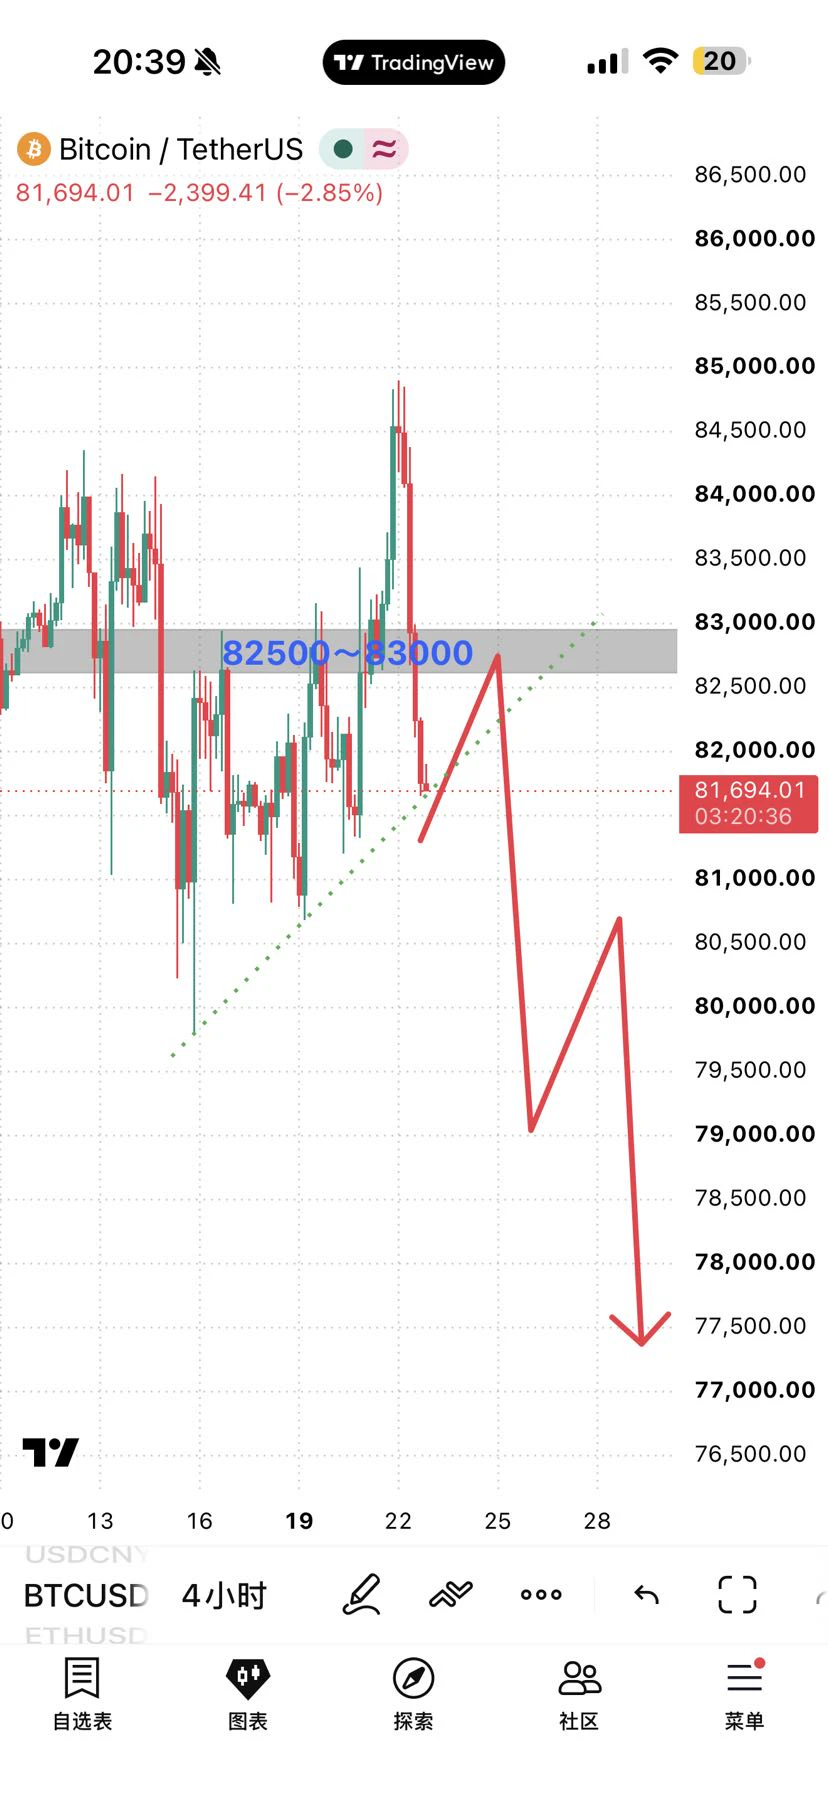
I do believe this remains $BTC the most likely scenario.
Shorting could become interesting around the $82,000–$82,500 area.
Since we failed to hold $82,000, this level has now turned into resistance.$BTC
post-image
BTC-1.85%
Robinhood Adds $25M Bitcoin to Corporate Balance Sheet
Robinhood has made its first corporate Bitcoin purchase, adding $25 million in BTC to its balance sheet and deepening the company’s involvement in the crypto market.
The transaction was revealed by Johann Kerbrat, Robinhood’s head of crypto, during an interview at the Digital Asset Summit Asia. Unlike crypto assets held on behalf of customers, the Bitcoin acquired in this trade is owned by Robinhood itself.
⚠️ Personal market analysis only. NFA — manage risk and DYOR.
Educational content, not investment advice or a recommendation to buy, s
post-image
HOOD-2.29%
BTC-1.84%
A hand that set the stop-loss a few days ago trembled slightly; this morning, I realized that filial piety was unnecessary. 😐
A few days ago, while the market was grinding out a bottom in the afternoon session, I had already set my sights on this rebound. Every push upward fell just short, with heavy selling and no one buying higher. I judged that the price was stagnating at the highs, so a short could be tried. Someone asked whether it would break out, and I said: the volume isn't enough; the breakout is just a fake move. While everyone else was running, I was calmer because I knew the trapp
post-image
NMR-7.61%
XRP-2.41%
SNDK-4.77%
How Pi Network Is Embracing Stablecoins
The Pi Network ecosystem, built around Pi Network utility, continues to expand across applications, developer tools, platform-level services, commerce, payments, and other areas, creating more ways for Pioneers and businesses to participate and build on the network. Stablecoins can play an important role in certain utilities within the expanding Pi ecosystem, especially in use cases where predictable price stability is essential.
Introducing a stablecoin requires a deliberate and distinctive approach, and must align with the Pi Network ecosystem and its
post-image
PI-0.48%
Load More

Join 40 M users in our growing community

⚡️ Join 40 M users in the crypto craze discussion

💬 Engage with your favorite top creators

👍 See what interests you

Trending Topics

Gate Money Officially Launches

3.46k Views12.88k Discussing

Gate officially launches Gate Money, a global integrated financial services app that brings digital assets, fiat, stocks, ETFs, gold, bank accounts, and payments into one Gate App. Users can manage assets, invest, send and receive funds, convert currencies, and make payments — all from a single account. Which use case are you most excited about? [👉 Learn more](https://www.gate.com/announcements/article/102094)

Fed September Minutes Lean Hawkish

64.17k Views2.72k Discussing

Samsung Q3 Operating Profit Surges 782.5%

36.94k Views1.93k Discussing

View More