Square
Following
Hot
News
Notifications
Profile
Share your thoughts
placeholder
Article
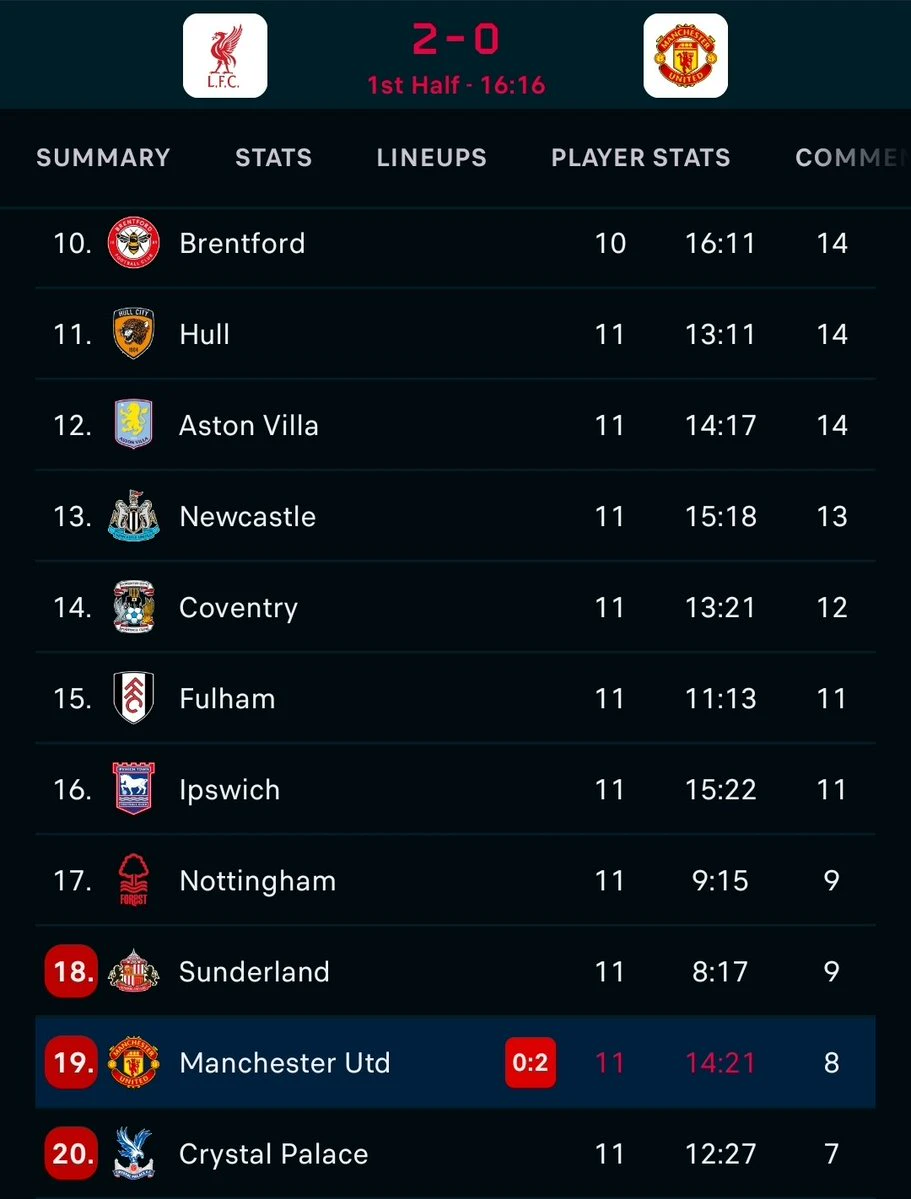
Max pain right now is being a united fan. However I won a medal and certificate in today's killer darts comp in the hotel just to take the sting off a bit 🎯 Going for the killer pool double bare minimum before the hol is over. Might even fly over to anfield to keep this scoreline from getting embarrassing. Poch has got his work cut out with this shower of shite
post-image
Aoying Capital, the top-ranked player on the profit leaderboard, continues to add to its long positions. While you're still foolishly watching, this big player has already sniffed out the opportunity. Will you choose to trust yourself or stand on the shoulders of giants?$BTC ‌$BTC $ETH #熬鹰资本
BTC-0.65%
ETH-1.23%
Trenches
PIEVERSE
P
bade
b
PIEVERSE
0x0e...25a9
Market Cap
$.
Change
.
24h Vol
$.
Holders
.
IDOL
I
bade
b
IDOL
0x3b...ab07
Market Cap
$.
Change
.
24h Vol
$.
Holders
.
JAGENT
J
bade
b
JAGENT
0x8e...ae15
Market Cap
$.
Change
.
24h Vol
$.
Holders
.
mihao
m
bade
b
mihao
4Cxj...pump
Market Cap
$.
Change
.
24h Vol
$.
Holders
.
BLOB
B
bade
b
BLOB
8s11...pump
Market Cap
$.
Change
.
24h Vol
$.
Holders
.
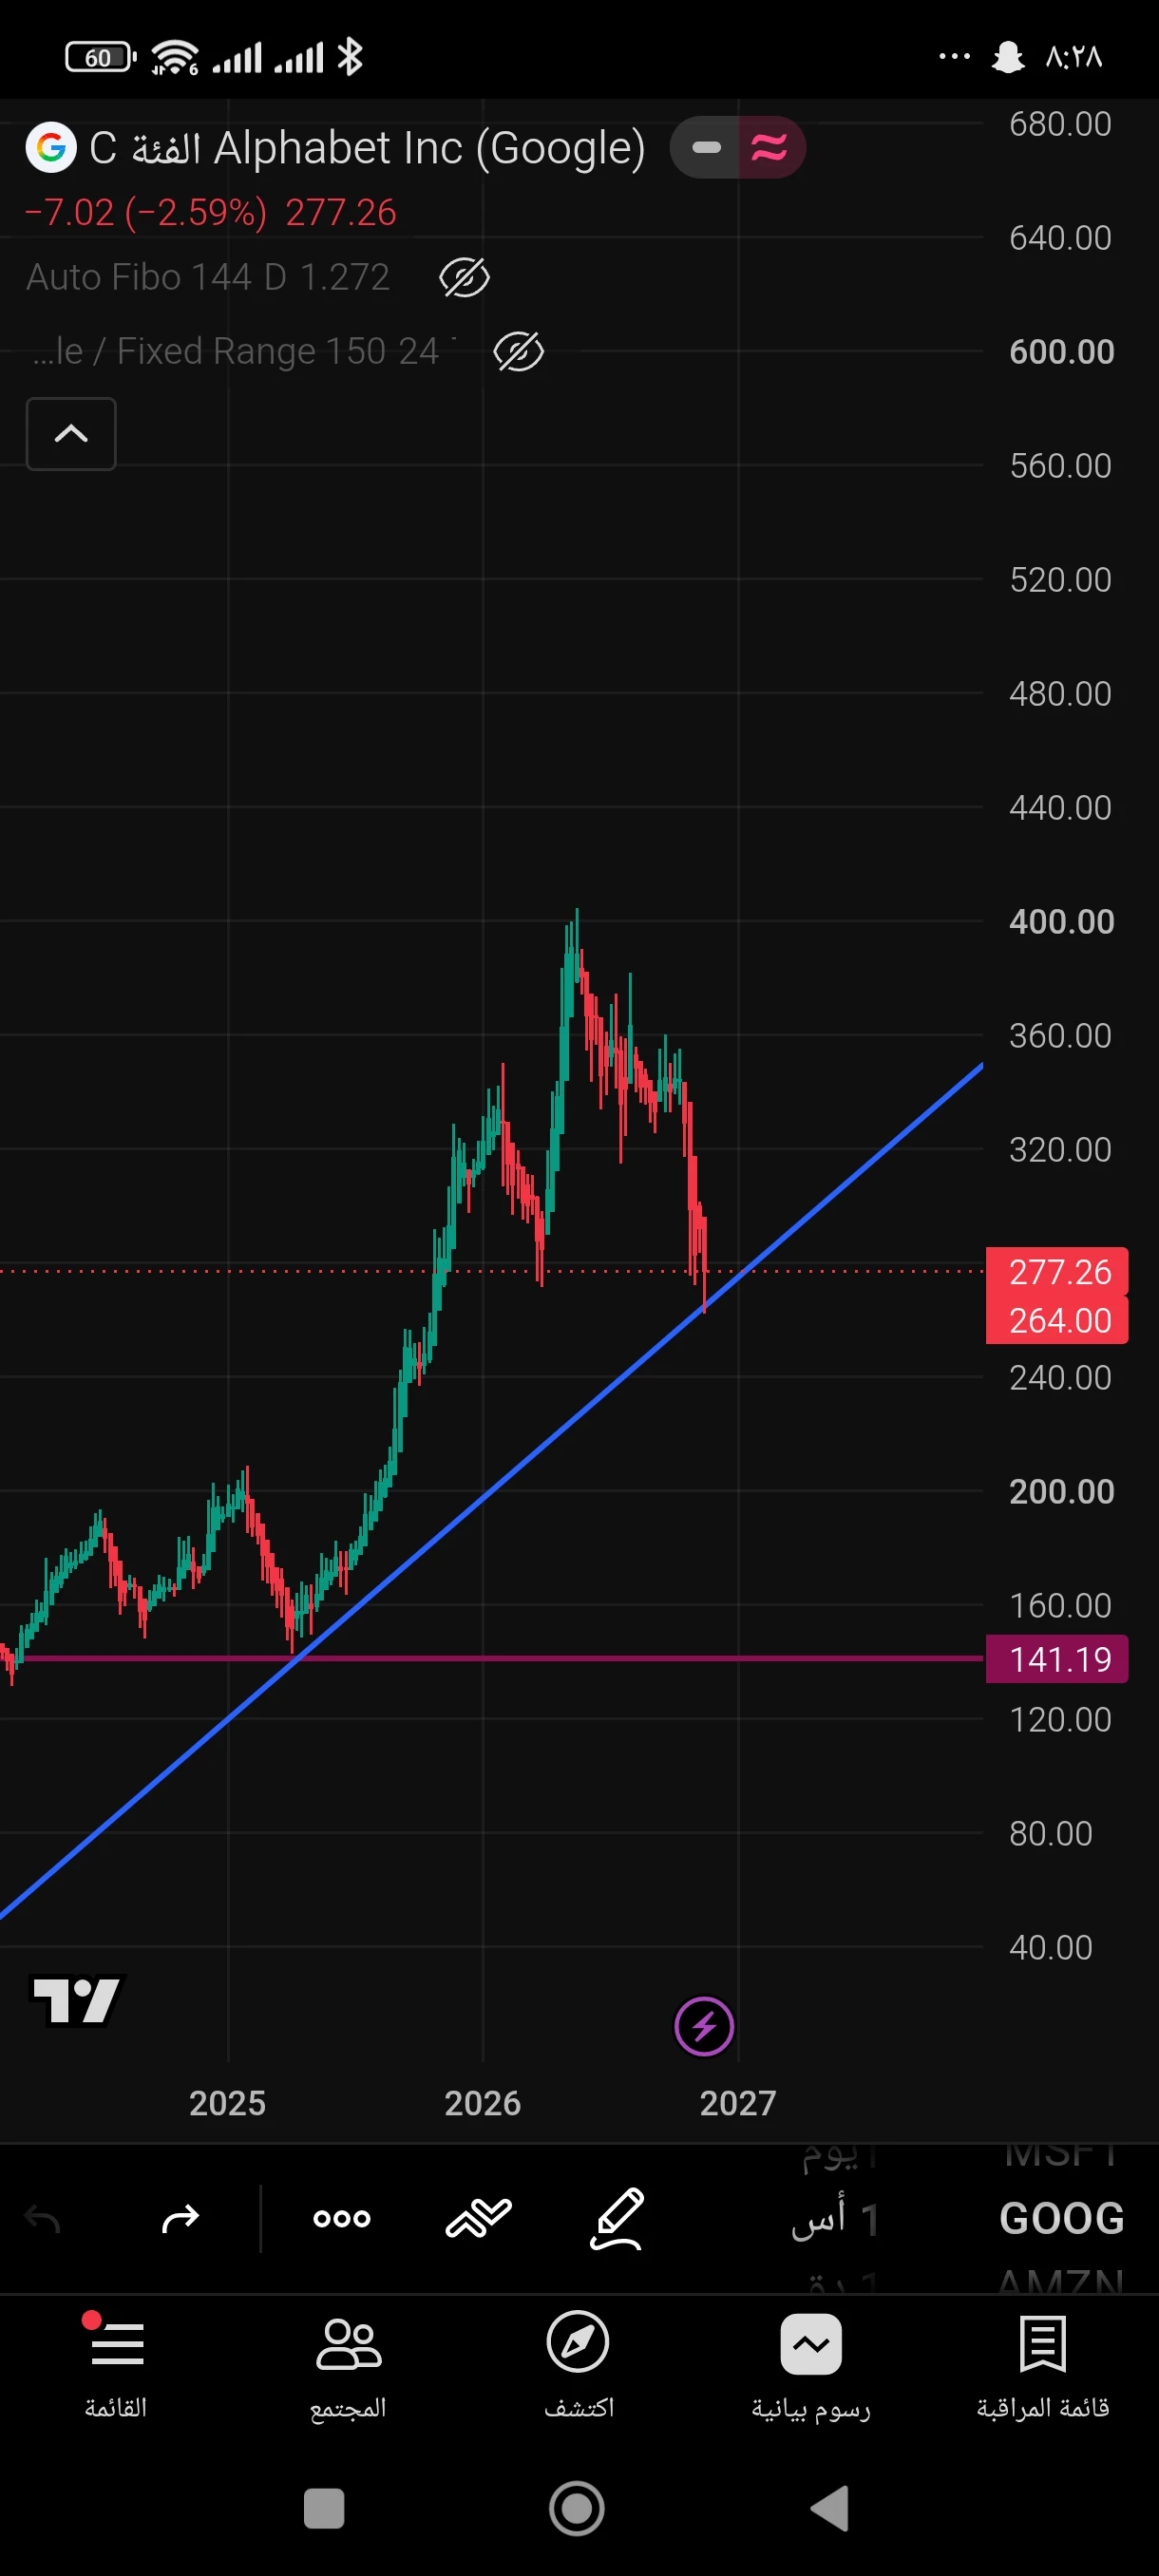
🚨 Beware potential downside in Google (Alphabet) stock... The $275 level is decisive! 📉

The stock is at a sensitive technical stage on the weekly timeframe, after coming under selling pressure and breaking below the previous support zone between $270 and $275.

But the next scenario depends on the stock’s ability to reclaim this area and hold above it.

📉 Bearish scenario:

If the stock fails to hold above $275 and resumes trading below it, we could see another downward wave, with a possible test of $265, then $257–$260 if selling pressure continues.

Reclaiming $275 and holding above it,
post-image
GOOGL-2.50%
  • 1
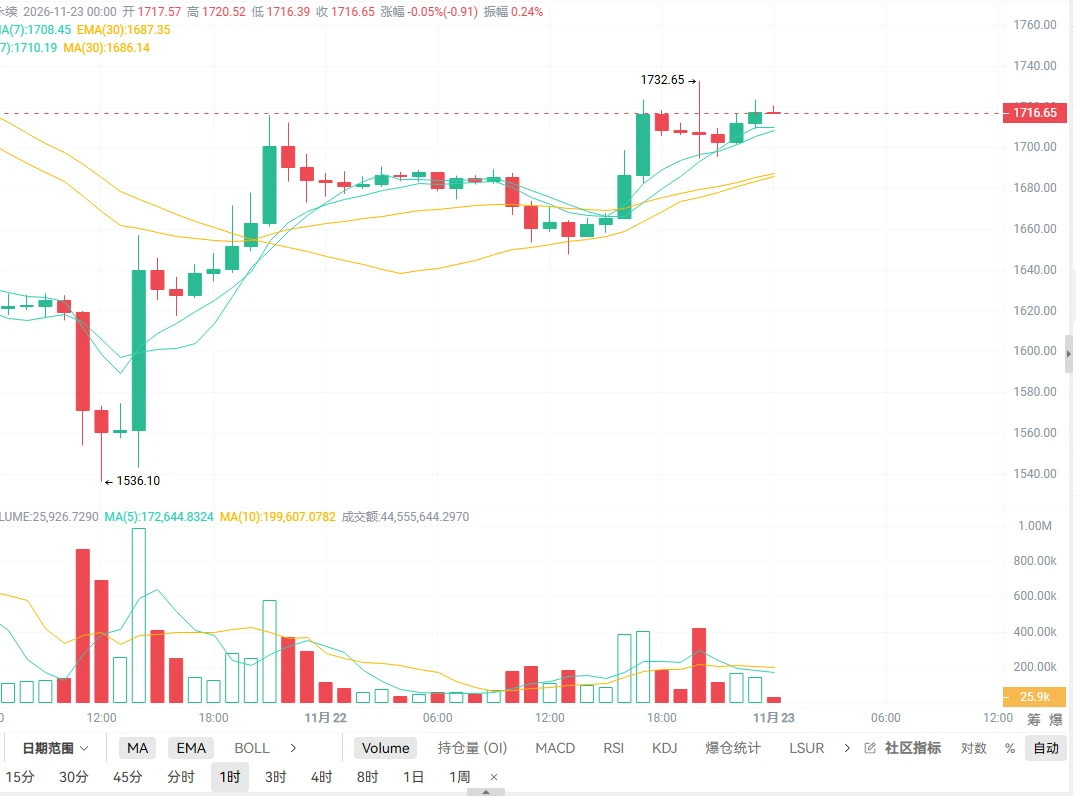
Yang Guang bit | November 23 $ETH Rebound hits medium-term resistance; go short with the trend amid hawkish pressure and outflows
【Today’s Strategy】
Entry timing: When the price rebounds to the 1720–1745 area
Stop-loss: 1765
Staggered take-profit targets:
First target: 1690–1680
Second target: 1660–1640
【Key Takeaway】
A high-interest-rate environment puts greater valuation pressure on high-beta assets like Ethereum. The US stock market open at 22:30 tonight is a key test of risk sentiment, and Williams is scheduled to speak early Tuesday. On-chain, institutional capital continues to exit. On
post-image
ETH-1.23%
Next Week in Crypto: A Dual Test of Data and Liquidity (November 23–29)
PCE and GDP on the same day—holiday liquidity declines—watch interest rates before crypto prices
I. The key issue this week is not whether the data are high or low, but how they combine
On November 25, the U.S. will release the October personal income and spending report as well as the second estimate of third-quarter GDP. PCE inflation data will determine the inflation outlook, while the revised GDP figure will shape growth expectations.

Three combinations correspond to different trading logic:

Cooling inflation, sta
BTC-5.94%
ETH-9.05%
NAS100-0.07%
  • 3
  • 2
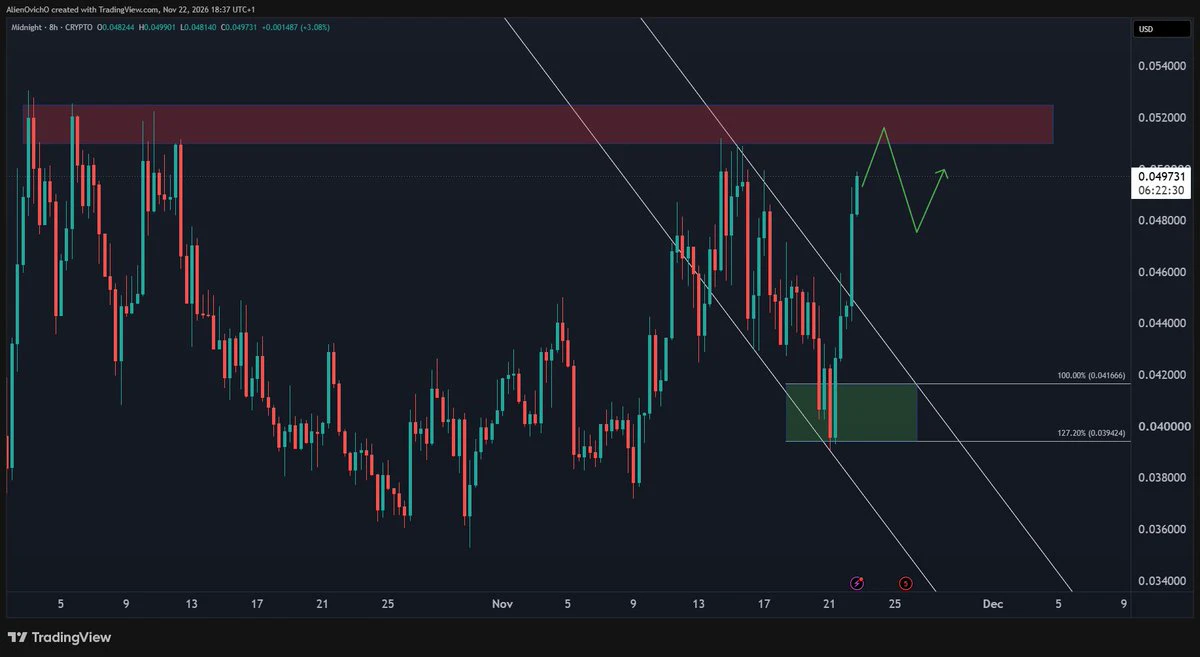
midnight-3:native found buyers at 0.041–0.039 and broke out of the falling channel 👀
Next test is the 0.05–0.052 resistance area. A break above it opens 0.08.
Breakout or rejection?
post-image
NIGHT-3.10%
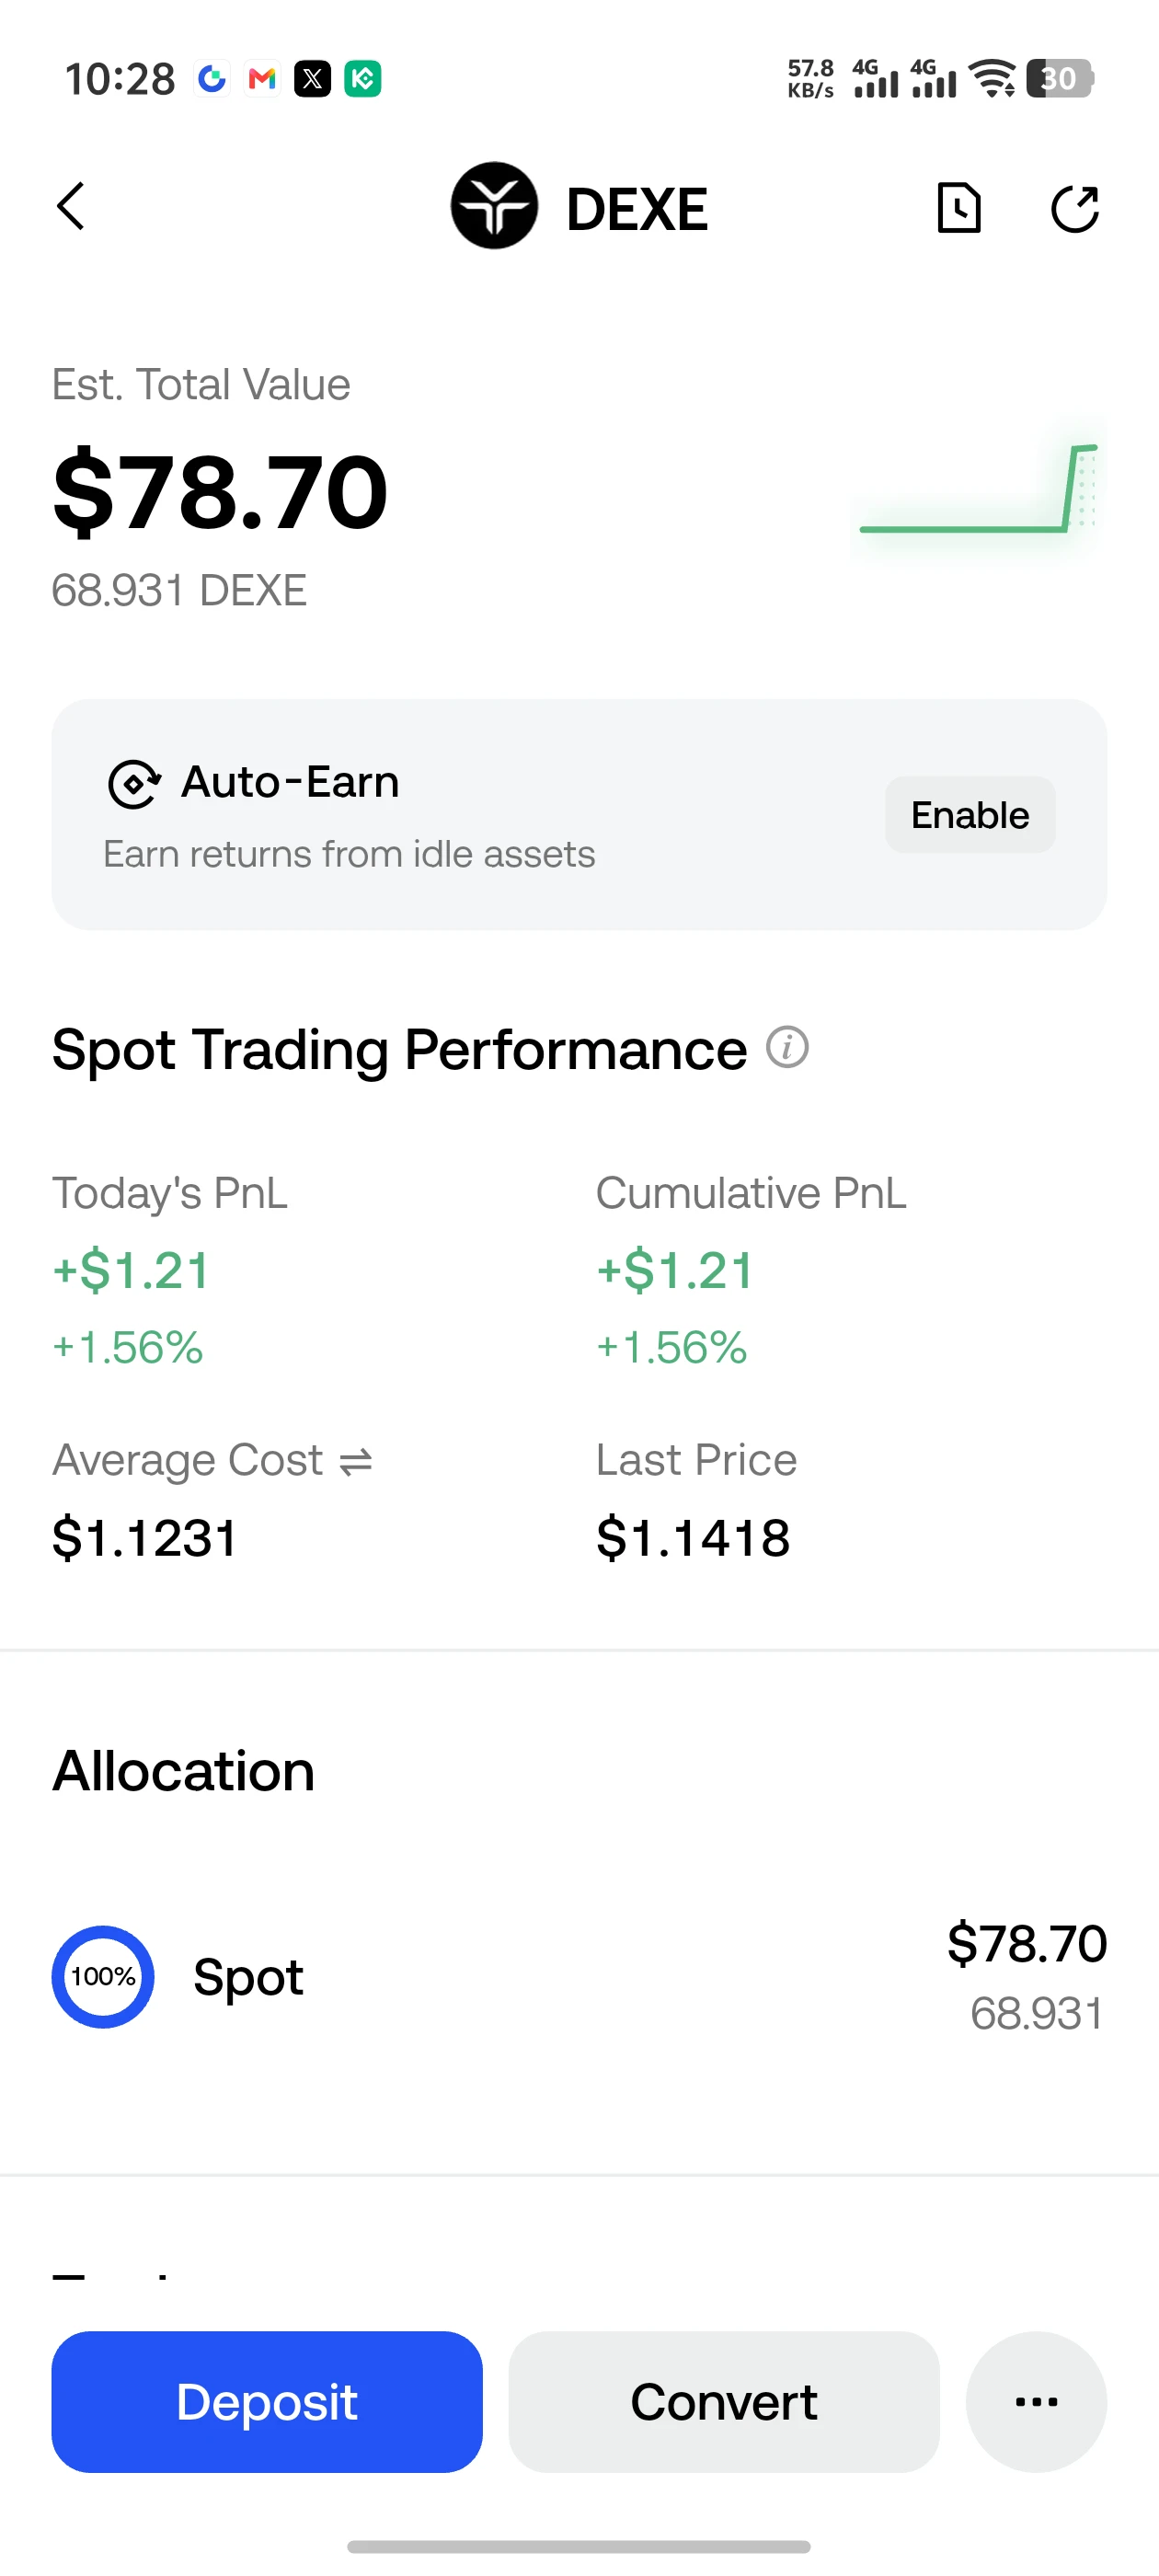
If I have $10k , I'm going to invest in $DEXE 😎💯 ‌
post-image
DEXE-4.14%
  • 5
  • 1
$SPCX Big Rocket long trade plan: targets 135 and 138, stop-loss at 126! There’s rebound demand here!
post-image
SPCX+0.78%
Crypto Market Updates
live-cover
LIVE676
ETH-1.26%
BTC-0.67%
GTA 6 in real life
post-image
Governments are finding it increasingly hard to steer the energy transition. COP meetings are bustling, the agendas look polished, but what really determines the path of emissions is the power grid, the equipment, and where the money flows. Meetings are one thing; implementation is another. Don’t confuse the two. The answers are hidden in the details. Am I being too pessimistic? Next week, I’m planning to dig into the actual data on grid investment across countries and see if I’m right.
post-image
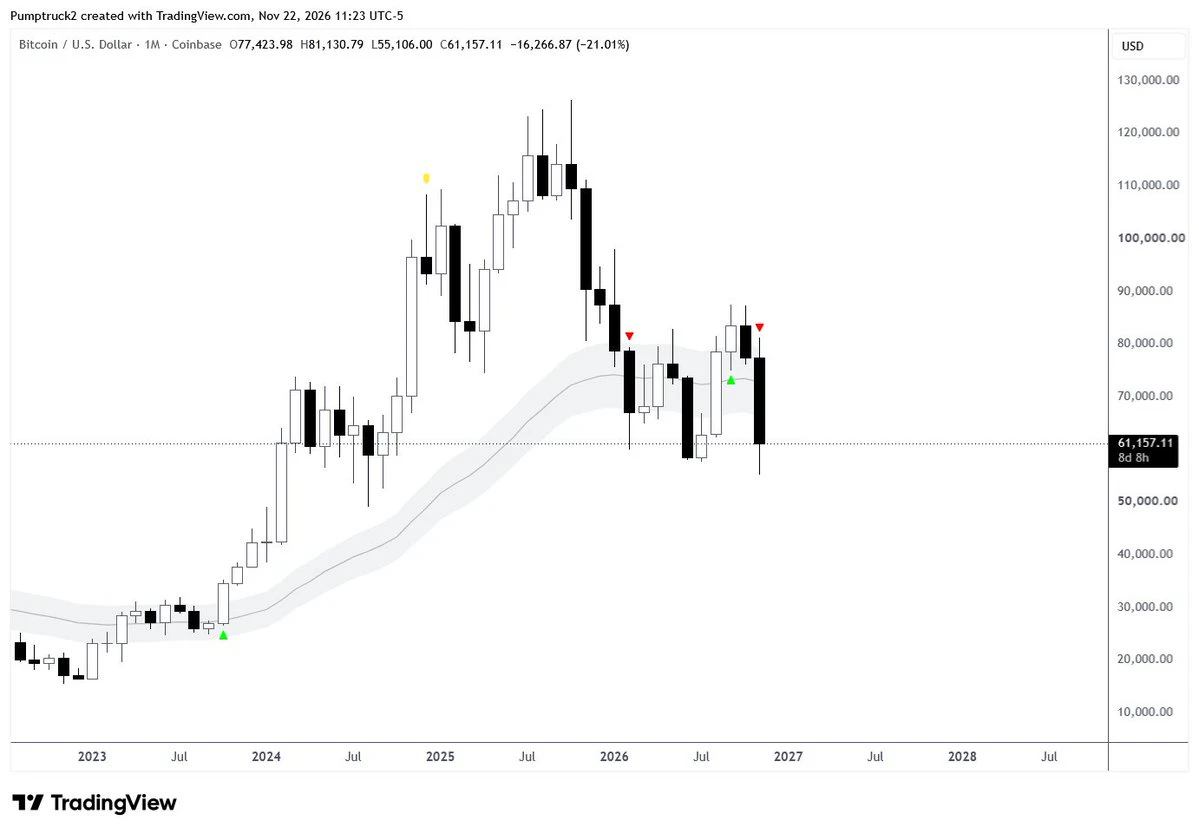
Imagine a monthly close above 66k
post-image
$ELSA A long opportunity has arrived; I'm getting ready to enter.

Entry price: 0.08557 Stop-loss level: 0.08000 First target: 0.09000 Second target: 0.09500
Over the past year, $ELSA has gained +25.52%, and its trend structure remains strong. A pullback is an opportunity to get in. The risk-reward ratio at this level is favorable, with a clear stop-loss and two upside targets.
Risk warning: The above is only a sharing of my personal trading ideas and does not constitute investment advice. Contract trading carries extremely high leverage risk, so please strictly manage your position size and
post-image
ELSA+5.82%
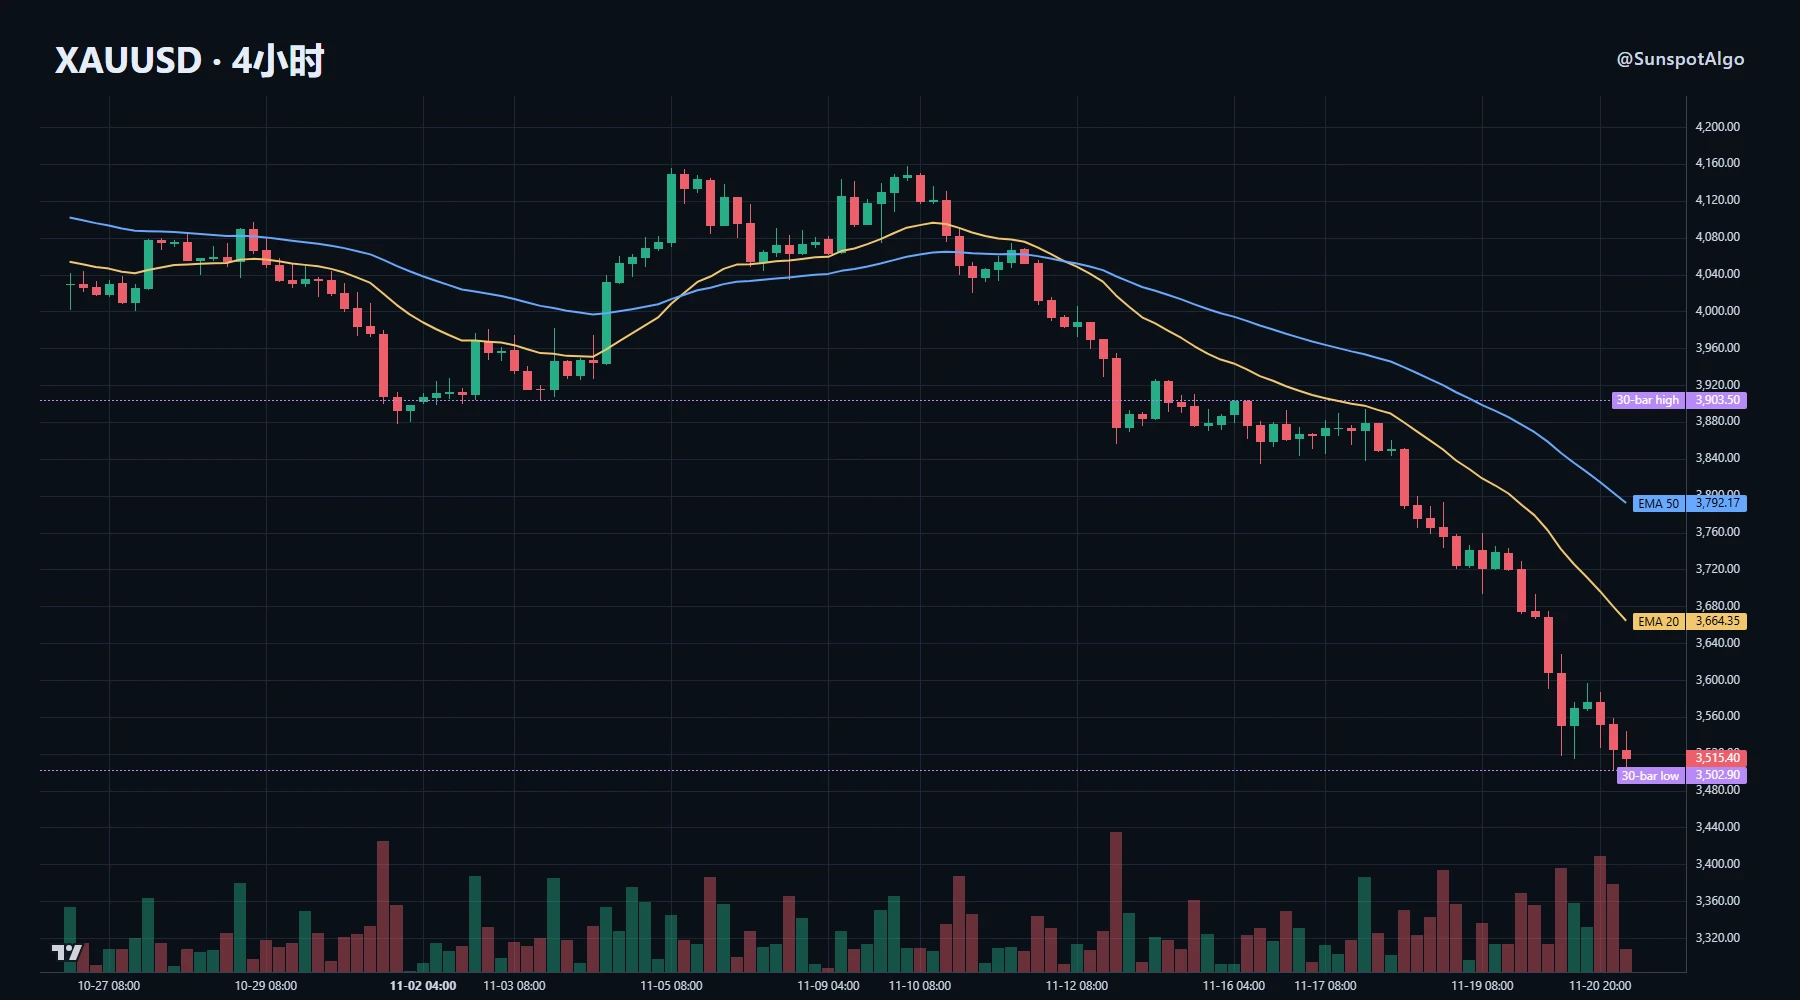
This week's action in gold can be divided into two phases, driven by completely different factors.

The first began in mid-November and was driven by interest rates. October inflation came in above expectations, the Fed turned sharply hawkish, and a December rate hike was almost fully priced in. The dollar strengthened and real yields rose, weighing on gold. This is a conventional macro-pricing response.

The second began after November 17, and the dynamics changed. The AI trade unwound, the Nasdaq fell more than 10% in a week, and the VIX surged to 35.89, up 26.2% in a single day. Liquidation
post-image
GLDX-0.40%
PAXG+0.37%
XAU+0.38%
NAS100-0.07%
XCU+0.20%
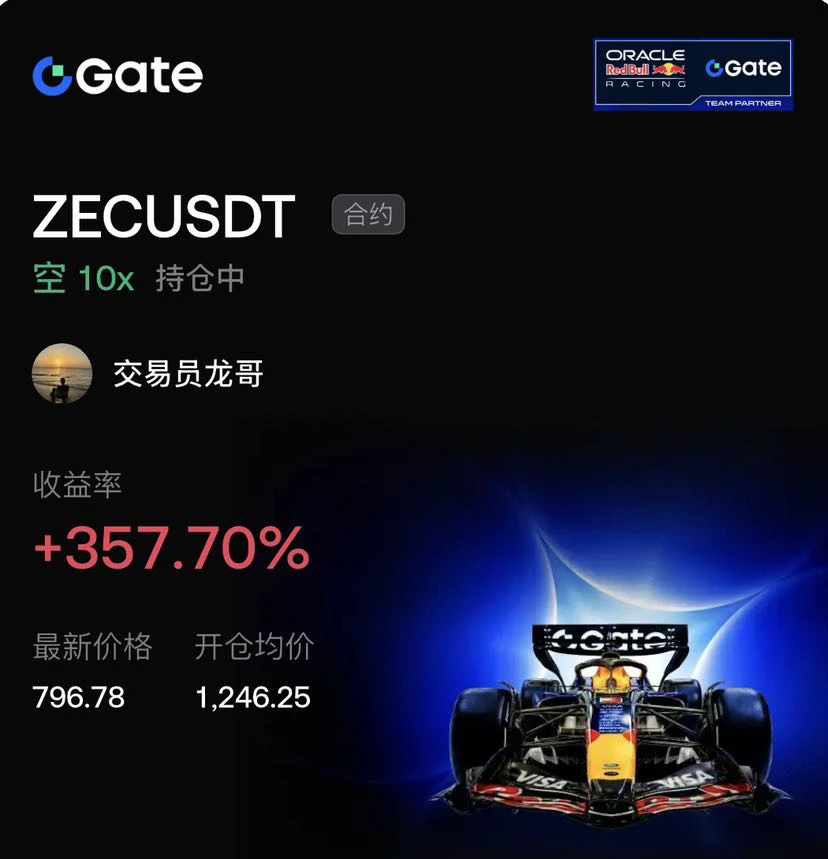
I was planning to hit the gym and lift weights tonight, but while casually checking the market, I saw $ZEC surge to 1246. Privacy coin bulls were way too aggressive, with a severe volume-price divergence. I canceled my plans, sat back down at my computer, and went heavily short with 10x leverage!

With 10x leverage, the margin for error is tiny. A wick along the way almost wiped me out instantly, but sticking to my rules and keeping my stop-loss at breakeven let me hold on and capture the full 357% gain.

ZEC has now plunged to around 796, and the daily chart clearly shows a bearish alignment
post-image
ZEC+1.29%
BTC-0.65%
SOL-0.74%
$NEAR Nears 3.06 Resistance; Holding Above After a Breakout Is Key
$NEAR is currently priced at 3.003, up 4.018% over the past 24 hours. The intraday high is 3.06, and the low is 2.832. The 1-hour chart shows strength: the price has broken above the 1-hour EMA20 at 2.9471, and RSI14 is 74.11, nearing overbought territory. The price has touched the 1-hour resistance at 3.06, but whether it can hold above this level and continue rising is key.
The 4-hour chart also shows strength, with the price slightly above the 4-hour EMA20 at 2.9695, though it remains well below the 4-hour resistance at 3.47
post-image
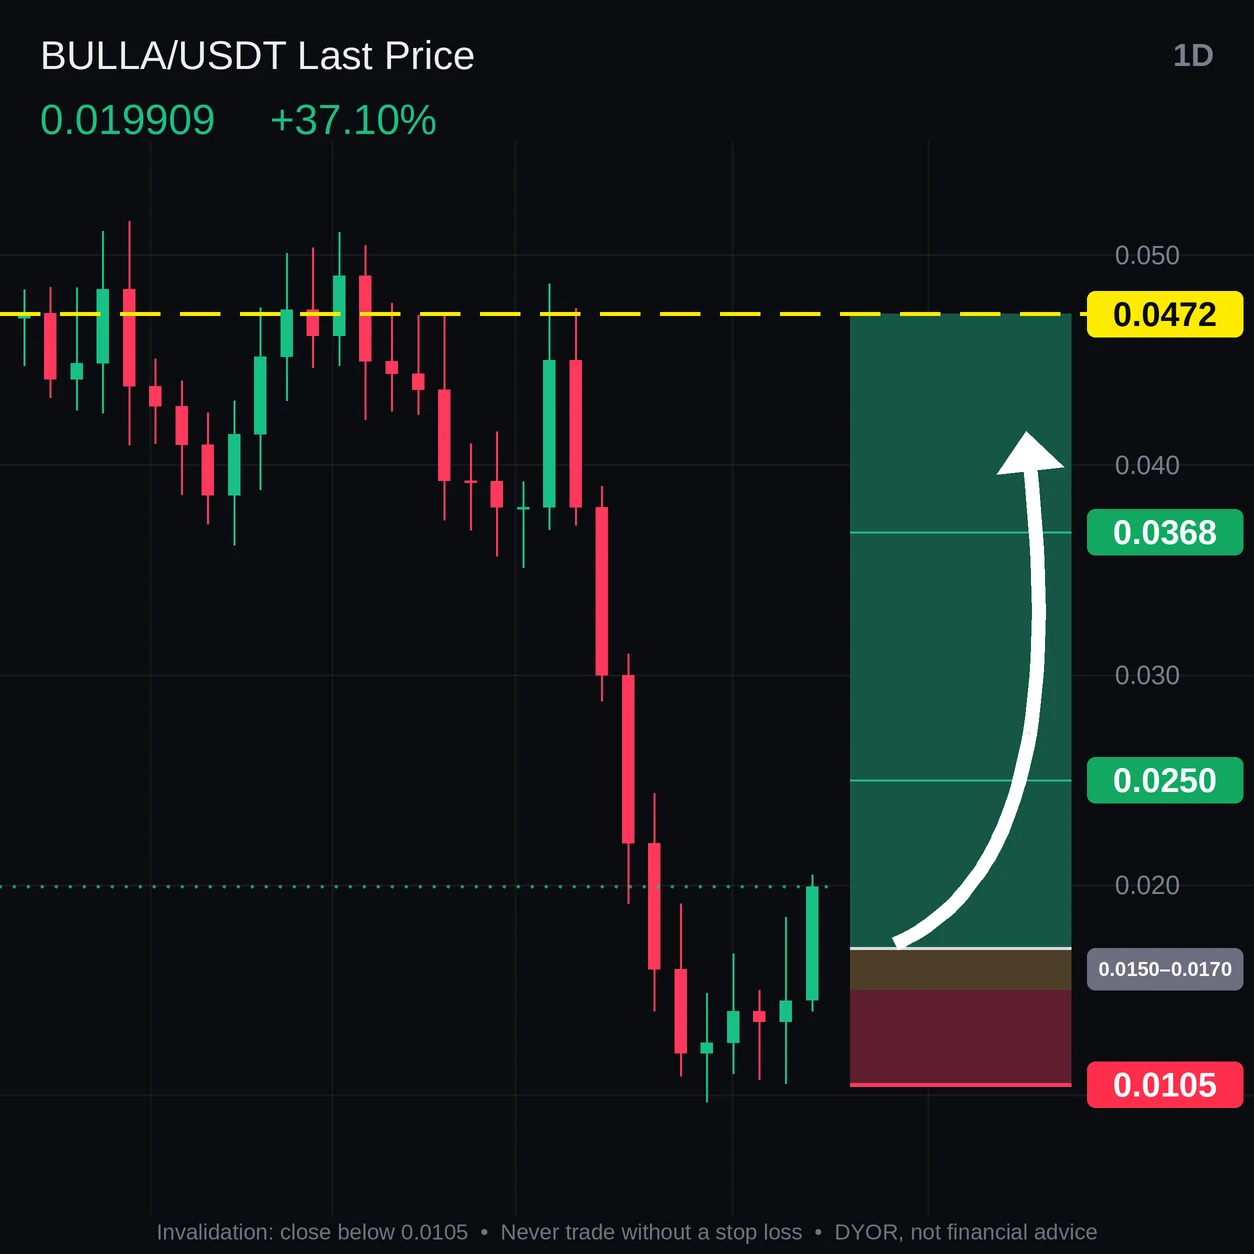
🟢 $BULLA /USDT LONG
$BULLA 🔥😎 ‌
Entry: $0.0150 – $0.0170
SL: $0.0105
TP1: $0.0250
TP2: $0.0368
TP3: $0.0472

A daily close above $0.0250 would make the long considerably stronger.
post-image
BULLA+10.92%
  • 1
I just opened a long position $IDOL
Entry: buy now from 0.01400 or 0.013500. First target: 0.015000. Second: 0.016000. Third: 0.017000. Final: 0.018000++. Stop loss below 0.012000
post-image
IDOL-6.71%
LIVE MARKET UPDATE MAAAL HI MAAAAL
live-cover
LIVE7,716
BTC-0.65%
SOL-0.74%
DOGE-0.18%
ZEC+1.29%
XAU+0.38%
Load More

Join 40 M users in our growing community

⚡️ Join 40 M users in the crypto craze discussion

💬 Engage with your favorite top creators

👍 See what interests you

Trending Topics

BTCReboundFaces60KTest

2.2M Views30.1K Discussing

BTC rebounded from around $55,300 on November 21, briefly reclaiming $60,000 before pulling back to around $59,300. The $60K level is back in focus as traders assess whether the recovery can last. Is this rebound a sign of stabilization or a short-lived recovery? Would reclaiming and holding $60K be enough, or do you need confirmation from trading volume and fund flows?

PCEAndGDPDataNextWeek

260.2K Views2.6K Discussing

GateDirectIPOPhase3ANTAllocates92100Shares

848.8K Views5.1K Discussing

View More