Square
Following
Hot
News
Notifications
Profile
Share your thoughts
placeholder
Article
$NVDA ‌#ShareWeekly #BTC #WCTCS9 #USCPIDataIncoming

U.S. Adds 165,000 Jobs in October: A Strong Labor Market Could Reshape the Federal Reserve’s Next Move

The U.S. labor market performed better than expected in October, adding 165,000 nonfarm jobs and far exceeding economists’ expectations. This unexpected strength sends an important signal about the world’s largest economy and could affect financial markets, Federal Reserve policy decisions, bond yields, the U.S. dollar, and sentiment toward cryptocurrencies.

However, the bigger question is not simply how many jobs were created. What mat
post-image
NVDA+2.80%
SHIB Donation Legacy Returns To Attention Following Vitalik Buterin’s Latest Comments
live-cover
LIVE1,100
Trenches
ZIG
Z
bade
b
ZIG
0x8c...1145
Market Cap
$.
Change
.
24h Vol
$.
Holders
.
STONK
S
bade
b
STONK
6GmA...UNgx
Market Cap
$.
Change
.
24h Vol
$.
Holders
.
IDOL
I
bade
b
IDOL
0x3b...ab07
Market Cap
$.
Change
.
24h Vol
$.
Holders
.
CLAUDIA
C
bade
b
CLAUDIA
2j5S...W2ZM
Market Cap
$.
Change
.
24h Vol
$.
Holders
.
MAGGIE
M
bade
b
MAGGIE
8rHo...PmZV
Market Cap
$.
Change
.
24h Vol
$.
Holders
.
$KOR Down 40 points every day. Even the gods would shake their heads—there's no saving it
post-image
There are only three types of entry points. Choose one to stick with for life.
No matter how sophisticated your technical analysis is, there are essentially only three types of entries. If you’re unclear about which one you use, you’ll keep wavering.
① Breakout entry (capture the start of a trend)
Enter immediately when price breaks through a key level on high volume.
Pros: Captures the biggest part of the move and makes it less likely you’ll miss out
Cons: Low win rate, many false breakouts, and stops are easily swept
Best for: One-way trending markets and assets with clear volume
Key point:
post-image
BTC-0.65%
Everyone in Web3
hopes to wake up every day with a fatter wallet and a swollen body!
It spreads easily and can easily break into the mainstream~ #涨醒
post-image
#Gate社交年度主播与创作者评选 🔥 Gate 2026 Social Streamer and Creator of the Year Awards are here!
Over the past year, you’ve turned your ideas into resonance through livestreaming and content creation, and content into connection.
Now it’s your time to shine!
📢 Who can participate: All streamers and content creators active on social platforms
🏆 Selection criteria: Content influence, community engagement, innovative expression, and industry contributions
✨ Major rewards: Exclusive recognition and certification, official traffic support, and global exposure opportunities
Whether you’ve focused on one fi
post-image
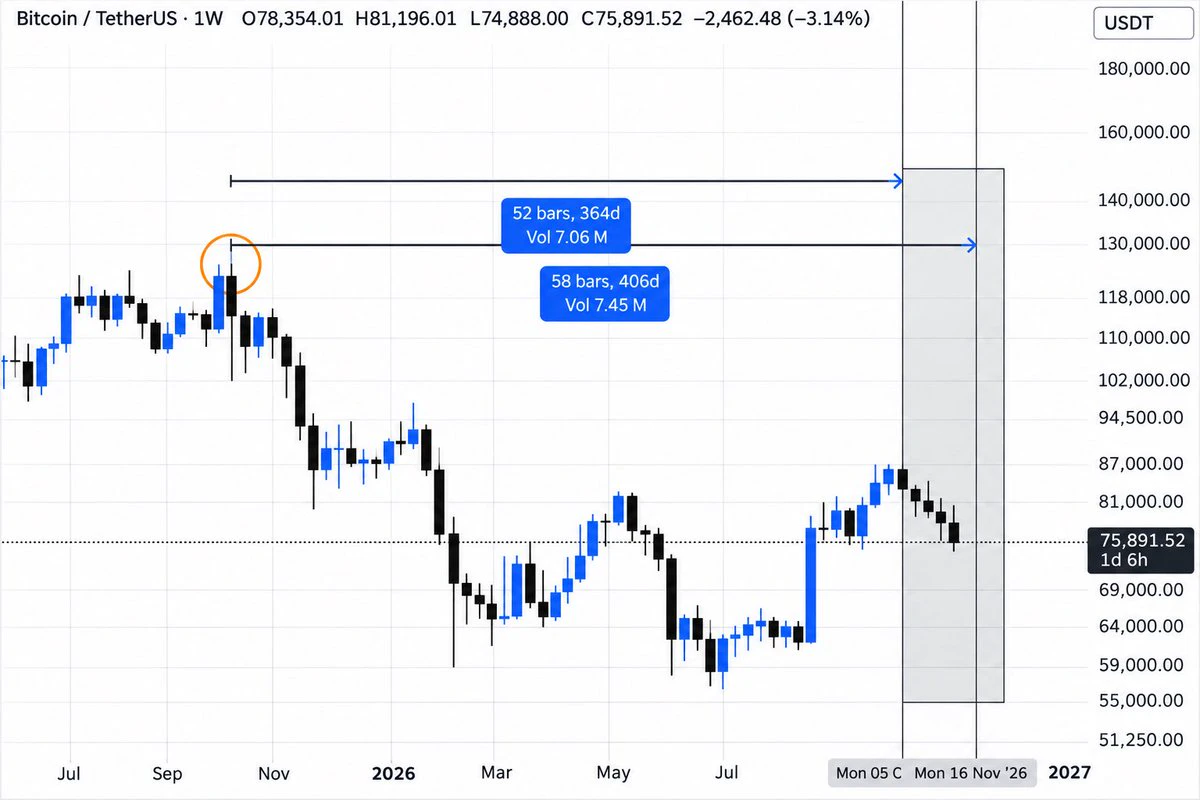
$BTC Cycle Bottom Watch
In the last 3 Bitcoin cycles, the bottom formed roughly 365–406 days after the cycle top.
If history repeats, $BTC could find its next major bottom between late November and December 2026.
The coming weeks could be crucial for Bitcoin’s next big move.
post-image
BTC-0.67%
  • 1
When Judging BTC’s Trend, Should You Look at the Daily or 4-Hour Chart?
In BTC trading, many people look at candlestick charts every day, yet often run into this problem: the daily chart seems to be rising, while the 4-hour chart has already started falling; the 4-hour chart shows a buy signal, while the daily chart is still in a downtrend.
Which timeframe should you trust?
Actually, the daily and 4-hour charts are not contradictory; they serve different purposes.
First, the daily chart is mainly used to determine the overall direction. It can help us see whether the market is in an uptrend, d
post-image
BTC-0.67%
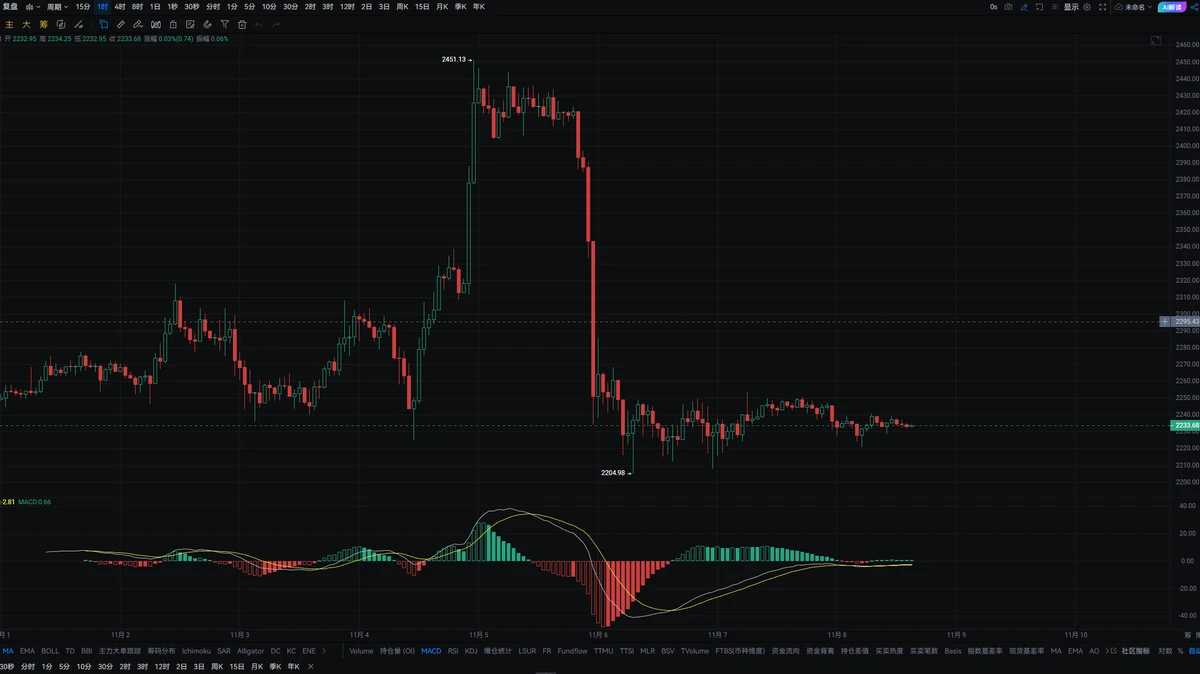
#ETH At the current price of 2235, the market is still weakening in lockstep with BTC, with virtually no independent buying. The first short-term resistance is around 2270, followed by the 2320 area, where supply was concentrated previously and which is also a key level for reversing the short-term weakness. A meaningful rebound will require BTC to stabilize and rally on increased volume.

The short-term support below is at 2210, with the key defense zone at 2180–2200. If this support zone is decisively broken, bears could open up more downside and test buying interest around 2150. In terms of
post-image
ETH-1.26%
BTC-0.67%
Hype on the weekly: a five-wave count, with $100 as the level where it has met rejection so far and $70 as the long-term support of the whole move. Mariano also covers the weekly RSI and the liquidation levels at $73, $64 and $47. At 10:29 in the video.
#Hype #Crypto #Altcoins #ElliottWave
HYPE+0.33%
💥💥 $ZEC has been getting attention after jumping 12% during the post election crypto rebound. Meanwhile, the October U.S. jobs report has added another reason to watch the market closely.

The U.S. added 165K jobs against expectations of around 65K, while unemployment dropped to 4.1%. This could keep pressure on expectations for Fed rate cuts. I'm watching $BTC, gold and the dollar closely.

#ShareWeekly
#USAIStocksHitHard
$ZEC ‌
post-image
ZEC+1.29%
  • 1
  • 1
🏆 Gate Square Content Mining | Top 20 Quality Content Engagement Rewards Revealed
The Top 20 Outstanding Creators leaderboard for October 26 – November 1 is now officially announced. Congratulations to all the creators who made the list!

💰 Post Quality Content to Earn Extra USDT Rewards
Publish high-quality original content, share valuable market insights, and actively engage with the community for a chance to receive extra USDT rewards from the platform.

🚀 Join Gate Square and Make Every Piece of Quality Content Valuable

📝 Post Now: https://www.gate.com/post
📋 Event Details: https://w
post-image
  • 4
  • 1
Last winter, I left 87 crypto groups. It wasn’t because I thought I was better than everyone else; those groups had wrecked me. Every morning, the first thing I did after opening my eyes was check the chats. If someone called a trade, I jumped in; if someone said to get out, I sold at a loss. My heart raced all day with every screenshot people posted, and in the end my account kept shrinking while my temper kept growing. Over those two years, I lost more than just money—I lost my ability to make sound judgments. The incident I remember most clearly was when someone in a group said at 2 a.m., “
post-image
BTC-0.65%
ETH-1.23%
$XRP , not $BTC or $ETH , had the most leveraged longs forced out on Nov 7, $6.5M worth. The recorded total of $53.0M across our tracked venues was far below the $339.6M seven day average.
XRP-1.12%
BTC-0.65%
ETH-1.23%
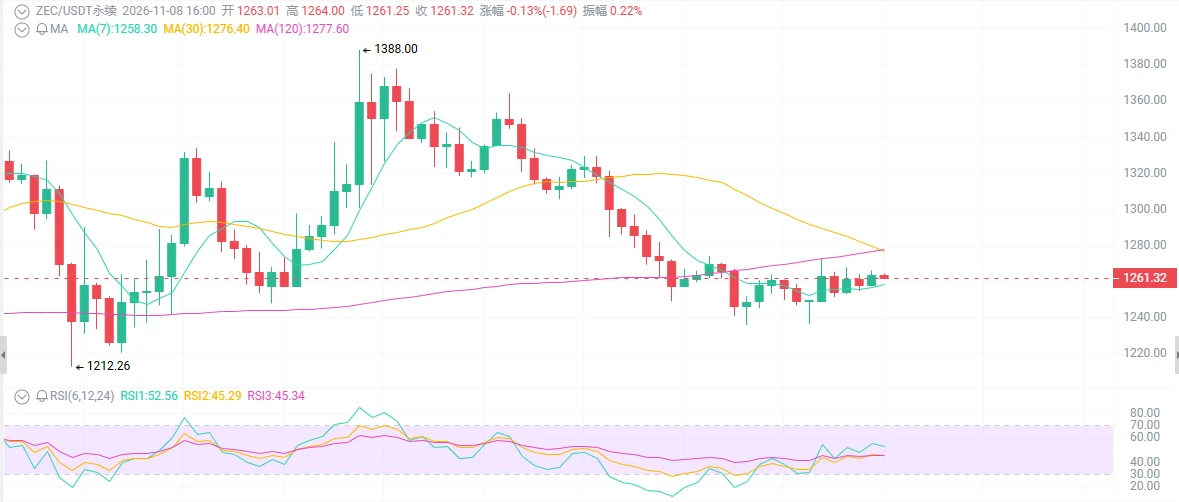
ZEC at $1,260: The upgrade succeeded, so why are you still losing money?
NU7 is live, block time has been cut from 75 seconds to 25 seconds, and 12,000 ZEC have been permanently locked—but all the bullish catalysts have already played out, and the price has still fallen from 1300 to 1260. Just now, it was down 4% in 24 hours, with $1 million in long liquidations. Is this a classic “buy the rumor, sell the news” shakeout, or has the upgrade’s upside simply not been priced in yet?

Start with the surface: the bullish news is out, but the price has fallen.

NU7 was officially activated on Novembe
post-image
BTC-0.67%
ETH-1.26%
ZEC+1.16%
(NEW STREAMER) BTC PREDICTION
live-cover
LIVE1,178
After going through the period from May to October, I’ve been cramming lately and studying A-shares in depth. I’ve started to get a tiny bit of a feel for how things work 😎
I used to think that if a company had good performance and a great financial report, it was safe to buy in. But after learning more, damn, there are so many frauds. You have to pore over every word of the financial reports.
I have to say, the listed companies in A-shares really have some deep tricks. As soon as the stock price hits a peak, major shareholders immediately announce personal share reductions, cashing out hundr
post-image
My friends are starting to worry about me. How could that be, guys?
Waiting for your replies~
post-image
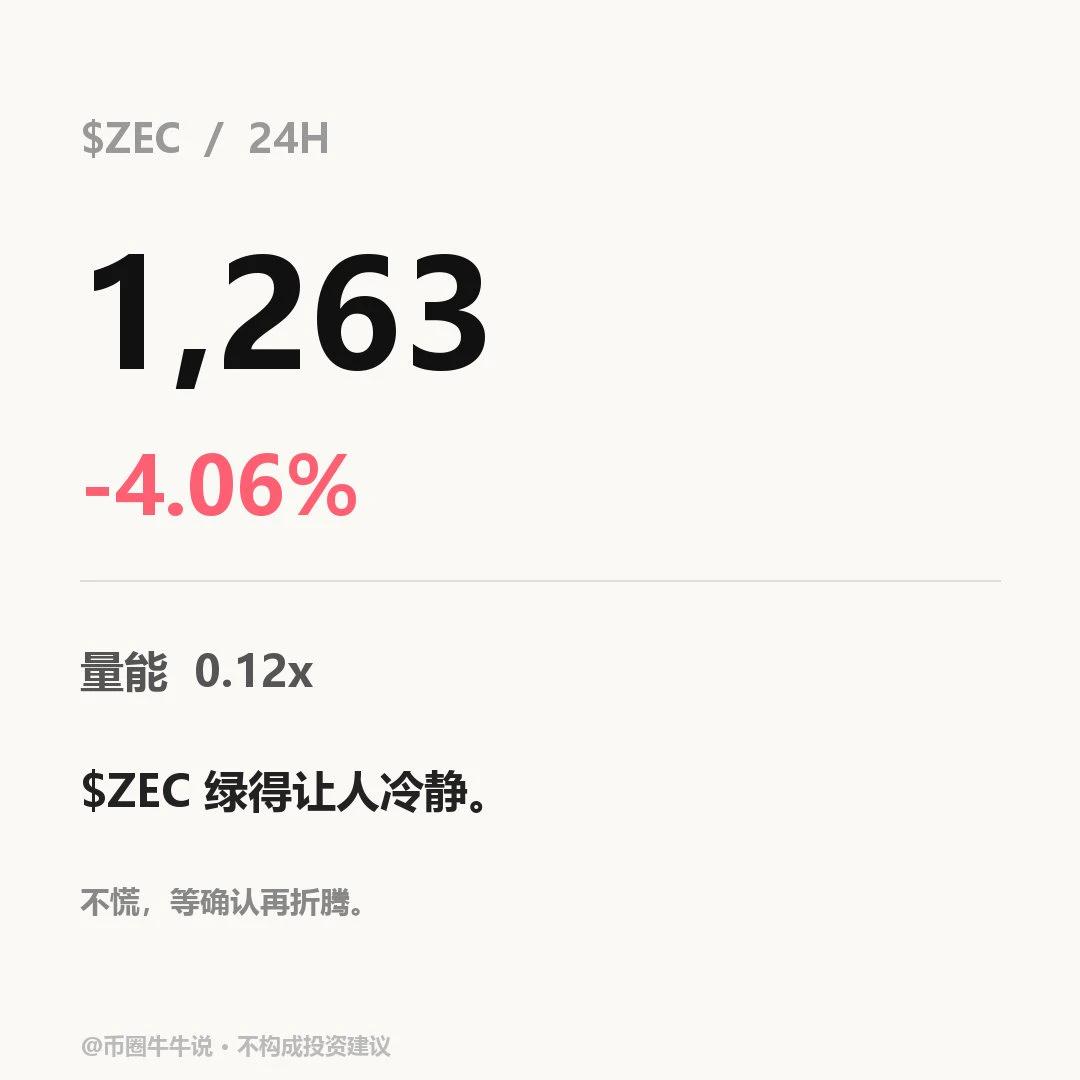
$ZEC Current price: 1262.94, 24H -4.06% (1235.00–1330.10). 1H is weak, with RSI at 48.88 and EMA20 at 1267.62; support at 1235.00 and resistance at 1330.1. 4H is weak, with RSI at 46.06 and EMA20 at 1280.68; support at 1213.56 and resistance at 1387.89. A sustained move above the 1330.1 resistance level would be meaningful; a break below the 1235.00 support level would signal further weakness. Review whether price holds above 1330.1 and recovers after losing 1235.00; the volume ratio is 0.12x, and the setup is invalid without confirmation from participation. The market is volatile; for observa
post-image
ZEC+1.16%
I'm almost done taking care of my own stuff and want to start streaming again, but it feels like there's no traffic support. Who should I reach out to? $BTC
post-image
BTC-0.65%
Load More

Join 40 M users in our growing community

⚡️ Join 40 M users in the crypto craze discussion

💬 Engage with your favorite top creators

👍 See what interests you

Trending Topics

USCPIDataIncoming

4.99k Views1.53k Discussing

The U.S. October CPI report will be released on November 10 at 8:30 a.m. ET. September CPI came in at 3.7% year over year, and markets will be watching closely for signs that inflation is cooling, especially in core CPI. A softer-than-expected reading could strengthen rate-cut expectations, while hotter inflation may pressure risk assets through higher Treasury yields and a stronger dollar. How do you think this CPI print will move $BTC, U.S. stocks and gold?

USAIStocksHitHard

25.32k Views3.71k Discussing

USNonfarmPayrolls

46.11k Views4.44k Discussing

View More