
Square
Following
Hot
News
Notifications
Profile
Share your thoughts
placeholder
Article
Bullish on red fruit, IQ has dropped; bullish on yellow fruit, sex drive has surged. The future of humanity is unimaginable 😅
post-image
"Holy shit Ansem just aped my token"
post-image
TOKEN-0.16%
Trenches
ZIG
Z
bade
b
ZIG
0x8c...1145
Market Cap
$.
Change
.
24h Vol
$.
Holders
.
BTC
B
bade
b
BTC
C5xp...pump
Market Cap
$.
Change
.
24h Vol
$.
Holders
.
GM
G
bade
b
GM
0x13...7777
Market Cap
$.
Change
.
24h Vol
$.
Holders
.
Diamond
D
bade
b
Diamond
5VCE...pump
Market Cap
$.
Change
.
24h Vol
$.
Holders
.
STONK
S
bade
b
STONK
6GmA...UNgx
Market Cap
$.
Change
.
24h Vol
$.
Holders
.
VLX Rewards Battle Begins! 450k Tokens Up for Grabs—Can Early Participants Really Earn More?

The 450k VLX rewards campaign is here, and Gate Launchpool has once again become a hot topic in the community.
Many people have started looking into how to participate, and some are already calculating how much VLX they could receive. However, I want to point out an easily overlooked detail: participating early doesn’t necessarily mean earning more rewards. Ultimately, the campaign rules determine the outcome.
If rewards are calculated based on the amount and duration of eligible staking, an individua
NVDA+2.80%
  • 11
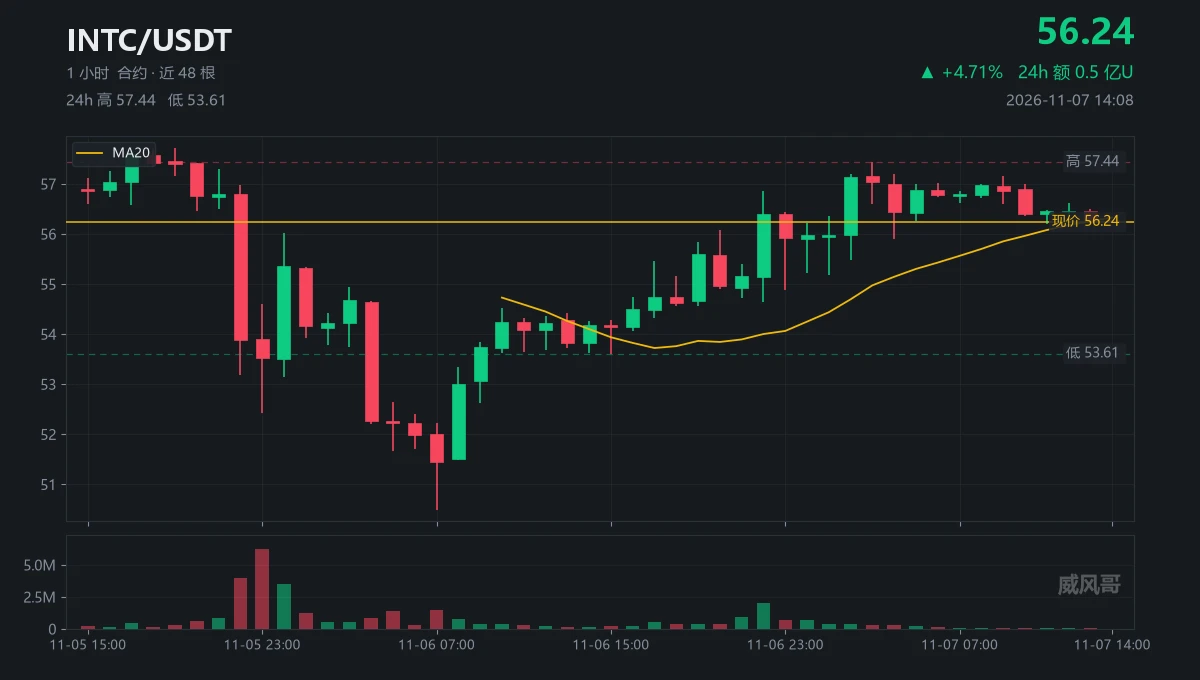
In trader jargon, it’s called a V-reversal—in plain terms, it fills the hole right back in.
From 50.49 to 57.44, up 13.8% in two days—the hole is filled.
57.44 The high was hit at 03:00; it hasn’t been touched again in the eleven hours since.
56.25 Current price, 2.1% below the high.
2,022,283 Volume on the 22:00 candle, 5.2 times the average; it was the only candle with any volume all day.
3,612 Volume at 14:00, 0.9% of average; the weekend order book has only this much left.
-0.0054% Funding rate; shorts are paying, but the pool is thin, so they’re not paying much.
56.33 MA20; price is stuck
post-image
INTC+0.05%
  • 1
#StockTalkSeason #ShareWeekly
NVIDIA (NVDA) Stock Analysis – Personal Research View
As of early November 2026, NVIDIA trades near $181–182. The stock closed around $181.60 on November 5 after a sharp ~9% decline, with the previous close near $200. The 52-week range sits roughly between $164 and $243.

Market capitalization is approximately $4.4 trillion. Volume spiked significantly on the sell-off day, reflecting heightened short-term volatility.​

This post shares my personal research-based observations on NVIDIA. It is not financial advice, not a price prediction, and not a recommendation
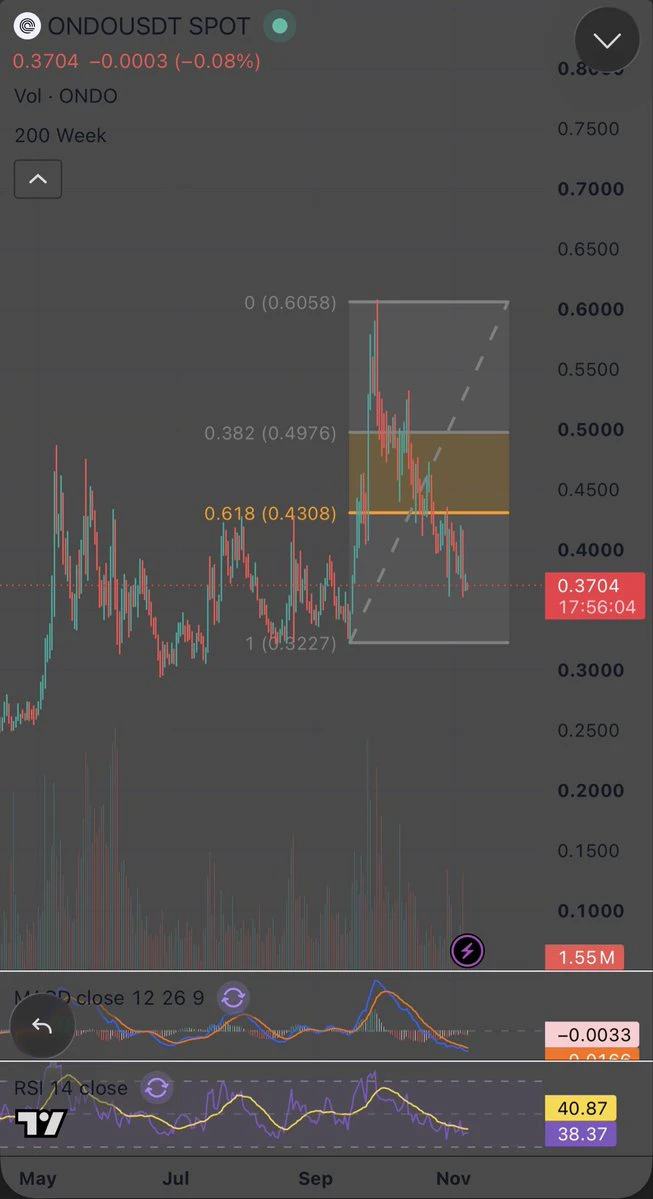
You bought $ONDO on the September breakout. Now you are watching it hand back most of the run.
Here is the math on how much.
The move went from 0.3227 to 0.6058. Price sits at 0.3704 today.
That is 83% of the rally retraced.
Most people are calling it a failed breakout. The chart is saying something more specific, and it comes down to three levels.
Resistance to reclaim:
0.4308
That is the 0.618 retracement, and it sits right on the ceiling of the range $ONDO held from June to September. Two tools agree on one price.
Until daily closes hold above it, every bounce is a lower high.
Support to de
post-image
ONDO-0.29%
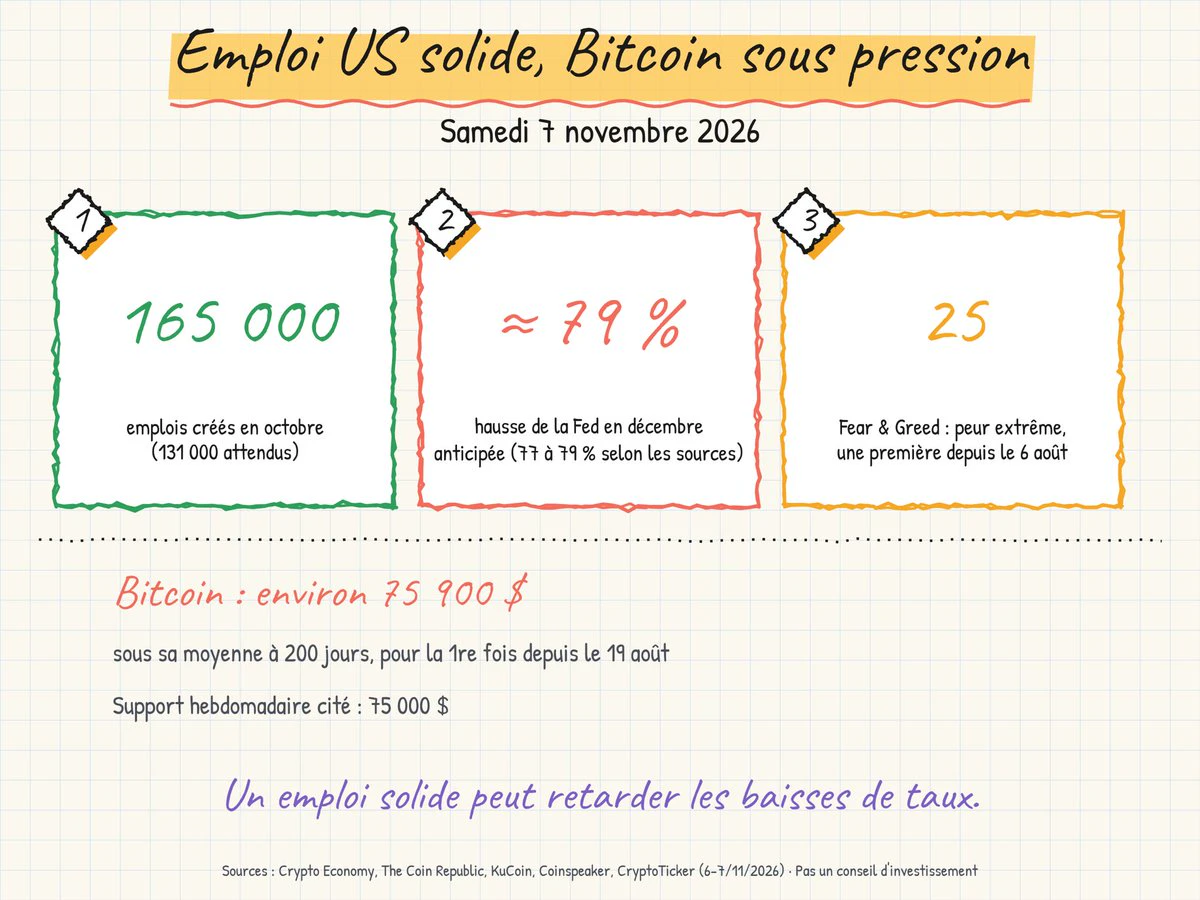
U.S. jobs: +165,000 in October, versus 131,000 expected.
→ December Fed rate hike: about 77% to 79% priced in
→ Bitcoin: about $75,900, below its 200-day moving average
→ Fear & Greed: 25, extreme fear
Good number, bad news for the market?
post-image
BTC-0.67%
When a trading strategy starts to fail, should you adjust its parameters or stop trading?

The real danger isn’t that a strategy loses money. It’s not knowing why it’s losing, yet continuing to tweak its parameters in an attempt to repair the returns curve.

A strategy may once have worked, but the market won’t behave the same way forever.

A trend may turn into a range, liquidity may decline, trading costs may rise, and entry signals that once worked may gradually lose their edge.

So how should you decide?

Step one: Determine whether you’re seeing a normal drawdown or a change in the strate
post-image
$AIN Up nearly half in a day, with a 46.75% gain and 24h trading volume of $139 million—this isn’t the kind of volume retail traders can generate. From a low of 0.0964 to a high of 0.1774, the 84% price swing is typical of accumulation followed by a shakeout. There are no signs of abnormal large on-chain transfers dumping tokens; this looks more like a short squeeze driven by derivatives.
There’s no new macro data catalyst; this is purely internal capital rotation within crypto. U.S. tech stocks are flat and the dollar hasn’t moved much, suggesting this rally isn’t macro-driven but a localized
AIN+3.35%
#原油# 86.86 was breached. Then it bounced back somewhat. Will it fall again? Sharing my view in image two. ​​​$CL ‌
CL-1.83%
🔹 High prices continue to erode purchasing power, and US consumer confidence remains weak.
live-cover
LIVE2,947
The Fed Won't Cut Rates in December? US Nonfarm Payrolls Suddenly Blow Past Expectations, Rate Hike Bets Heat Up Again!

Markets had been expecting the Fed to cut rates, but yesterday the US dropped an employment report that jolted traders out of their dreams.

Here are a few key figures:

📊 US October nonfarm payrolls:

* Actual: 165,000 jobs added
* Forecast: 65,000 jobs added

📊 Unemployment rate:

* Actual: 4.1%
* Previous: 4.2%

📊 Average hourly earnings, year over year:

* Actual: 3.1%
* Forecast: 2.9%

In short, the US labor market is stronger than expected, and unemployment is still
post-image
BTC-0.67%
ETH-1.26%
11.7 BTC Analysis

Over the weekend, the one-hour Bollinger Bands continued to contract. The earlier sharp drop formed a long lower wick, with clear buying support at the bottom, indicating a basing and recovery pattern after seller exhaustion. The rapid sell-off flushed out panic selling and stop-loss orders, fully correcting the oversold deviation. The price stabilized and rebounded off the lower Bollinger Band and is now consolidating near the middle band. Net inflows have recovered somewhat, while intermittent sell orders have struggled to exert sustained pressure on the market. Bulls have
post-image
BTC-0.67%
I actually think the real investment opportunities may only just be beginning!

While everyone is discussing the bursting of the AI bubble, I believe this plunge may be an important turning point in the reshuffling of the AI investment thesis.
On Thursday, the Nasdaq plunged 5.52%, Nvidia fell more than 9%, and AMD fell more than 17%. The market told investors in the most direct way possible: grand narratives alone are no longer enough.
But we also cannot dismiss AI's long-term value because of a single plunge.
Over the next few years, artificial intelligence may still transform industries suc
NAS100+1.90%
NVDA+2.80%
AMD+11.55%
  • 51
AI tech stocks plunge across the board, and BTC gets caught in the fallout! Has crypto been dragged down this time too?

The market has been a little too lively lately! AI tech stocks suddenly plunged, sending jitters through the tech sector, while the crypto market came under pressure too. We thought crypto could move independently, but it turns out that when traditional financial markets sneeze, crypto catches a cold too.
Why is this happening? When risk appetite declines, investors often reduce their exposure to high-volatility assets. Although AI tech stocks and cryptocurrencies belong to
AMD+11.55%
  • 41
A high win rate does not equal high profitability. What truly determines trading results is the ratio between each gain and loss.

Many trading strategies look excellent: an 80% win rate, multiple consecutive wins, and a very attractive backtest curve.

But if each win earns just $10 while a single loss costs $50, a problem emerges.

Suppose you make 100 trades:
• 80 wins, earning $10 each, for a total gain of $800.
• 20 losses, losing $50 each, for a total loss of $1,000.

Final result: a loss of $200, before fees, funding rates, and slippage.

This shows that win rate is only one part of a t
post-image
BtC Update
live-cover
LIVE1,787
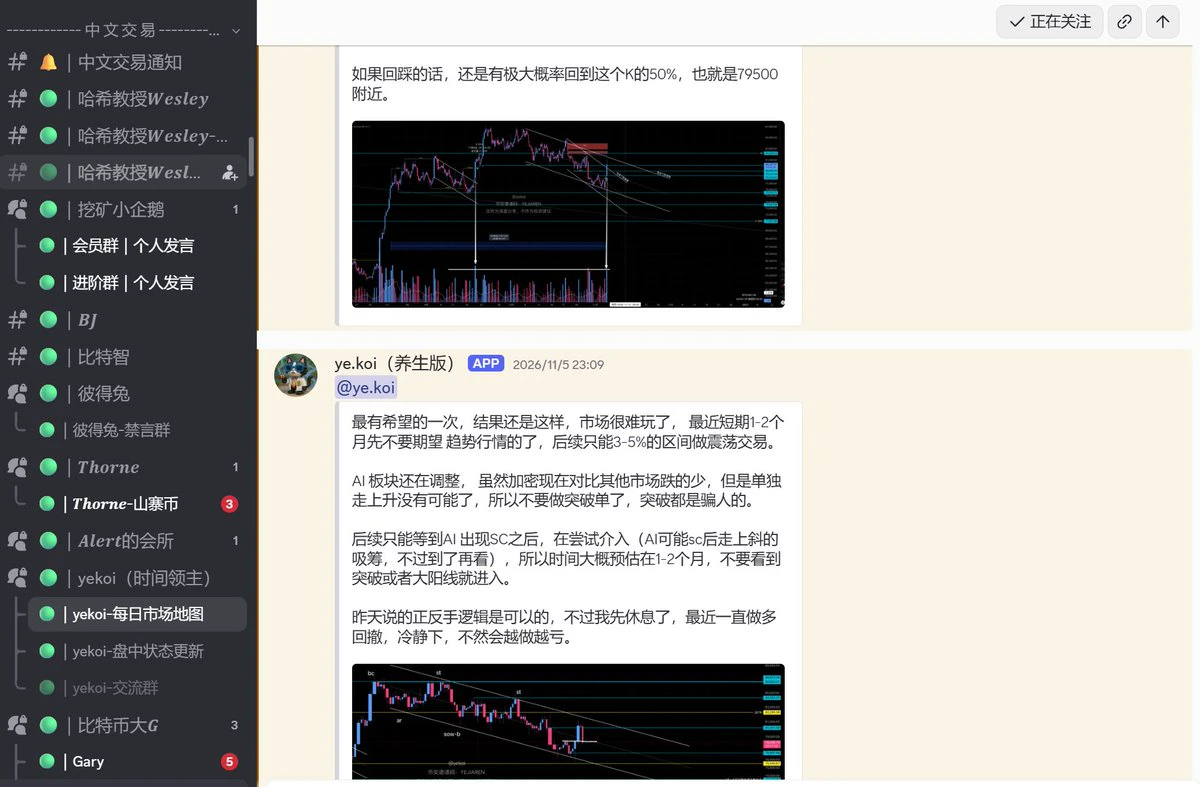
Automated, real-time reposting of group updates from 100+ bloggers, 24/7
Including: Yan Chi, Ao Ying, Bit Wisdom, Peter Rabbit, Crypto Cat, Ye.koi, Professor Wesley, Theophilus, Alert Club, Feng Xun, Below Zero Two, and others
Free trial available | Contact on TG:
post-image
Institutions fleeing? BTC ETFs saw $870 million in outflows in one week—should Bitcoin be worried this time?

Bitcoin has been having a rough time lately. It had been counting on Wall Street institutions to bring real money into the market, but instead, funds have kept flowing out. U.S. spot BTC ETFs saw nearly $870 million in cumulative net outflows this week, and institutional investors seem to have suddenly turned cautious.
What signal does this send? Are institutions starting to lose confidence in Bitcoin?
Don’t rush to declare a bear market. ETF outflows don’t mean all institutions are se
AMD+11.55%
Load More

Join 40 M users in our growing community

⚡️ Join 40 M users in the crypto craze discussion

💬 Engage with your favorite top creators

👍 See what interests you

Trending Topics

USAIStocksHitHard

15.28k Views3.64k Discussing

U.S. stocks sold off sharply on Thursday, November 5 (UTC). The Nasdaq closed down around 5.5%, entering correction territory, while the Philadelphia Semiconductor Index plunged roughly 12%, with chip stocks including $NVDA and $AMD posting steep losses. Beyond profit-taking, investors are growing concerned about the pace of AI data center construction, capital spending, and future returns on investment. The key question now is whether the AI sector’s lofty growth expectations need to be repriced. Where do you think the next opportunities will emerge: chip stocks, tech giants, or other sectors?

USNonfarmPayrolls

22.89k Views4.25k Discussing

StakeOnLaunchpoolToShare450KVLX

2.02k Views773 Discussing

View More