
Square
Following
Hot
News
Notifications
Profile
Share your thoughts
placeholder
Article
11.6 Market Trend Analysis

ETH Strategy Reference Setup
Rebound zone: short around 2250--2270
Stop loss: 2310
First target: 2200, second target: 2150

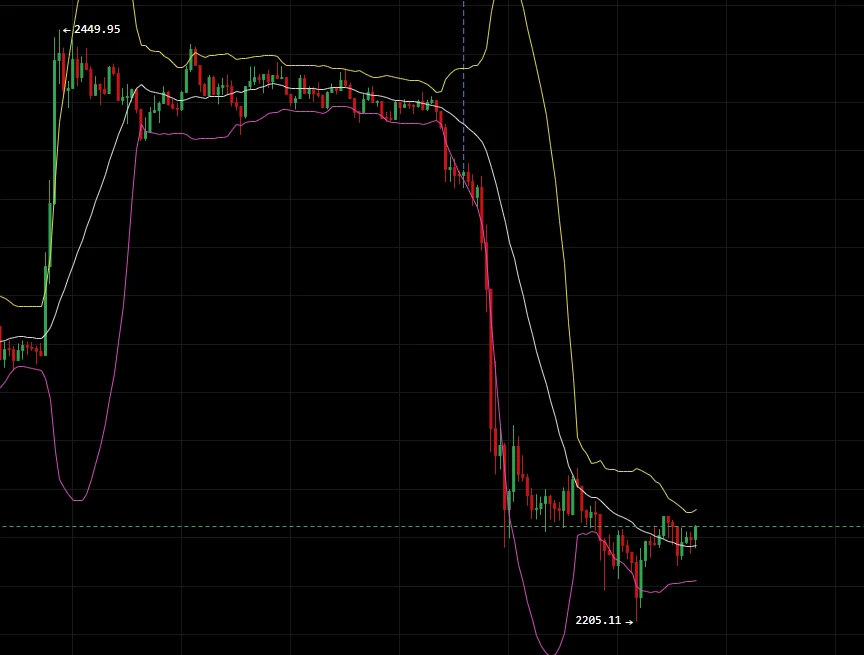
Dream of a surge shattered! A wave of heavy-volume selling directly reversed the short-term trend.

On the one-hour chart, after reaching a high of 2449.95, the market came under pressure and plunged. Heavy-volume long bearish candles successively broke through layers of key support, with the low reaching 2205.11 and the current price at 2238.32.
The previous bullish structure has been completely broken, with bearish selling pressure released i
post-image
BTC-0.65%
ETH-1.23%
AI can't do without Trump, and crypto can't do without Trump. Those who voted must be regretting it now, right?🥹#美股史诗级抛售 $BTC ‌
post-image
BTC-0.65%
Trenches
fxUSD
f
bade
b
fxUSD
0x08...d8f6
Market Cap
$.
Change
.
24h Vol
$.
Holders
.
ZIG
Z
bade
b
ZIG
0x8c...1145
Market Cap
$.
Change
.
24h Vol
$.
Holders
.
BTC
B
bade
b
BTC
C5xp...pump
Market Cap
$.
Change
.
24h Vol
$.
Holders
.
CORLA
C
bade
b
CORLA
0xba...7777
Market Cap
$.
Change
.
24h Vol
$.
Holders
.
STONK
S
bade
b
STONK
6GmA...UNgx
Market Cap
$.
Change
.
24h Vol
$.
Holders
.
How to Take Profits in a Bull Market: A Simple, Practical Strategy!

During a BTC rally, many traders face a difficult question: when should they sell? Sell too early, and they worry about missing further gains; sell too late, and they may watch their gains gradually disappear. Instead of trying to sell at the exact peak, it’s better to make a plan to take profits in stages in advance.

First, set profit targets ahead of time. Before entering a position, plan your profit-taking levels for different stages based on your entry price, risk tolerance, and market structure. Don’t wait until the pri
post-image
BTC-0.67%
#WCTCS9

"Our team is doing an amazing job, together we achieve the best victories. I invite you to join us, hurry up with Team No. 1 with the best trading volume, and we have more coming. Join us with Gate."
Farm airdrops in the bear market, do your research, and patiently wait for a good entry point for long-term investment.

This AGC project looks pretty decent. Mine, withdraw, and sell—the mining pool has been running for a long time and still hasn’t collapsed.

I only mine in the free pool, filling all the slots every day. Each slot costs 0.002 BNB. After 24 hours, you can withdraw the same amount of BNB plus tokens. In other words, you can get tokens for free. Every little bit counts. The prompt and instructions are posted in the replies.
post-image
BNB-0.76%
What Is Arbitrage Trading? Why Don’t Price Differences for the Same Crypto Asset Across Markets Necessarily Mean Risk-Free Profit?

In the cryptocurrency market, the same asset may have different quotes on different exchanges, and price gaps may also exist between spot and futures markets. Arbitrage trading seeks to profit from these differences, but in practice, fees, slippage, transfer delays, and market volatility can all erase seemingly certain profits.

First, what is arbitrage trading?

Arbitrage trading is a strategy that seeks to profit from price differences between different markets,
post-image
95.3% of liquidations were longs! The traders who chased longs above $60 on $SOXL are trapped—your principal is being “slowly tortured” by Wall Street!

Don’t use your hard-earned money to pay for a 3x-leveraged plunge. What you think is holding on is actually handing your head to the big players!

Market-wide liquidations totaled $21.94 million in 24 hours, with long liquidations reaching 95.3%! If you chased SOXL longs above $60, it’s now at $46.5, leaving you down over 22%. This isn’t a pullback; it’s a targeted slaughter by 3x leverage.

Why such a brutal drop? Three major risks hit at on
SOXL-1.16%
  • 8
  • 2
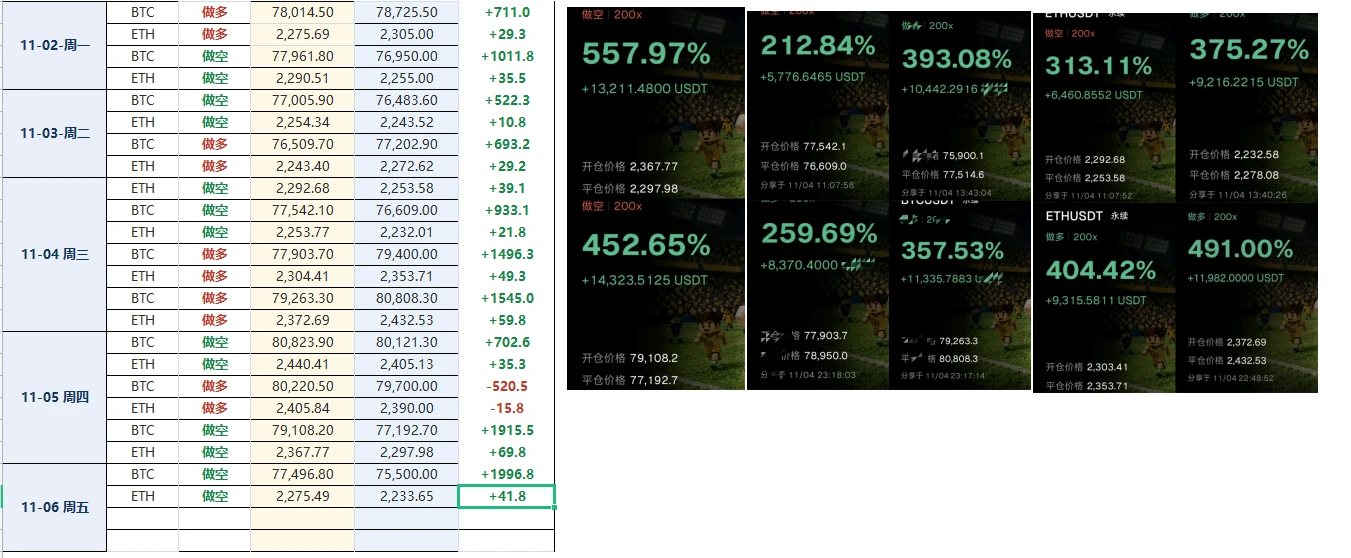
The results from the past few days speak for themselves: 23 trades, 21 wins and 2 losses.

Markets go up and down, and my read isn’t always spot-on. But what really sets traders apart isn’t getting every trade right—it’s holding on when they’re right and cutting losses quickly when they’re wrong.

Over the past few days, BTC and ETH have seen long and short positions switch back and forth, and I caught pretty much every opportunity worth taking. When a move didn’t go my way, I owned the mistake and moved on—no holding onto losing positions, no revenge trading, and certainly no reckless entries
post-image
BTC-0.65%
ETH-1.23%
$AKE Short with a small position, target zero
AKE+6.07%
BTC Reclaims $80k, but Tech Earnings Could Pour Cold Water on the Rally! What Big News Is the Market Waiting For?

Bitcoin has climbed back above $80k, and market sentiment seems to have come back to life. But don’t forget that another major event is unfolding in macro markets: corporate earnings and guidance.
If tech giants report strong earnings, confidence in corporate profits and economic resilience could be boosted, and risk assets may also benefit. Conversely, if guidance falls short of expectations, investors may quickly reduce their risk exposure.
BTC has its own ecosystem dynamics, bu
BTC-0.67%
  • 1
$MUU Over 24 hours, it got cut in half, then halved again. That huge -23.22% candle left everyone who chased the rally buried at the 18.68 peak. The current price is 14.12, after plunging as low as 12.22, with the 312M in trading volume made up entirely of battered tokens changing hands.
First, let’s look at the hot narrative and its correlation. BTC is moving sideways around a key level today, while rate-cut expectations on the Fed side keep swinging back and forth. Big money is sitting on the sidelines, and liquidity is draining from the altcoin market. For a highly volatile asset like $MUU,
MUU-35.00%
BTC-0.67%
  • 11
  • 2
How to Identify a Fake Breakout? Avoid Getting Caught in a Bull Trap!

In BTC trading, one of the market moves most likely to fool traders is a fake breakout. The price suddenly breaks through an important resistance level, and when many people see the candlesticks surge quickly, they think a new rally has begun and rush to go long. However, the price soon falls back into its previous range, leaving traders who bought at the top on the back foot.

So, how can you identify a fake breakout?

First, check whether trading volume confirms it. A genuine, strong breakout usually needs volume support.
post-image
BTC-0.67%
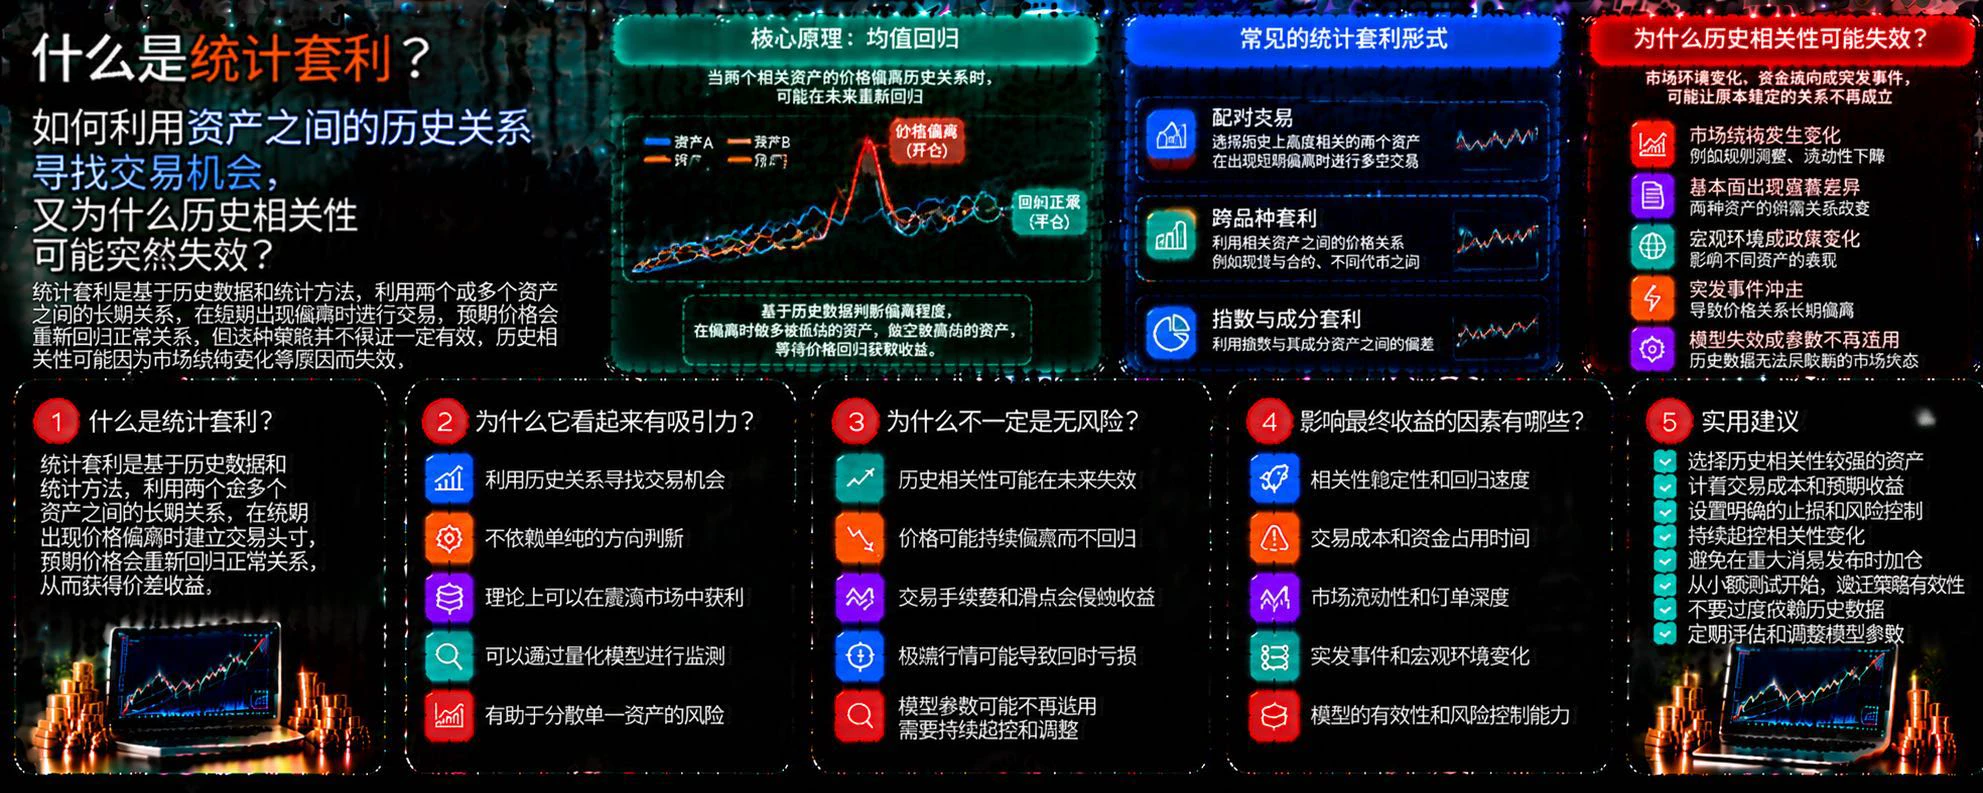
What Is Statistical Arbitrage? How Can Historical Relationships Between Assets Reveal Trading Opportunities, and Why Might Historical Correlations Suddenly Break Down?

In cryptocurrency markets, some assets have long shown similar price movements. When their historical relationship temporarily diverges, traders may try to exploit the deviation. This is the basic idea behind statistical arbitrage, but historical patterns are no guarantee of future repetition.

First, what is statistical arbitrage?

Statistical arbitrage is a type of trading strategy that uses historical data, statistical model
post-image
Gold has formed an upward structure. How much farther can this rebound go?🔹 BTC is approaching $82,
live-cover
LIVE1,062
【Yunxiang Research Institute · Guanlan | Nov. 6 Intraday A-Share Market Commentary】
Major indexes weakened in tandem, with the Shanghai Composite testing the 3,600 support level.
Shanghai Composite 3633.79 (-1.52%), ChiNext Index -3.57%; 229 advancers and 2109 decliners, a decline-to-advance ratio of approximately 9.2:1, indicating a marked contraction in risk appetite.
Shanghai Composite: 3600–3610 is the first support zone. A close below this range on higher volume would put 3574 in focus as the next area to watch. 3680–3700 is resistance on a rebound; a return above this range would signal
post-image
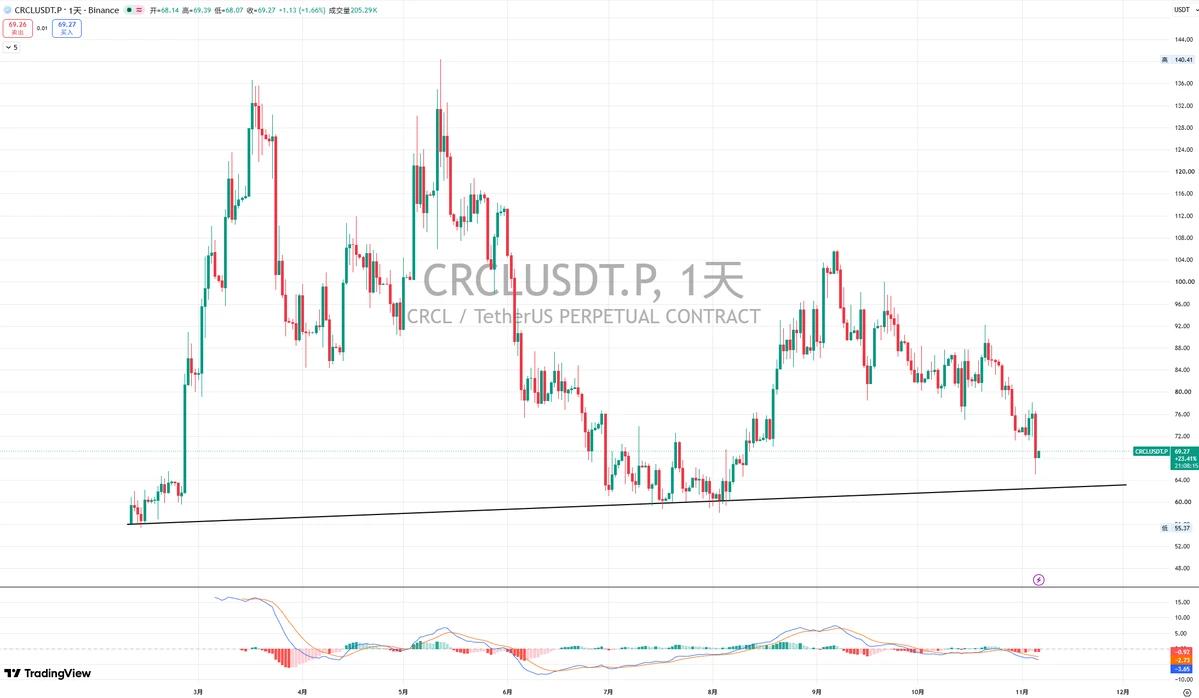
$CRCL
CRCL, the parent company of the USDC stablecoin
After following this wave of declines, it has finally reached the ideal entry range of 68–65 that I mentioned in October! The short-term low was 64.8. I’m not sure whether it will fall further, but this is a great buying range!
Enter a long-term position and be prepared to hold it for the long term!
post-image
CRCL-8.69%
🔹Why Did U.S. Stocks Suddenly Plunge at the Open? Sell Orders Flood In While Buyers Struggle to Kee
live-cover
LIVE2,718
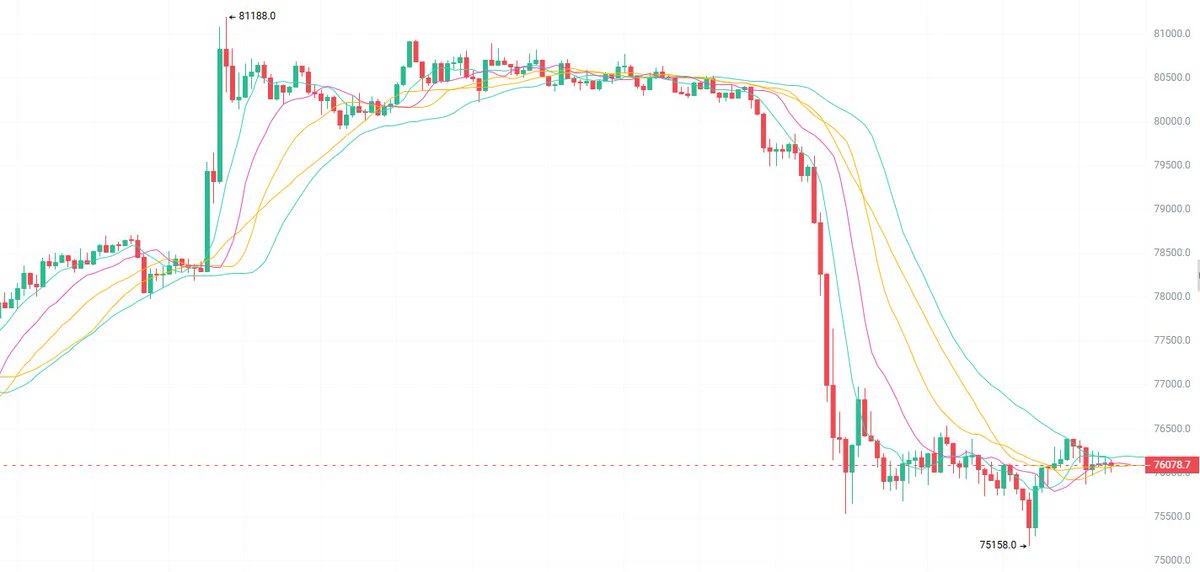
On Nov 5, BTC faced resistance on a rebound near 76,500. Consider opening a small short position, with targets at 75,500/75,000.
Those looking to go long should wait for the price to stabilize near 75,200 before entering. Set a stop at 74,800, with targets at 76,000/76,500.
On the 1-hour chart, the price plunged from a high of 81,188, with a wick down to 75,158, then consolidated and recovered at the lows.
The moving averages are diverging bearishly, and the rebound is weak. 76,500/77,000 are short-term resistance levels, so bears still have the upper hand for now. $BTC #BTC
post-image
BTC-0.67%
What Is Breakout Trading? How Can You Tell Whether a Price Breakout of a Key Level Is Likely to Continue the Trend Rather Than Turn Into a False Breakout?

In the cryptocurrency market, when prices break above an important resistance level or fall below a key support level, they often attract the attention of many traders. Some choose to enter in the direction of the move, hoping to catch the start of a new trend; others suffer losses from chasing rallies and selling into drops during false breakouts. What really matters is not whether the price crosses a line, but whether the market provides
post-image
Load More

Join 40 M users in our growing community

⚡️ Join 40 M users in the crypto craze discussion

💬 Engage with your favorite top creators

👍 See what interests you

Trending Topics

USStocksFaceHistoricSelloff

586 Views3.47k Discussing

U.S. stocks suffered a sharp selloff on Thursday, with the Nasdaq closing down more than 5% and the Philadelphia Semiconductor Index falling over 12%. AI and chip stocks including $NVDA and $AMD were hit especially hard. Markets are reassessing AI valuations, data-center spending and future returns. Is this just short-term deleveraging, or the start of a deeper correction in the AI trade? Which sectors are you watching next?

GateLaunchesPoSECProofOfSecurity

11.51k Views568 Discussing

USNonfarmPayrolls

8.95k Views3.98k Discussing

View More