Share your thoughts
placeholder
Article
Insiders are watching SYMBOL break a hidden range right now.

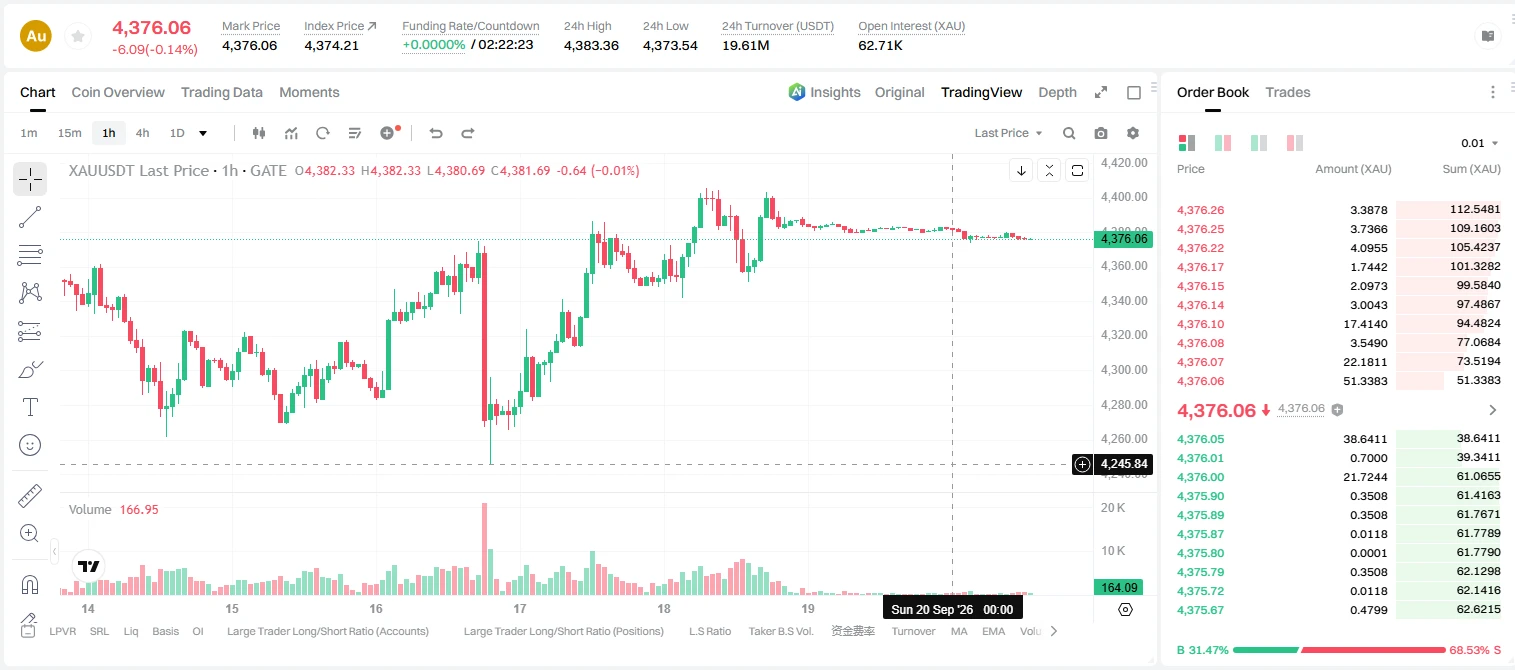
$XAU /USDT - SHORT

Trade Plan:
Entry: 4375.43 – 4376.69
SL: 4382.12
TP1: 4371.51
TP2: 4368.48
TP3: 4363.93

Why this setup?
Why now? The daily trend is range-bound, but the 1h price just printed at 4376.06, which sits inside a tight entry zone between 4375.43 and 4376.69. The 15m RSI reading of 42.23 shows sellers are still in control without being overextended, and the 1h ATR of 2.526716 confirms that the recent volatility is compressed enough for a sharp move. The plan targets TP1 at 4371.51 and TP2 at 4368.48, with the invali
post-image
XAU-0.13%
UPDATE: ETHENA $ENA ECOSYSTEM
Ecosystem: @ethena continues to show consistent growth.
$USDe now has a $4.84B supply, up nearly $800M from around $4.1B over the past few weeks.
On the institutional side: Janus Henderson, with $480B in AUM, has also made a strategic investment in $ENA and plans to use $USDe for its treasury, while exploring the distribution of $USDe to its clients.
What is interesting about these metrics:
$USDe $4.84B has risen to $7.5B
If USDe reaches $7.5B, the buyback mechanism $ENA will begin operating.
So, besides looking at the price of $ENA ?
The growth in $USDe
ENA-1.54%
USDE+0.01%
crypto market update and signals capture
live-cover
LIVE2,104
I had already finished complaining to my friends about this week’s market, but now I have to take it all back. A little awkward.
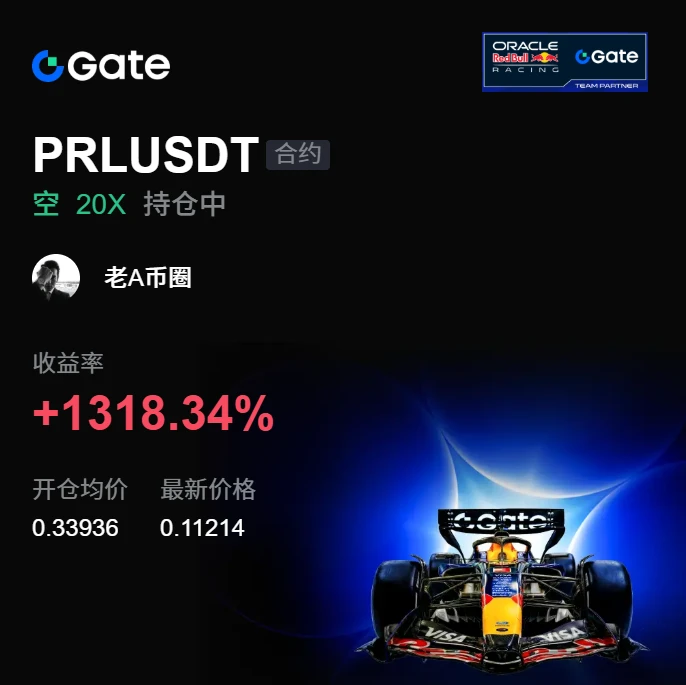
A few days ago in the afternoon, $PRL ’s rebound lacked follow-through, the bounce was weak, and layer after layer of resistance was overhead. I warned people not to get carried away—if there’s no one to take the price higher, any move up is just an opportunity to short. After turning bullish, the price was pressed from 0.33936 down to 0.11214, locking in +1318.34%; it was truly sluggish at first, but the outcome was genuinely satisfying.
First close 80% and take the
post-image
PRL-4.90%
BNB-2.42%
ZEC-6.09%
To be honest, I’m surprised this trade has survived until now; luck played a big part. During a market bounce in the early hours a few days ago, resistance above $JCT was obvious and volume failed to follow. I figured no one would take the offer on the way up, so I flagged the short idea at 0.002429.
It then gave the answer, dropping all the way from 0.002429 to 0.001567, with returns of +870.22%. That was a satisfying chunk of profit.
Market moves come from waiting, and profits come from holding. Don’t get inflated by gains, and don’t despair over drawdowns.
I’ve closed 80% first, and will u
post-image
JCT-7.33%
ETH-2.35%
DOGE-4.76%
#美股AI概念股全线反弹
#Gate广场中秋团圆局
US AI Stocks Rebounded Across the Board: The Start of a New Leg Higher or Just a Short-Term Bounce?
Thursday, September 17, 2026 was the session that reset the mood on Wall Street. The Dow Jones Industrial Average added 316.14 points, equal to 0.61%, to close at 51,778.04. The S&P 500 rose 1.14% to 7,637.76. The Nasdaq Composite jumped 1.69% to 26,418.30, its strongest single-day advance of the month. All three major indexes closed higher together, and the leadership came from artificial intelligence rather than defensive sectors. Friday added a quieter follow-throu
post-image
$SOL Record Activity, Yet SOL Faces Selling Pressure
Solana reportedly processed 5.2B non-vote transactions in August, up 19% from July’s record. Yet $SOL fell 3.5% to $108.04.
The key distinction: more transactions don’t guarantee stronger token demand. Memecoin activity can drive volume, but lasting value depends on sustainable users, fee generation, and real economic activity.
ZetaChain’s proposed migration could bring new activity, but its impact depends on approval and execution.
Can Solana convert record usage into durable demand for $SOL ?
#Solana #SOL #crypto,
post-image
SOL-3.18%
MSTR’s “capital flywheel” is spinning again, but it has one fatal prerequisite
The most impressive thing about Strategy is that it invented a capital flywheel that is extremely difficult for others to replicate. Let’s break down how this flywheel works.
The basic operating logic is as follows: the company raises funds by issuing stock or convertible bonds, uses the money to buy BTC, and as its BTC holdings increase, the company’s net asset value rises. Market expectations improve, the share price goes up, and the company then issues more stock to raise funds and continue buying BTC—repeating t
MSTR+16.35%
🚀 ZEC Surges as Market Interest Heats Up
👉 Register Now:
https://www.gate.com/campaigns/event/6315?ref=HARRYPAK&ref_type=132
Trade $ZEC to Share 50,000 $USDT and Win Up to 240 $USDT!
🎟 First Trade: First Trade to Get 5 $USDT
🗓 Daily Check-in: Trade Daily to Earn 5 $USDT, Win Up to 35 $USDT
🏆 Trading Challenge: Share 30,000 $USDT Pool, Win Up to 200 $USDT
$ZEC #Gate #Futures
post-image
ZEC-6.09%
  • 5
BULLISH: Michael Saylor hints at another Bitcoin purchase as Strategy continues to outperform.
Saylor just shared his orange Bitcoin chart, once again fueling speculation that Strategy could add more $BTC to its holdings.
Strategy was the top-performing stock in the Nasdaq-100 last month, gaining 48%, and is up another 16% today around $153.
The company already holds 845,050 BTC, worth roughly $68.69 billion at the stated valuation. That represents more than 4% of Bitcoin’s eventual 21 million supply.
The key question now: is Saylor simply sharing the chart, or is another Bitcoin purchase com
BTC-1.09%
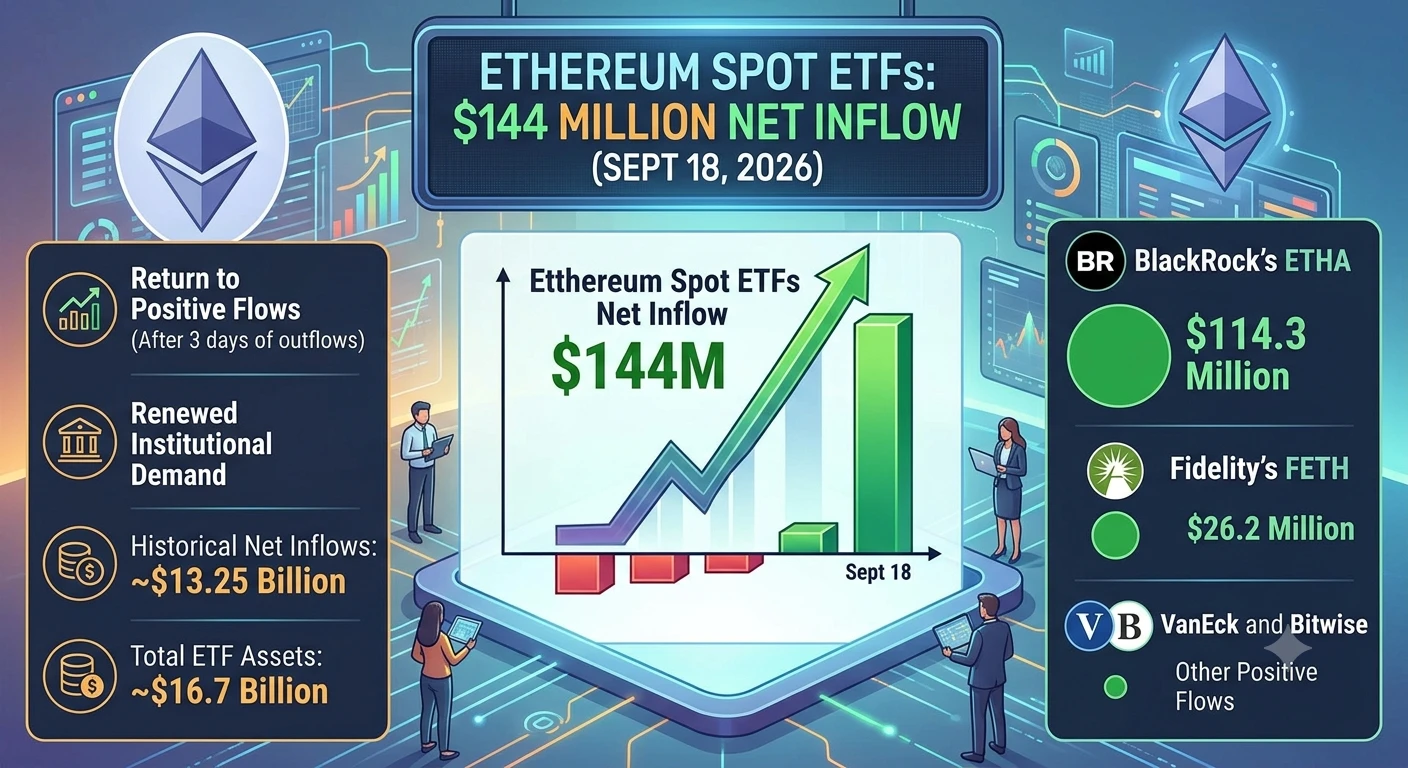
#EthereumSpotETFsSee144MNetInflow Ethereum Spot ETFs See $144M Net Inflow
U.S. spot Ethereum ETFs recorded approximately $144 million in net inflows on September 18, 2026, marking a return to positive flows after three consecutive sessions of net outflows.
BlackRock’s ETHA led the inflows with around $114.3 million, while Fidelity’s FETH added approximately $26.2 million. Other positive flows came from VanEck and Bitwise.
The data shows renewed institutional demand for regulated Ethereum exposure. However, a single day of inflows does not by itself establish a longer-term trend, especially a
post-image
ETH+7.79%
This $TAO long position has made it this far; the key was not guessing the direction, but waiting for confirmation of the pullback above 231.4. I didn’t chase when the price first surged to 252.6. I waited for it to pull back without breaking the short-term moving average, then added to the position as planned. Current unrealized profit: +441.52%.

Structurally, the moving averages are beginning to fan upward, but what really matters is that the key level at the previous high has not been fully cleared. As long as the price remains above the key pullback level, the bullish structure is intac
post-image
TAO-6.96%
LAB-2.03%
ADA-3.29%
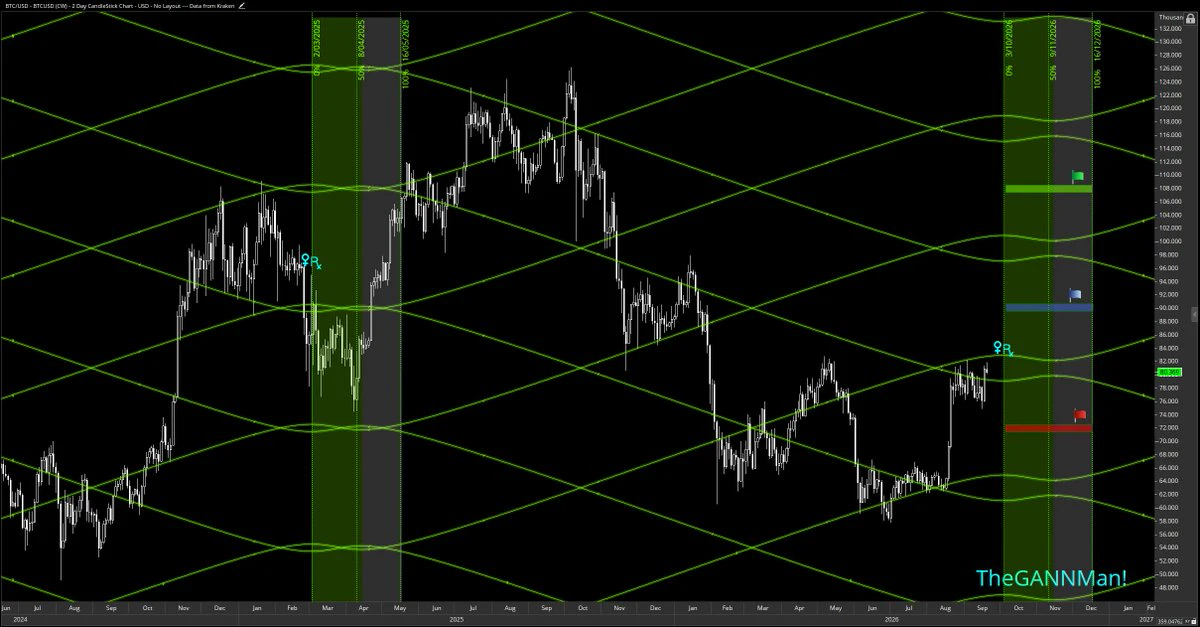
~ #BTC #GANN ~
3/10/26 Venus will be Retrograde (RX).
3 Targets provided, one more bullish than the other. Volume will determine the ultimate price.
GN Folks! 🔥🔥🔥
post-image
BTC-1.09%
  • 2
The match hasn’t even started, but you’ve already written three scripts in your head? 🤪
Favoring the home team to win this one and expecting lots of goals in the next...
Now you can combine these predictions into a single bet. Try out your analysis skills with Gate Combo~
Select two matches to create a 2-leg parlay. You can keep combining more matches if you like; freely mix and match match winner, handicap, over/under, and exact score markets where supported. Add or remove selections, and the combo odds and potential payout will update simultaneously
📍APP Home → Golden Dog → Event Markets →
post-image
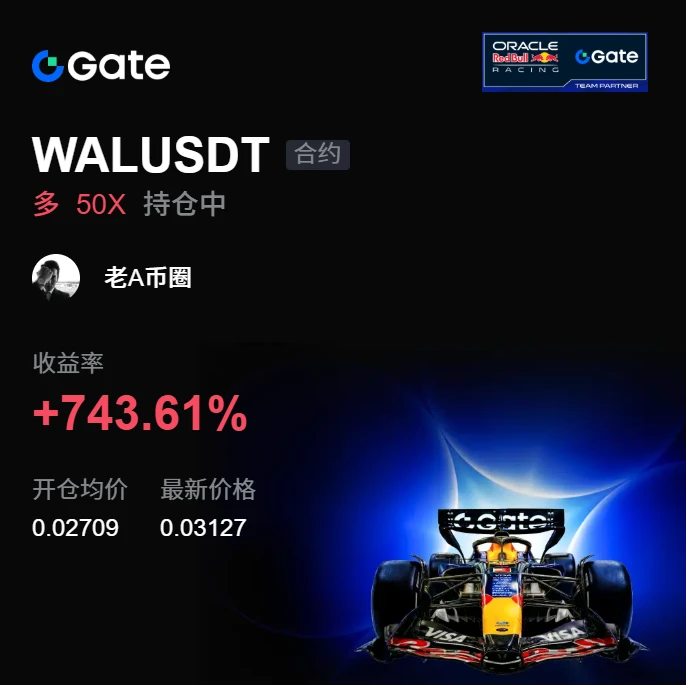
Watching the chart nonstop got annoying; once I turned it off, I could see things more clearly. With my eyes off the chart, my heart stopped racing too. While the market was bottoming out, $WAL moved back and forth. I saw the pullback hold and buying pressure strengthen, so I signaled a long—holding above 0.02709 meant there was a chance.

Then it took off directly, reaching 0.0313, with +748.95% right before our eyes. Feels great, brothers—the profits from this trade feel great.

Hold as long as the trend remains intact; get out if it breaks down. Don’t fall in love with stocks.
Being out
post-image
WAL-5.59%
ADA-3.29%
BNB-2.42%
I have activated my new scanning system that I've been working on for a long time.
Let's say bismillah.
post-image
[ MID AUTMN ] OPEN AI CEO TO brief the un securty .........
live-cover
LIVE1,762
JUST IN: A well-known trader says a weekly close above the MA50 (~$78.7k) could mark the start of a new bull phase for BTC, with a breakout above ~$82.5k–$83k lending stronger confirmation. $BTC
post-image
BTC-1.09%
  • 2
Everyone is about to get blindsided by SYMBOL.

$PEPE /USDT - SHORT

Trade Plan:
Entry: 0 – 0
SL: 0
TP1: 0
TP2: 0
TP3: 0

Why this setup?
Why now? The daily trend is range, which means SYMBOL has been stuck in a tight consolidation, and that compression often precedes a violent directional move. The 1h ATR is at zero, indicating an extreme calm that usually explodes once a catalyst breaks the equilibrium. The 15m RSI sits at 43.56, showing just enough bearish momentum without being overbought, suggesting the short side is still in control. The entry zone is locked at the current price of 0,
PEPE+2.27%
  • 1
Load More

Join 40 M users in our growing community

⚡️ Join 40 M users in the crypto craze discussion

💬 Engage with your favorite top creators

👍 See what interests you

Trending Topics

MSTRTopsNasdaq100

74.01k Views2.93k Discussing

Strategy (MSTR) has gained about 48% over the past month, making it the best-performing stock in the Nasdaq 100, while Bitcoin rose roughly 12% over the same period. The company holds 845,050 BTC with a cumulative cost basis of about $63.73B. MSTR is not a pure Bitcoin proxy — its price swings can be more extreme. Can this rally last?

Gate Tops 24H Net Inflows Among Exchanges

26.39k Views3.68k Discussing

BTCRetakes80K

57.04k Views60.46k Discussing

View More