Futures
Access hundreds of perpetual contracts
CFD
Gold
One platform for global traditional assets
Options
Hot
Trade European-style vanilla options
Unified Account
Maximize your capital efficiency
Demo Trading
Introduction to Futures Trading
Learn the basics of futures trading
Futures Events
Join events to earn rewards
Demo Trading
Use virtual funds to practice risk-free trading
CFD
Stock CFD Derivatives
US Stocks
Access real US stocks and ETFs
HK Stocks
Trade quality Hong Kong-listed stocks
Korean Stocks
SK Hynix
Real Korean stocks and top assets
Stock Futures
High leverage, 24/7 trading
Tokenized Stocks
Backed by real stock assets
IPO Access
Unlock full access to global stock IPOs
GUSD
3.8%
Mint GUSD for Treasury RWA yields
Stocks Activities
Trade Popular Stocks and Unlock Generous Airdrops
Launch
CandyDrop
Collect candies to earn airdrops
Launchpool
Quick staking, earn potential new tokens
HODLer Airdrop
Hold GT and get massive airdrops for free
IPO Access
Unlock full access to global stock IPOs
Alpha Points
Trade on-chain assets and earn airdrops
Futures Points
Earn futures points and claim airdrop rewards
Promotions
AI
Gate AI
Your all-in-one conversational AI partner
Gate AI Bot
Use Gate AI directly in your social App
GateClaw
Gate Blue Lobster, ready to go
Gate for AI Agent
AI infrastructure, Gate MCP, Skills, and CLI
Gate Skills Hub
10K+ Skills
From office tasks to trading, the all-in-one skill hub makes AI even more useful.
BTC Volatility Compression Hits Extreme Levels: Traders Brace for Release - Coinfea
Bitcoin has been compressed within a clear range between $80.5K and $95K for 73 days now. The ranging market has also been characterized by unusually low volatility, especially when you compare to traditionally less volatile assets like gold and silver
ContentsVolatility Measures Showing Extremes Liquidity and Positioning Building Quietly Signals Traders Are Watching for Confirmation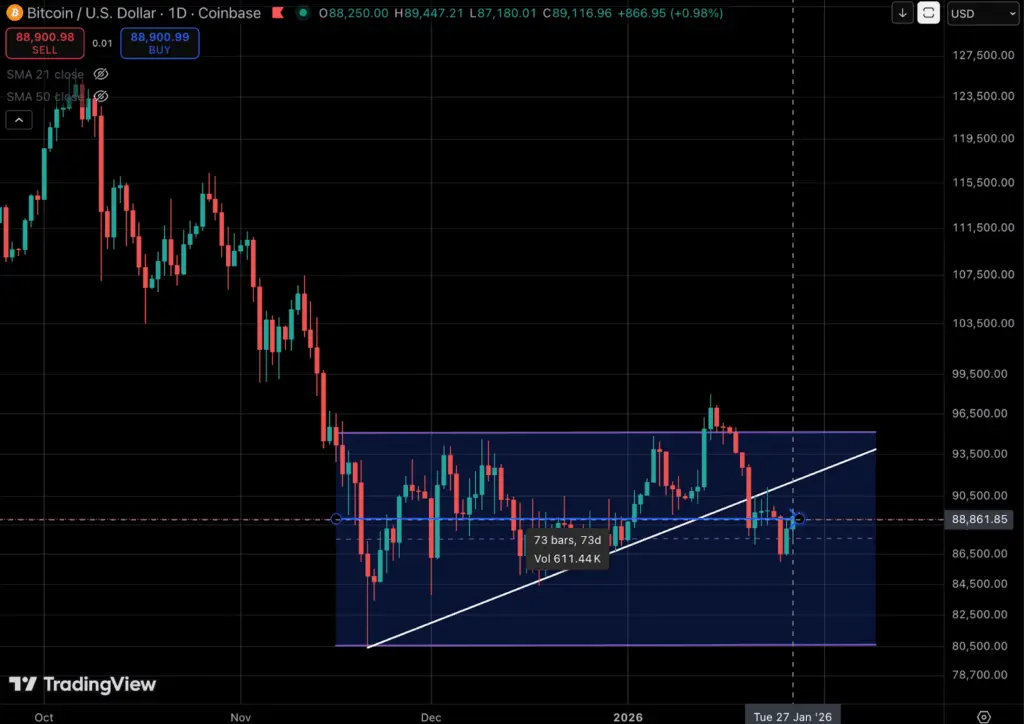 Sentiment has been bleak ever since the liquidation event of October 10th and this tight zone with muted price action has brought a sense of apathy among market participants. That said, volatility indicators are flashing signals that this level of compression is historically rare, often preceding sharp directional moves because markets tend to resolve extended periods of calm with expansion
Volatility Measures Showing Extremes
Bitcoin is often associated with its immense volatility and it remains so on an absolute basis. However, as time has passed, that degree of volatility has been coming down dramatically as BTC becomes a more mature, institutionally adopted asset with deeper liquidity. In fact, on a volatility adjusted basis, it’s actually increasingly comparable to certain mega cap tech stocks like Nvidia, Tesla and Meta
As of this writing Bitcoin’s annualized volatility stands at 34.06%, down well from the triple digits it once was not so long ago
Since November 16th last year, when BTC entered the current range, this 30-day realized volatility has declined from 2.06% to 1.66%. Long periods of volatility suppression like this are historically uncommon for Bitcoin, making this especially notable, not because of what has already happened, but for the likelihood of volatility expansion and directional resolution that typically occurs after an extended lull
Another indicator reinforcing the ongoing compression is Bitcoin’s Sharpe ratio, which measures risk-adjusted returns by comparing excess returns to realized volatility. In simple terms, it tells us whether the volatility investors are taking on is being adequately compensated by returns.
What’s important here is context. Low Sharpe ratio readings do not mark precise bottoms, nor do they preclude further downside. During the 2022 bear market, Bitcoin’s Sharpe ratio remained deeply depressed for extended periods even as price continued to grind lower. However, these regimes have consistently coincided with risk-reward resets, where downside momentum weakens and the market transitions away from impulsive trend behavior.
Taken together with historically low realized volatility and prolonged range-bound price action, the depressed Sharpe ratio adds another layer of evidence that Bitcoin is operating in a compressed, low-conviction environment. These conditions tend to draw attention not because they guarantee an immediate reversal, but because they reflect a market where volatility has been suppressed for long enough that the probability of regime change begins to rise
Liquidity and Positioning Building Quietly
On the downside, liquidity clusters are notably thicker between $88,000 and $86,000, with additional depth extending toward the mid-$85,000s, pointing to leveraged long exposure accumulating below the range
As price continues to oscillate without resolution, these zones become more concentrated, increasing the likelihood that a decisive move will trigger cascading liquidations once either boundary is breached. In this context, the tight range is allowing leverage and liquidity to stack asymmetrically, setting the stage for amplified follow-through when price ultimately escapes the consolidation
Signals Traders Are Watching for Confirmation
Disclaimer: The content within the Sponsored Insights and Press Release category has been provided by our partners and sponsors. The views and opinions expressed in these articles are those of the authors and do not necessarily reflect the official policy or position of our website. While our team takes care to share valuable and reliable content, we do not take responsibility for the accuracy, completeness, or validity of any claims made in these sponsored articles and Press Releases. Readers are encouraged to conduct their own research and due diligence before making any decisions based on the information provided in Sponsored Insights.