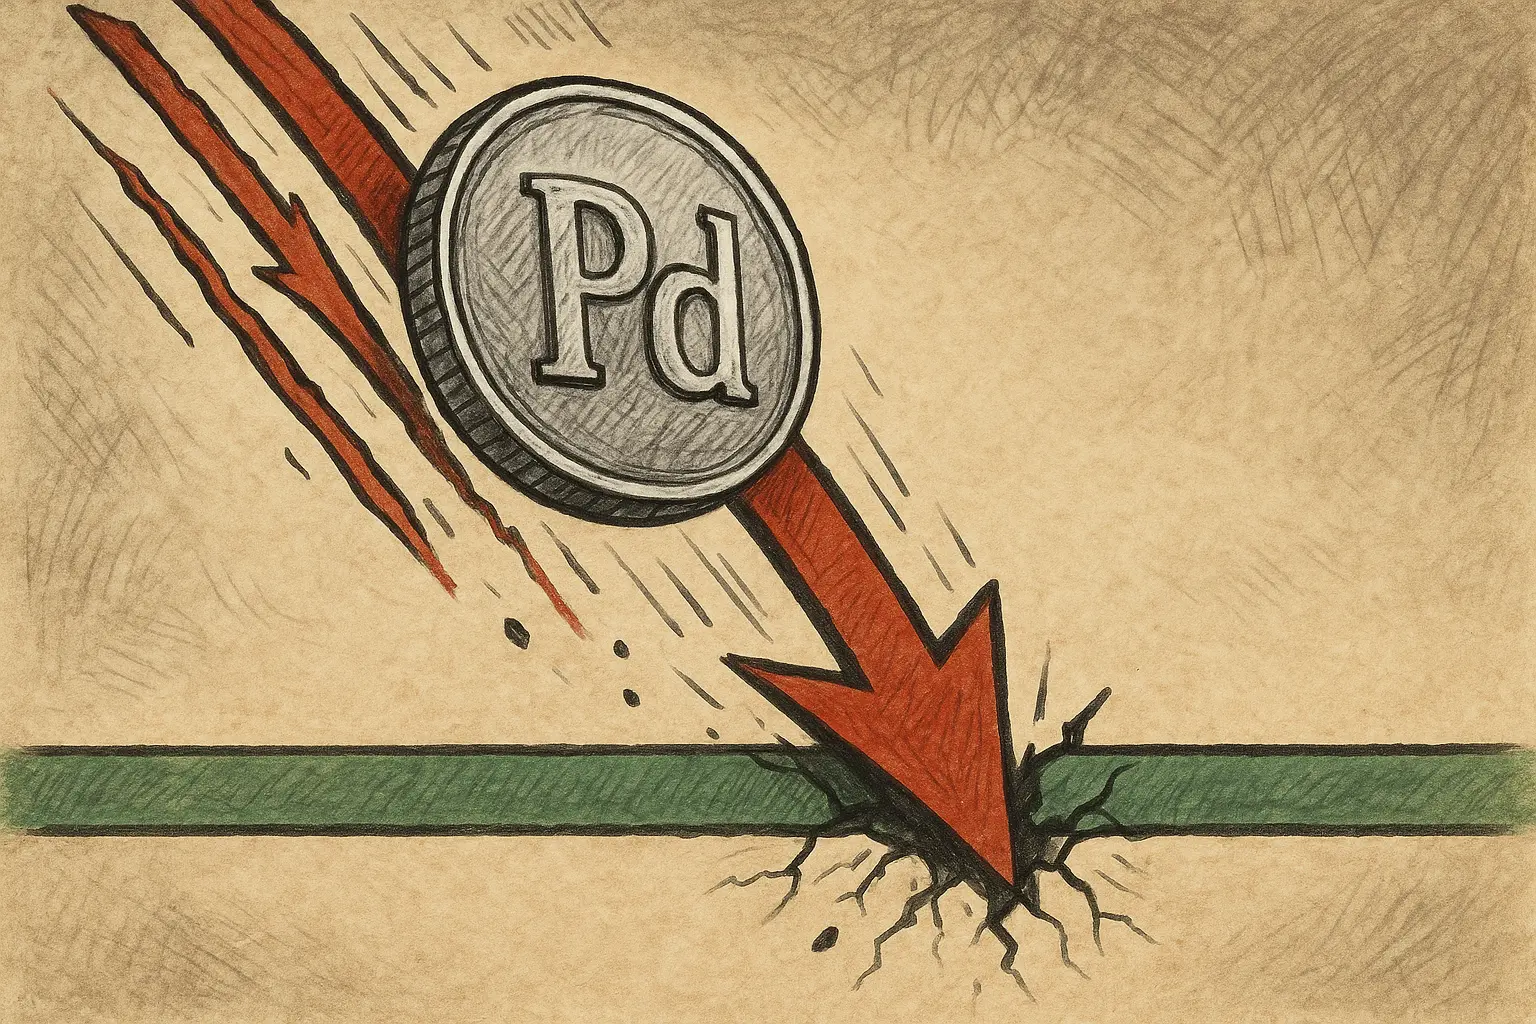
Palladium surged above $3,400 between 2020 and 2022 driven by supply panic, but due to accelerating electric vehicle adoption and substitution effects on platinum, prices collapsed to a long-term support zone around $1,000. By 2025 to 2026, technical signs of a bottom formation appeared. The current key level to watch is between $1,900 and $2,000. A sustained breakout above this resistance would signal a confirmation of a structural shift.
From Supply Panic to Electric Vehicle Impact: The Cyclical Logic Behind Palladium's Crash
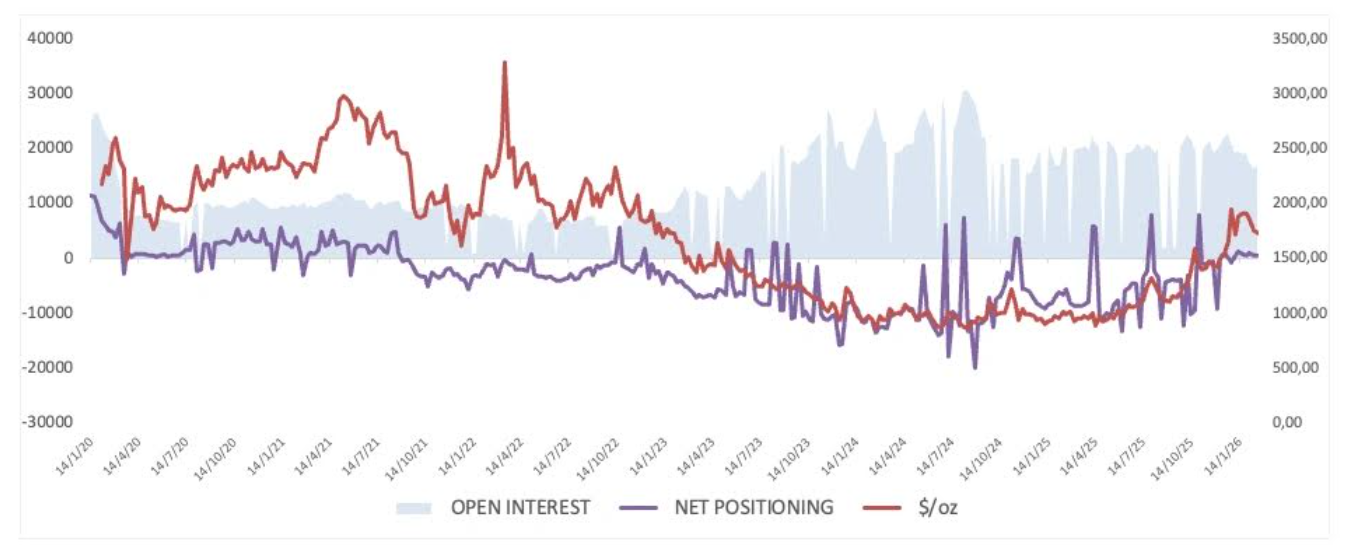
The 2020-2022 palladium bull market was driven by a perfect storm of factors: heavy reliance on Russia for supply (geopolitical risk premium surged), strong demand for automotive catalysts, and limited ground stockpiles. Scarcity premiums soared amid escalating geopolitical tensions, pushing palladium to a historic high of $3,400.
However, as panic subsided, market narratives shifted rapidly from "structural shortage" to "structural obsolescence": the rapid adoption of electric vehicles, technological advances replacing palladium with platinum, and institutional investors pricing in long-term declines in internal combustion engine demand. Large-scale position liquidations caused prices to plummet. By 2023-2024, palladium fell near long-term support levels, momentum indicators reset, and excess sentiment was cleansed.
Six Major Macro Drivers Influencing Palladium's Medium- to Long-Term Trend
-
Global Automotive Production Trends: Palladium is mainly used in catalytic converters for internal combustion and hybrid vehicles; vehicle output directly determines demand fundamentals.
-
China Manufacturing Cycle: As the world's largest auto market, China's manufacturing health directly impacts palladium demand.
-
Platinum Substitution Dynamics: Technological progress enables platinum to replace palladium in some applications, continuously suppressing long-term demand expectations.
-
Russian Supply Concentration: Russia accounts for over 40% of global palladium production; geopolitical risks are a key source of premiums.
-
Electric Vehicle Penetration: Pure electric vehicles do not require catalytic converters, representing a structural demand suppression factor.
-
U.S. Dollar Trends: A weaker dollar generally supports dollar-denominated commodities, and vice versa.
Technical Analysis: Current Position and the Significance of Breaking $1,900
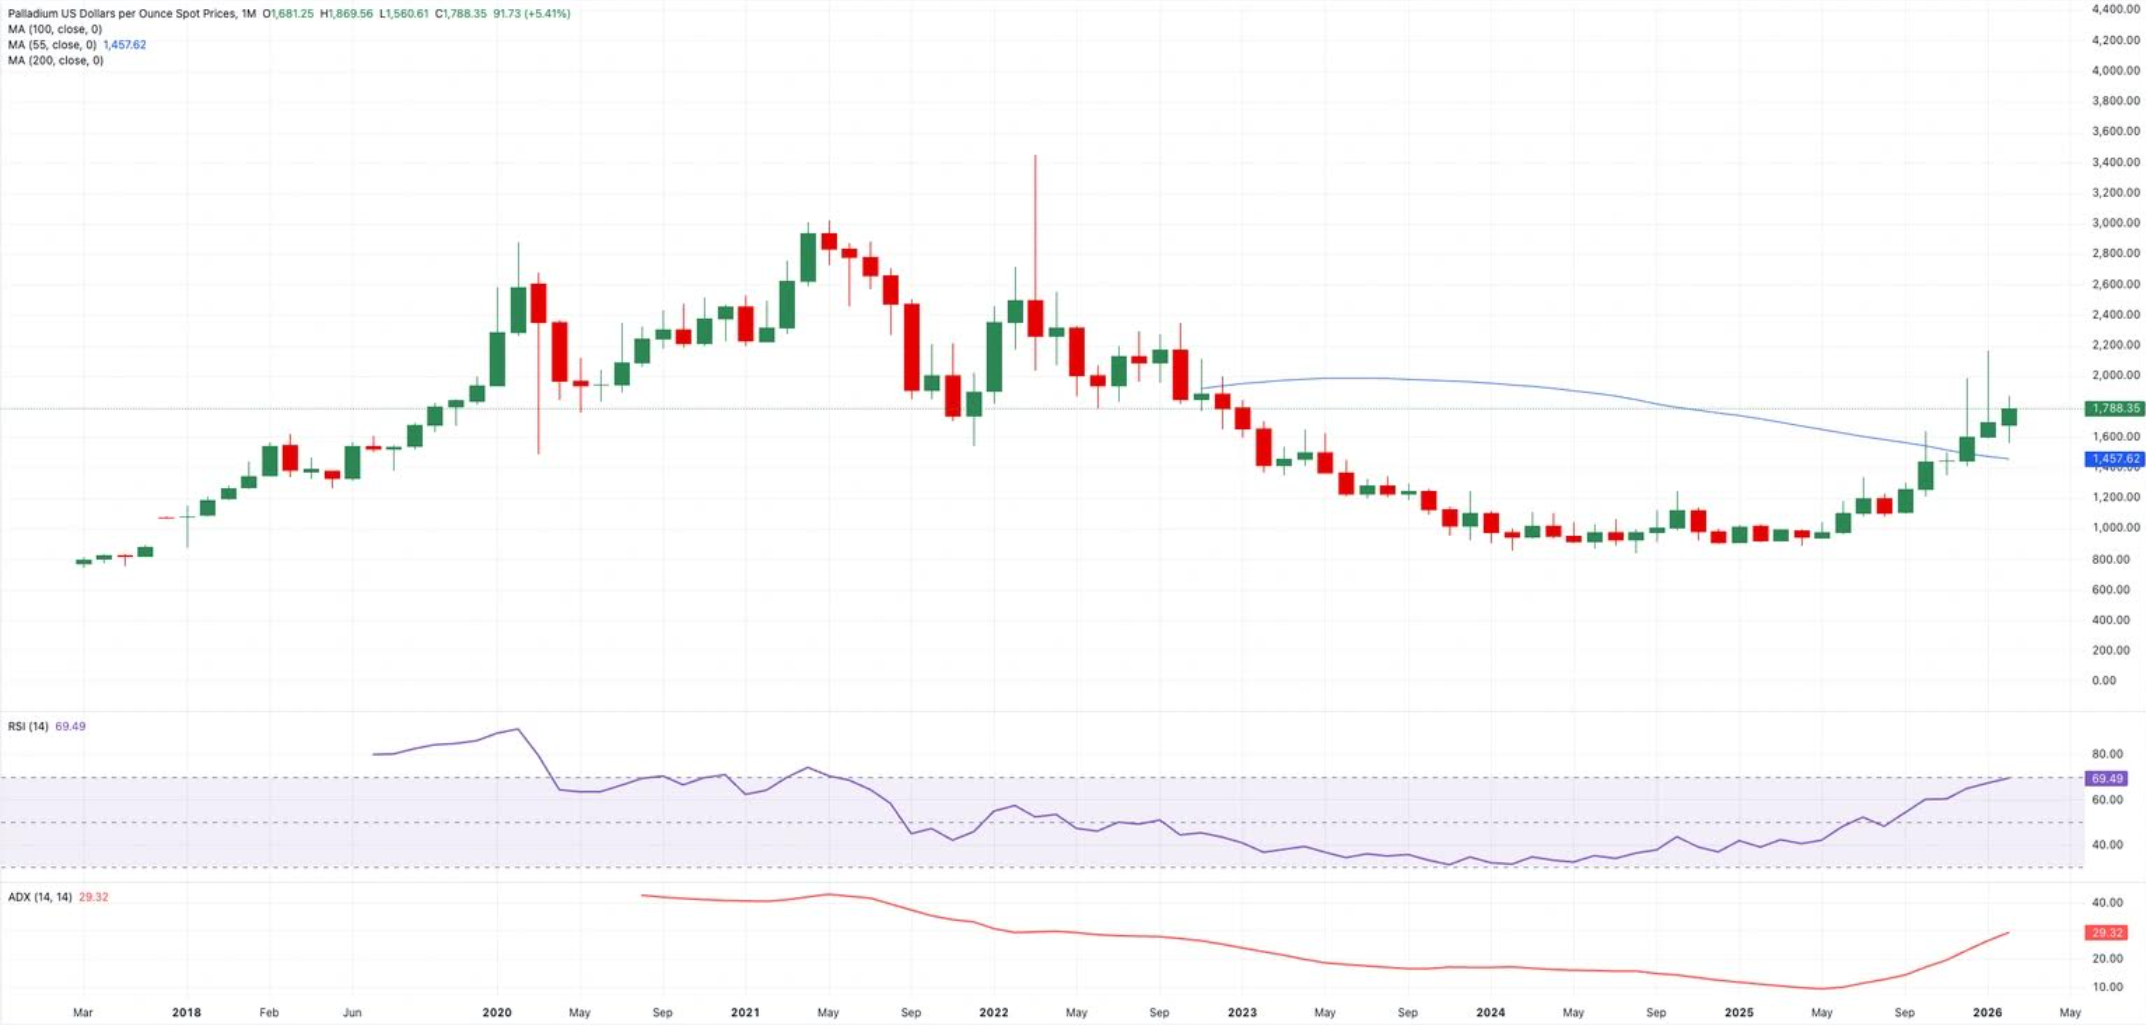
(Source: Trading View)
On the monthly chart, palladium has successfully rebounded above the 55-month moving average and is currently under pressure from the 100-month moving average (around $1,600–$1,700). The Relative Strength Index (RSI), after collapsing in 2023, has steadily recovered, gradually returning to a bullish zone but not yet overbought.
The weekly chart shows that since holding above $1,000, lows have been progressively higher, with trend strength indicators expanding after a long period of compression, indicating a recovery in directional bias. On the daily chart, palladium has recently stabilized around $1,750–$1,800, with no signs of overheating at the end of upward moves. Short-term support is at $1,700–$1,720. A confirmed breakout above $1,850 would suggest buyers are ready to push for the next rally.
The key resistance zone is between $1,900 and $2,000. This area previously acted as a sell-off zone during the initial crash; if weekly charts can sustain a breakout here, it would confirm a fundamental change in the long-term chart structure, directly challenging the prevailing "ultimate decline" narrative.
Frequently Asked Questions
What caused palladium to crash from $3,400 to $1,000?
This over 70% decline was mainly driven by three factors: the rapid adoption of electric vehicles weakening internal combustion catalyst demand, technological advances enabling platinum substitution, and the easing of geopolitical risk premiums after tensions subsided. Market narratives shifted from "structural shortage" to "structural obsolescence" in less than two years, triggering large-scale position liquidations.
Why is the $1,900–$2,000 range the most important technical resistance for palladium?
This zone previously served as a major sell-off area during the initial crash, accumulating a large amount of trapped positions. If palladium can sustain a weekly breakout and hold above $1,900–$2,000, it would technically confirm a structural shift in the long-term chart, changing the medium-term bearish bias and possibly prompting a reassessment of the "long-term decline" outlook.
What does the long-term trend of electric vehicles mean for palladium?
Pure electric vehicles do not use catalytic converters, posing a long-term structural demand decline for palladium. However, hybrid electric vehicles (HEVs) still require palladium catalysts, maintaining a demand base in the short to medium term. The long-term trend will depend on the actual speed of EV penetration and the market size of hybrid vehicles.


