Bitcoin (BTC), Ethereum (ETH), and Ripple (XRP) are in a consolidation phase around key technical levels on Friday, signaling relative stability after recent sharp fluctuations. BTC continues to hold above the $67,000 level, despite a slight correction since the beginning of the week. Meanwhile, ETH trades sideways around $2,000 after failing to break through the resistance zone above the consolidation range. XRP also shows balance, remaining stable around $1.40, supported by a key price level. Overall, the movements of these top cryptocurrencies by market cap reflect cautious but constructive sentiment as traders patiently wait for a strong catalyst to trigger the next upward trend.
Bitcoin Returns to Consolidation Range
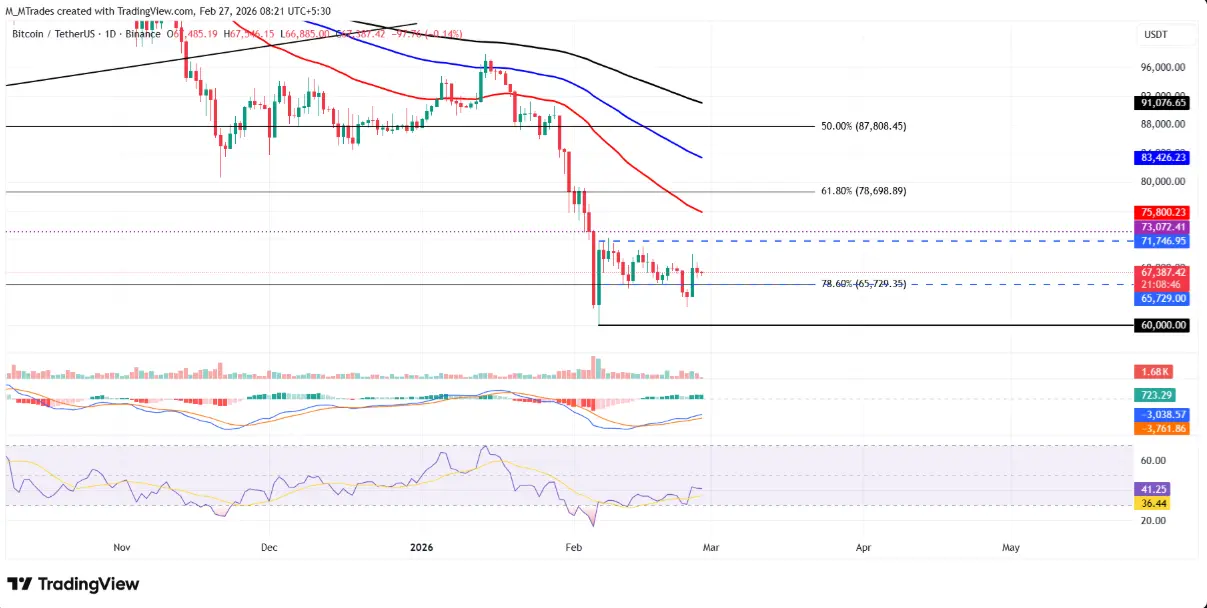
Bitcoin's price experienced a volatile week, breaking below the lower boundary of the consolidation zone at $65,729 on Monday and closing there, then weakening slightly to a daily low of $62,510 the next day. However, the bulls quickly regained control. On Wednesday, BTC surged strongly, erasing all previous losses and closing firmly above $67,900. After this impressive rebound, the price corrected slightly the next day, and by Friday, Bitcoin is fluctuating around $67,400.
In a positive scenario, if the recovery momentum continues, Bitcoin could extend its rally toward the upper boundary of the consolidation zone at $71,746.
 Daily BTC/USDT chart | Source: TradingView
Technically, the Relative Strength Index (RSI) is at 41, rebounding from the oversold zone earlier in the week, indicating selling pressure is waning. However, for a more sustainable recovery, RSI needs to rise above the neutral 50 level. Notably, the MACD indicator has formed a bullish crossover and remains effective, further supporting short-term positive prospects.
Conversely, if Bitcoin fails to maintain a close above the lower boundary of the consolidation zone at $65,729, the price risks reversing downward, testing Tuesday’s low of $62,510. Breaking below this level could trigger stronger selling pressure, pushing the price back toward a key psychological support around $60,000.
Ethereum Faces Rejection at the Upper Boundary of the Range
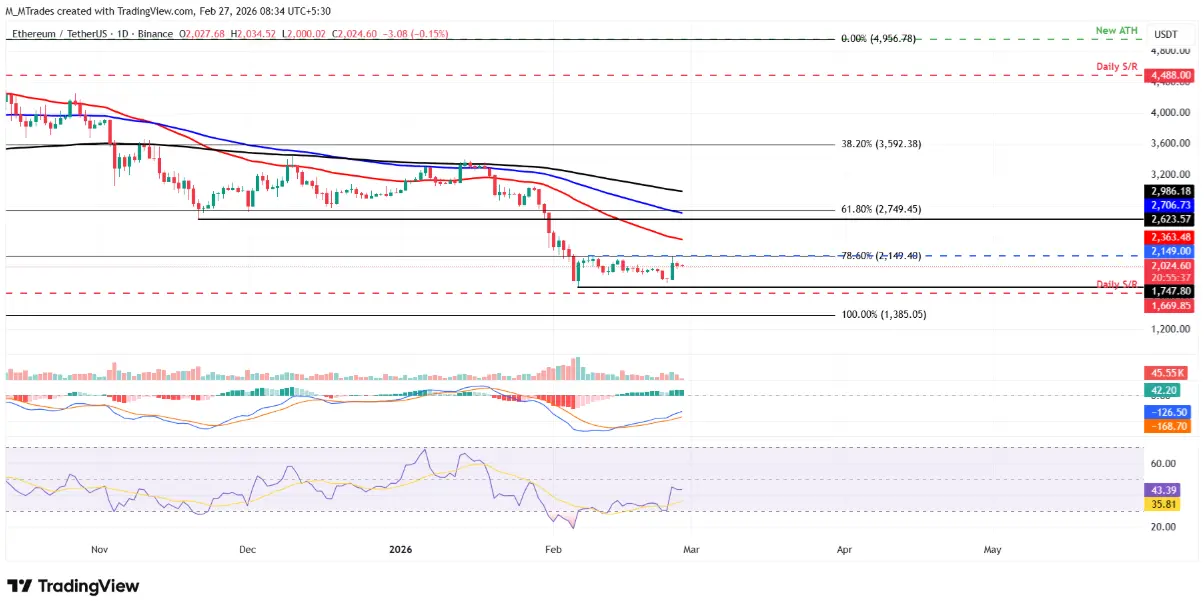
Ethereum started the new week in red, dropping nearly 6% by Tuesday and approaching the lower boundary of the consolidation zone around $1,747. On Wednesday, ETH unexpectedly surged over 11%, testing the upper boundary of the range at $2,149 before easing slightly the next day. By Friday, ETH is fluctuating around $2,000.
In a positive scenario, if buying interest returns, ETH could continue upward toward the resistance above the consolidation range at $2,149. Closing firmly above this level would open room for further gains, bringing ETH closer to the 50-day exponential moving average (EMA) at $2,363.
 Daily ETH/USDT chart | Source: TradingView
Similar to Bitcoin, technical indicators like RSI and MACD for ETH are signaling waning downward momentum, increasing expectations for a rebound in the near future.
On the downside, if selling pressure intensifies, ETH is likely to reverse and test the lower boundary of the range at $1,747.
XRP Rises After Finding Support
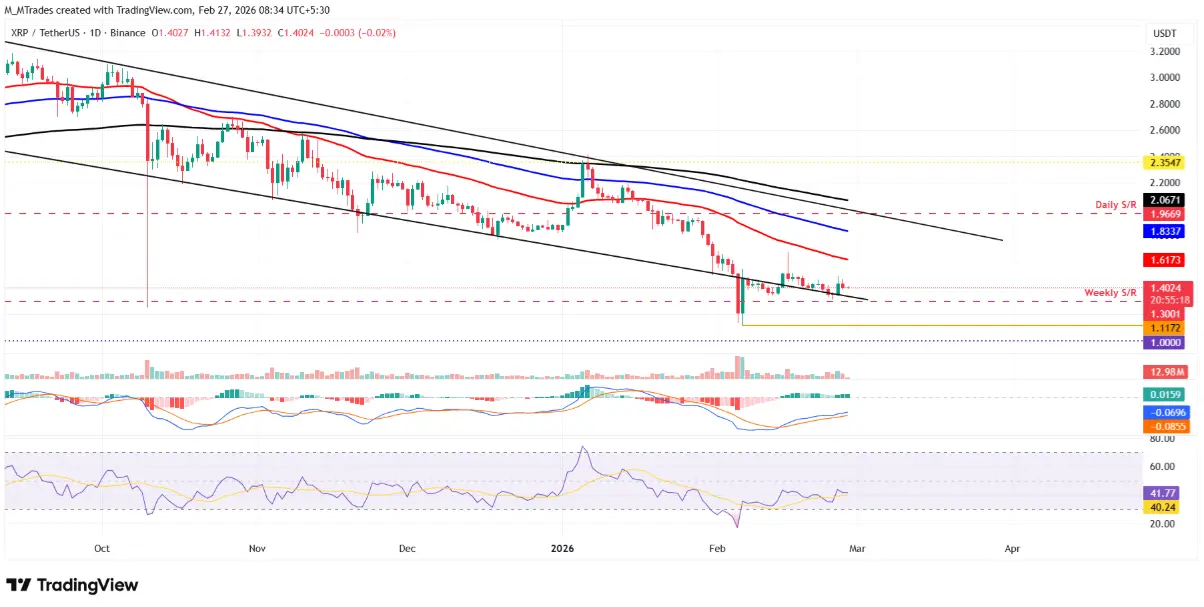
XRP closed below the lower trendline of the descending channel early in the week and continued weakening, gradually approaching the weekly support zone around $1.30 in the following session. On Wednesday, buying interest returned, helping XRP rebound over 6%, but the recovery stalled quickly as the price corrected slightly the next day. As of Friday, XRP is trading around $1.40.
In an optimistic scenario, if the lower trendline continues to act as support, XRP could extend its rebound toward the important psychological level at $1.50.
 Daily XRP/USDT chart | Source: TradingView
Notably, similar to Bitcoin and Ethereum, XRP’s momentum indicators are signaling diminishing selling pressure, reinforcing short-term recovery expectations.
Conversely, if XRP cannot hold above the support zone near the trendline and the correction resumes, the price could fall back toward the weekly support at $1.30. A close below this level could extend the downtrend, testing the February 6 low of $1.11.


