
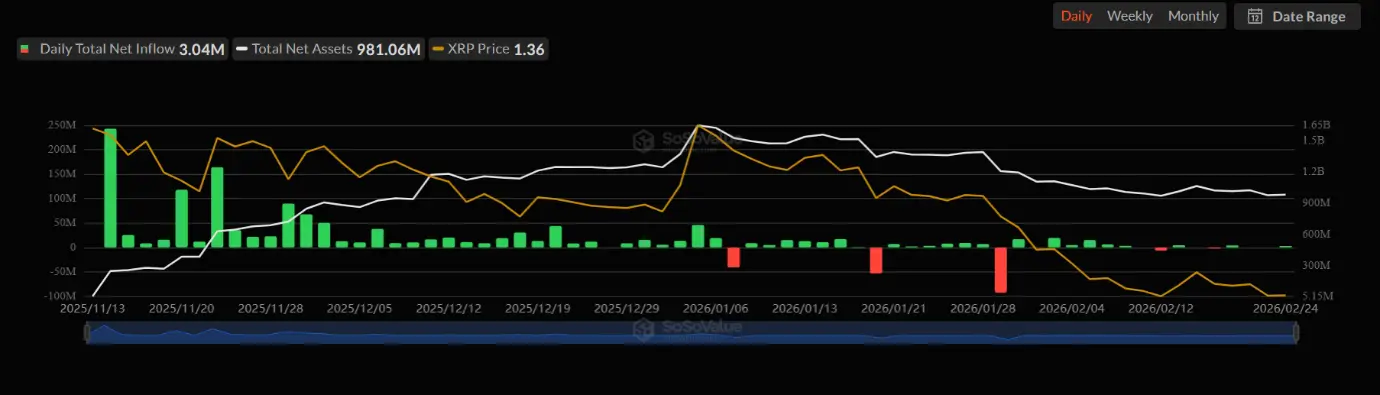
On February 24, the U.S. CB Consumer Confidence Index unexpectedly rose to 91, boosting hawkish expectations for the Federal Reserve. The probability of a rate cut in June decreased to 49.6%, exerting short-term pressure on XRP. However, on the same day, inflows into the U.S. XRP spot ETF reached $3.04 million, with a cumulative net inflow of $1.23 billion since its launch in November last year, supported by continuous institutional buying.
Macro Pressure and ETF Capital Market Dynamics
(Source: SoSoValue)
The unexpected rise in consumer confidence signals that inflationary pressures may persist, further limiting the Federal Reserve’s room to cut rates in the first half of 2026. Maintaining high borrowing costs will continue to suppress leverage trading and speculative demand for cryptocurrencies like XRP, representing the most immediate macro headwinds.
However, market sentiment shifted at the close. As concerns about AI disrupting tech sector profits eased, the Nasdaq rebounded 1.04% that day, closing at 22,864 points, improving overall crypto market sentiment. The BTC spot ETF experienced a net inflow of $178.8 million on the same day, with institutional capital replenishing on two fronts, providing marginal support for XRP.
In the early morning of February 25, XRP rose 3.66% to $1.3983, partly reflecting a corrective buy-up following the decline on February 24. Attention should also be paid to the yen’s movements: on February 24, USD/JPY briefly surged to 156.279. Yen carry trade inflows into risk assets like XRP served as an additional catalyst for the late-day rebound.
Technical Outlook and Structural Significance of ETF Capital
(Source: TradingView)
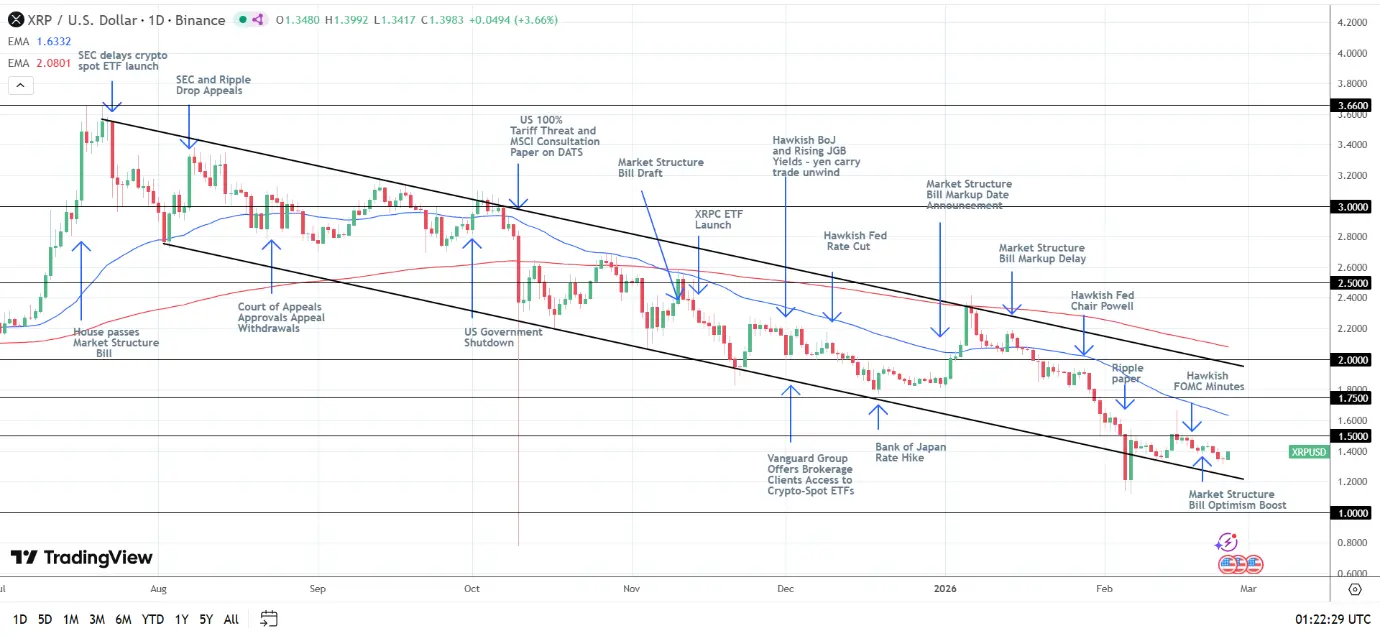
XRP closed down 0.24% at $1.3489 on February 24, with a total decline of 15.6% for February. However, the capital dynamics of the XRP spot ETF show a clear divergence from price movements: since its launch in November last year, the ETF has only experienced five days of net outflows, with total net inflows reaching $1.23 billion, reflecting ongoing institutional accumulation during price declines.
Key Technical Levels for XRP
Major Support Levels: $1.1227 (February 6 low) → $1.0 (psychological support) → $0.7773
Major Resistance Levels: $1.5 → $1.6332 (50-day moving average) → $2.0 → $2.0801 (200-day moving average)
Technical Signals: XRP is currently trading below the 50-day and 200-day moving averages, with the 50-day below the 200-day, indicating a short-term bearish structure.
Analysts suggest that if XRP can break back above $1.5 and surpass the 50-day moving average, the short-term bearish trend may reverse. The medium-term (4–8 weeks) target is $2.0, contingent on the continued progress of the U.S. Senate’s Market Structure Bill and sustained net inflows into the XRP spot ETF.
Frequently Asked Questions
What does the continued net inflow into the XRP spot ETF imply for XRP’s market structure?
Since its launch in November 2025, the XRP spot ETF has only experienced five days of net outflows, with total net inflows reaching $1.23 billion as of February 24, 2026. This indicates ongoing institutional accumulation during price declines, contrasting with retail sentiment, and is generally viewed as a positive sign supporting the medium- to long-term fundamentals.
Why does a declining rate cut expectation from the Fed put direct pressure on XRP prices?
A lower probability of rate cuts suggests that high interest rate environments may persist longer, which dampens investors’ willingness to leverage and reduces speculative capital flowing into crypto markets. CME FedWatch shows the June rate cut probability dropping from 54.3% to 49.6%, making it a key macro factor behind XRP’s short-term pressure on February 24.
How does yen carry trade influence XRP, and how should traders monitor this risk?
Yen carry trade involves borrowing low-interest yen to invest in higher-yield assets. When the Bank of Japan (BOJ) shifts to a hawkish stance and raises interest rates, narrowing the interest rate differential with the U.S., carry trade unwinds may trigger rapid declines in risk assets like XRP. Historical cases from July to August 2024 show BOJ’s hawkish policies caused XRP to plunge from $0.6591 to $0.4320. Traders should closely track USD/JPY movements and BOJ policy statements.


