Author: Nancy Lubale Source: Cointelegraph Translation: Shan Ouba, Jinse Finance
Long-term Bitcoin holders continue to reduce their holdings, with the amount dropping to the lowest level since April.
Key Points
- The proportion of holdings held by long-term Bitcoin holders has fallen to 72%, the lowest since April
- If key support levels are broken, Bitcoin price could undergo a deep correction to $68,500
Long-term Bitcoin holdings fall back to April levels
According to Glassnode data, the holdings of long-term holders (entities holding for at least 155 days) decreased from 14.8 million BTC in mid-July to 14.3 million BTC in December.
As shown in the chart below, the share of holdings held by these investors has dropped to 71.92%, a level comparable to April.
Looking back at April, Bitcoin's price retreated from the all-time high of $109,000 set on January 20, falling as low as $74,000. At that time, long-term holders seized the opportunity to increase their positions at low prices, pushing the share of holdings up to 76% in July, which contributed to a 65% surge in Bitcoin's price, reaching a new all-time high of $123,000.
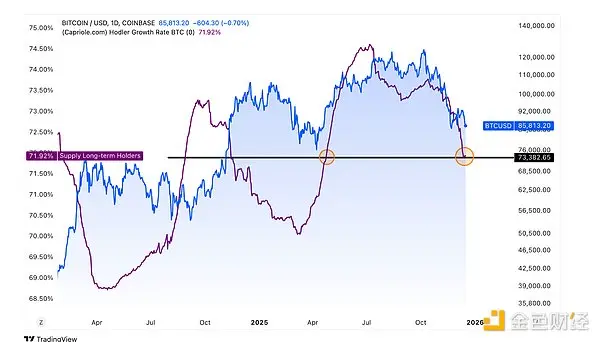
If history repeats itself, long-term holders may view this recent dip to $84,000 as a good opportunity to add positions, potentially driving the price back to new all-time highs in the coming months.
Long-term Bitcoin holder holdings share Data source: Capriole Investments
From a historical cycle perspective, the proportion of holdings held by long-term investors typically declines sharply during retail-dominated market phases, and during bull market peaks, long-term holders often sell off, as seen in both the 2017 and 2021 bull cycles.
CryptoQuant data further shows that, based on a 30-day rolling cycle, on November 26, long-term holder holdings decreased by 1.1 million BTC, marking the second-largest single-day reduction in history.
As of Monday, over the past 30 days, long-term holder holdings have decreased by 761,000 BTC, indicating that, as market fears of further declines grow, these investors are gradually cutting losses and exiting.
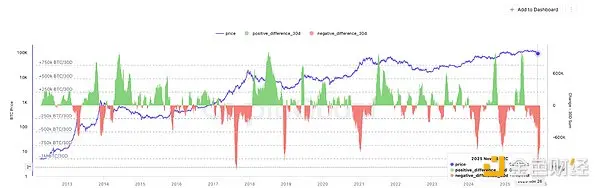
Bitcoin 30-day rolling cycle long-term holder holdings change Data source: CryptoQuant
According to a previous report by Cointelegraph, over the past 30 days, crypto whales have sold a total of $2.78 billion worth of Bitcoin, continuing to exert downward pressure on the price.
Can Bitcoin hold the $70,000 level?
After losing support from the 50-week moving average (MA) and the $93,300 annual opening price, the technical outlook has weakened.
As shown in the chart below, the BTC/USD exchange rate broke below the $92,000 support line of the bear flag pattern last Friday, confirming the pattern.
The primary support zones to watch are the local low of $83,800 set on December 1 and the multi-month low of $80,500 touched on November 21.
If this support zone is broken, Bitcoin's price could further deepen its correction to the measured target of the flag pattern at $68,500, which is also supported by the 200-week moving average. This decline would represent a 20% retracement from the current price.
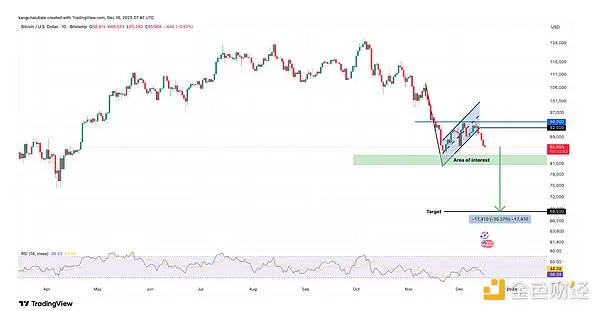
Bitcoin USD daily chart Data source: Cointelegraph/TradingView
Analyst Nic posted on social platform X on Tuesday: “Bitcoin has again broken below a key level, confirming the bear flag pattern.” He added that the next potential support is the 100-week exponential moving average at $85,500.
The analyst further stated: “If this support is broken, the market will test key on-chain support levels at $83,800 (ETF holding cost basis) and $81,200 (actual market average), before reaching the $80,000 mark.”
According to Cointelegraph, the 20-day exponential moving average has started to turn downward, and the Relative Strength Index (RSI) is in the negative zone, all indicating that the current market is dominated by bears.


