XRP is currently recovering from the recent market dip, and technical indicators suggest the asset might be gearing up for a potential 1,000% surge in the current cycle.
According to pseudonymous crypto analyst ChartNerd, this bullish outlook is based on six-month candle formations, which indicate that XRP has not yet entered a bearish phase.
ChartNerdIn an X post on October 19, the analyst noted that technical projections based on Fibonacci extension levels point to a progressive rally ahead
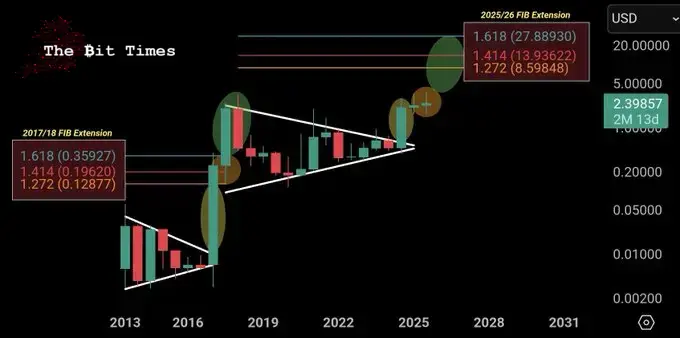 XRP price analysis chart. Source: ChartNerd**XRP price analysis chart. Source: ChartNerdThe first target zone aligns near $5, marking the next major impulse phase. A subsequent advance could lift prices toward the $8 to $13 range, setting the stage for the cycle’s peak at approximately $27, corresponding to the 1.618 Fibonacci extension level.
Historically, XRP has followed similar breakout patterns, such as the one seen in 2017–2018, which preceded a substantial parabolic surge
“I expect continuation to $5 in the next impulse. Then $8 to $13 and finally the $27 1.618 target for this cycle’s blow-off top. The macro move is not over, it’s just beginning,” the analyst said.
“I expect continuation to $5 in the next impulse. Then $8 to $13 and finally the $27 1.618 target for this cycle’s blow-off top. The macro move is not over, it’s just beginning,” the analyst said.
If XRP reaches $27, it would imply a market cap of $1.61 trillion, making it the second-ranked cryptocurrency, assuming Ethereum (ETH) sees minimal growth and Bitcoin (BTC) maintains its current levels
To reach these levels, XRP will likely need support from broader market sentiment and institutional capital inflows, particularly if U.S. regulators approve spot exchange-traded funds (ETFs).
Whales investors on the edge
In the short term, the asset has faced volatility, putting investors on edge. Notably, data shared by Ali Martinez on October 20 indicated that whales have shown little trading activity over the past two weeks
Wallets holding between 100,000 and 10 million XRP have remained largely inactive, signaling uncertainty among major investors
Historically, whale accumulation has preceded price recoveries, while heavy sell-offs indicate corrections. The current pause suggests a wait-and-see approach, likely awaiting clearer market or regulatory signals amid Ripple’s ongoing U.S. legal battle.
XRP price analysis
By press time, XRP was trading at $2.46, up over 3% in the past 24 hours, though it has fallen more than 5% on the weekly timeframe.
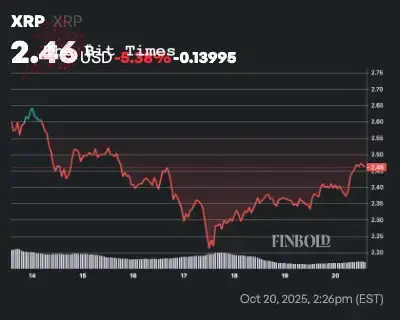 XRP seven-day price chart. Source: Finbold**XRP seven-day price chart. Source: FinboldAt the current valuation, XRP remains below both the 50-day simple moving average (SMA) at $2.84 and the 200-day SMA at $2.62. This positioning signals a persistent bearish trend, as price action below these key moving averages suggests sustained selling pressure and waning market momentum.
Meanwhile, the 14-day Relative Strength Index (RSI) sits at 36.05, just above the oversold threshold of 30. This indicates that while bearish momentum dominates, selling pressure has not yet reached extreme levels.
Featured image via Shutterstock
Featured image via ShutterstockFeatured image via Shutterstock


