
Futures
Access hundreds of perpetual contracts
CFD
Gold
One platform for global traditional assets
Event Contracts
New
Predict price moves and seize opportunities
Options
Hot
Trade European-style vanilla options
Unified Account
Maximize your capital efficiency
Demo Trading
Introduction to Futures Trading
Learn the basics of futures trading
Futures Events
Join events to earn rewards
Demo Trading
Use virtual funds to practice risk-free trading
CFD
Stock CFD derivatives
US Stocks
Access real US stocks and ETFs
HK Stocks
Trade quality Hong Kong-listed stocks
Korean Stocks
SK Hynix
Real Korean stocks and top assets
JP Stocks
Top Japanese stocks, all in one place
Stock Futures
High leverage, 24/7 trading
Stock Options
New
Popular stock options, flexible leverage
Stocks Activities
Trade popular stocks and unlock generous airdrops
Tokenized Stocks
Backed by real stock assets
IPO Access
Unlock full access to global stock IPOs
Launch
CandyDrop
Collect candies to earn airdrops
Launchpool
Quick staking, earn potential new tokens
HODLer Airdrop
Hold GT and get massive airdrops for free
Pre-IPOs
Unlock full access to global stock IPOs
Futures Points
Earn futures points and claim airdrop rewards


Promotions
AI
Gate AI
Your all-in-one conversational AI partner
Gate AI Bot
Use Gate AI directly in your social App
GateClaw
Gate Blue Lobster, ready to go
Gate for AI Agent
AI infrastructure, Gate MCP, Skills, and CLI
Gate Skills Hub
10K+ Skills
From office tasks to trading, the all-in-one skill hub makes AI even more useful.


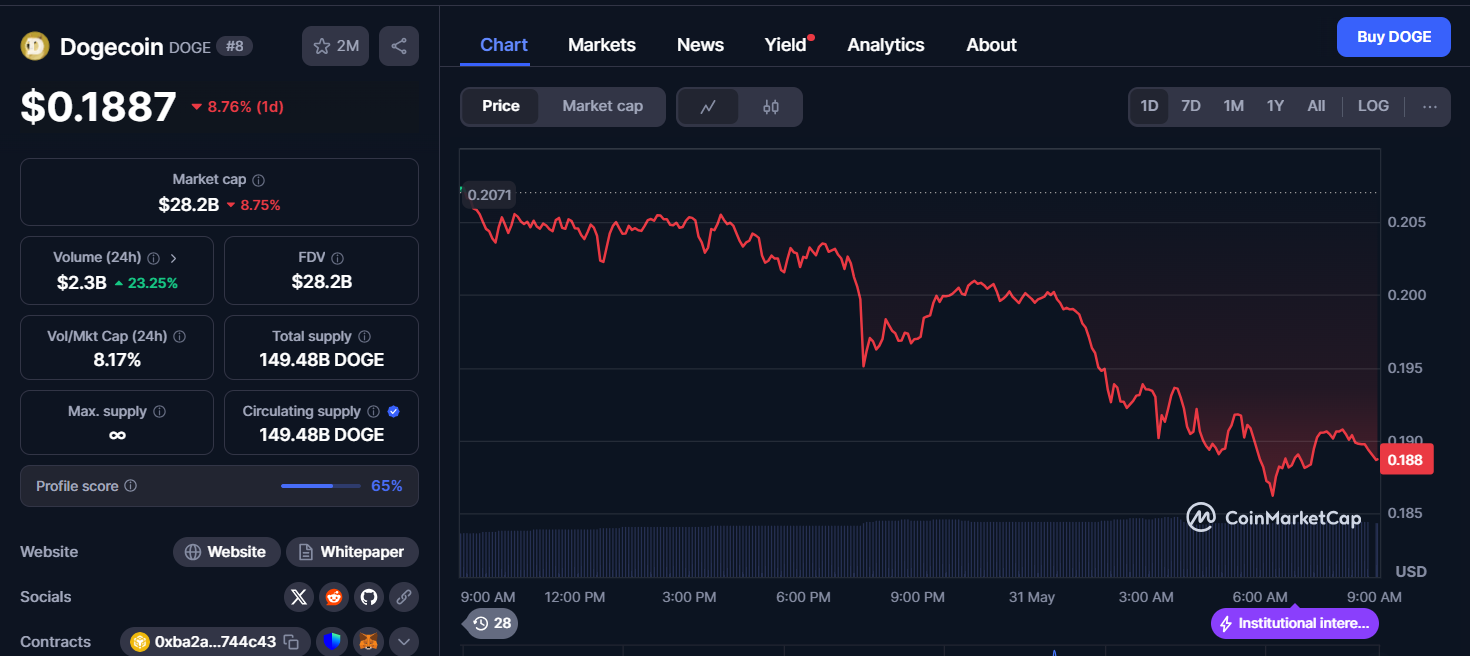 ***Source:***CoinMarketCapThe 24-hour trading volume rose by 23.25% to reach $2.3 billion, indicating increased market activity despite the price drop. The chart shows a downward trend from a high of $0.2071 to the current level. The volume-to-market-cap ratio stands at 8.17%, reflecting moderate trading pressure during the recent decline.
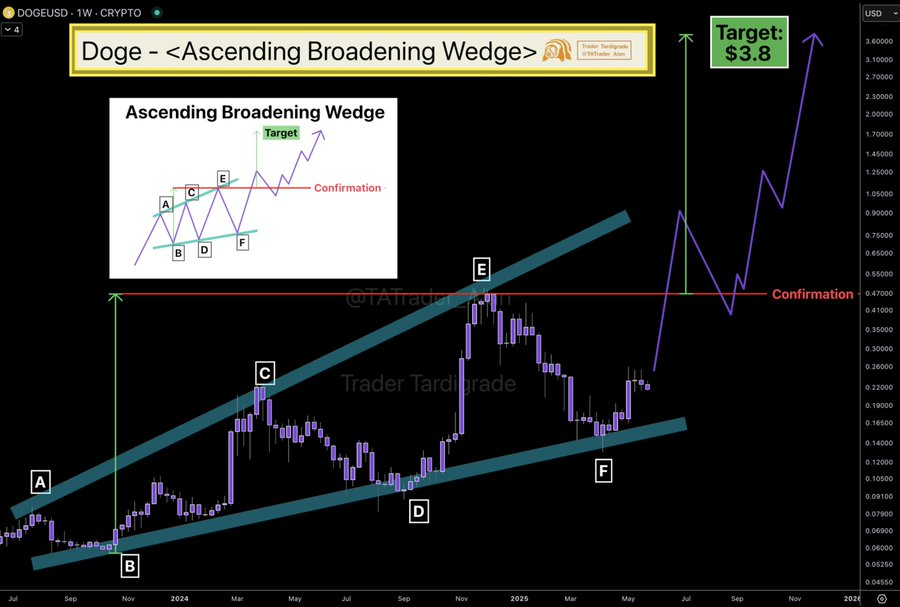 Source***:*** *Trader Tardigrade (X)*Prices at point E reach the highest value, which is the top boundary for upward resistance. The price ends up falling from peak B to point F, which is just next to the lower trendline in the pattern. The difference between highs and lows started to grow from points A-B to points C-E, meaning the market started to be more volatile.