U.S. stock earnings reports are an important source of information that publicly traded companies use to regularly disclose revenue, profit, cash flow, and operating performance. They typically include quarterly and annual reports. For highly watched companies such as NVIDIA (NVDA), Tesla (TSLA), Meta (META), and Netflix (NFLX), earnings reports not only reflect operating performance over the past quarter but also influence investors' assessments of future growth, profitability, and company valuation.
A seemingly contradictory phenomenon often occurs in the U.S. stock market: a company's reported earnings per share (EPS) and revenue exceed analyst expectations, yet its stock price falls significantly in after-hours trading or on the following trading day. This does not mean that earnings data has lost its significance. Rather, stock prices usually already incorporate investors' forecasts for future performance. When actual results exceed the published consensus estimate but fail to meet the market's higher implicit expectations, or when management sends cautious signals about future growth, investors may reassess the company's valuation.
The U.S. earnings season in October 2026 once again demonstrated this phenomenon. Meta reported quarterly results above market expectations, but its continuously expanding AI infrastructure investments and changes in free cash flow drew investors' attention. Tesla's adjusted EPS also came in slightly above market expectations, but its earnings structure, capital expenditures, and future business development continued to affect its stock price. Understanding these changes requires analyzing EPS, revenue, guidance, free cash flow, and valuation within the same framework, rather than judging a stock's upside based solely on the words "above expectations."
Key Takeaways
-
An earnings beat does not mean that a stock price will necessarily rise. Stock prices reflect investors' expectations for future profitability. Even when actual results exceed analysts' consensus estimates, they may still fall short of the higher expectations already priced into the stock.
-
EPS is an important measure of profitability, but it cannot determine stock price movements on its own. Revenue growth, profit margins, cash flow, and one-time accounting items also affect how the market assesses earnings quality.
-
Guidance may be more important than the current quarter's earnings. Even if a company reports quarterly earnings above expectations, its stock price may still fall if its revenue forecast for the next quarter is below market expectations.
-
AI capital expenditures have become an important metric for evaluating technology stock earnings. Investments in data centers, chips, and computing infrastructure may support long-term growth but may also pressure free cash flow in the short term.
-
Valuation determines how much tolerance the market has for earnings results. Highly valued companies often need to continue delivering growth above expectations, while earnings below implicit expectations may trigger a valuation adjustment.
-
Earnings analysis should combine actual results, forward guidance, and the expectations already reflected in the stock price. Simply determining whether EPS beat expectations cannot fully explain post-earnings price movements.
What Does It Mean When U.S. Stock Earnings Beat Expectations? How Is an EPS Beat Calculated?
A U.S. stock earnings beat generally means that the actual financial metrics reported by a publicly traded company are higher than the market consensus estimates previously issued by analysts. The most common metrics include earnings per share (EPS) and revenue. Analysts forecast the next quarter's performance based on the company's historical operating results, industry trends, management guidance, and other publicly available information. Market data providers then aggregate forecasts from different analysts to form a consensus estimate.
For example, suppose the market consensus EPS for a technology company is $1.50 and its actual reported EPS is $1.65. Its EPS beat would therefore be 10%. If the company's expected quarterly revenue is $20 billion and its actual revenue is $21 billion, its revenue beat would be 5%. In earnings news, this situation is commonly called an Earnings Beat, meaning that the company's current-period results exceeded broad market forecasts.
The calculation is:
\[ \text{EPS Surprise}=\frac{\text{Actual EPS}-\text{Expected EPS}}{|\text{Expected EPS}|}\times100\% \]
This formula is appropriate when expected EPS is not zero. However, when expected EPS is close to zero or negative, the percentage can be misleading. In such cases, it is generally more appropriate to compare the absolute difference in EPS directly. It is also important to note that GAAP EPS and Adjusted EPS reported in earnings releases are not the same. The former follows generally accepted accounting principles, while the latter may exclude specific expenses or one-time items. When comparing actual results with analyst estimates, ensure that both use the same reporting basis.
However, an earnings beat only indicates that actual results exceeded a particular forecast benchmark. It does not mean that all of the company's business metrics are improving, nor does it mean that the stock price had not already reflected the result. If a company's stock price has already risen significantly before its earnings release, investors may have already expected it to deliver results better than analysts' forecasts. In that case, an ordinary Earnings Beat may not be enough to support further gains.
Why Can a Stock Price Fall Even When EPS Beats Expectations?
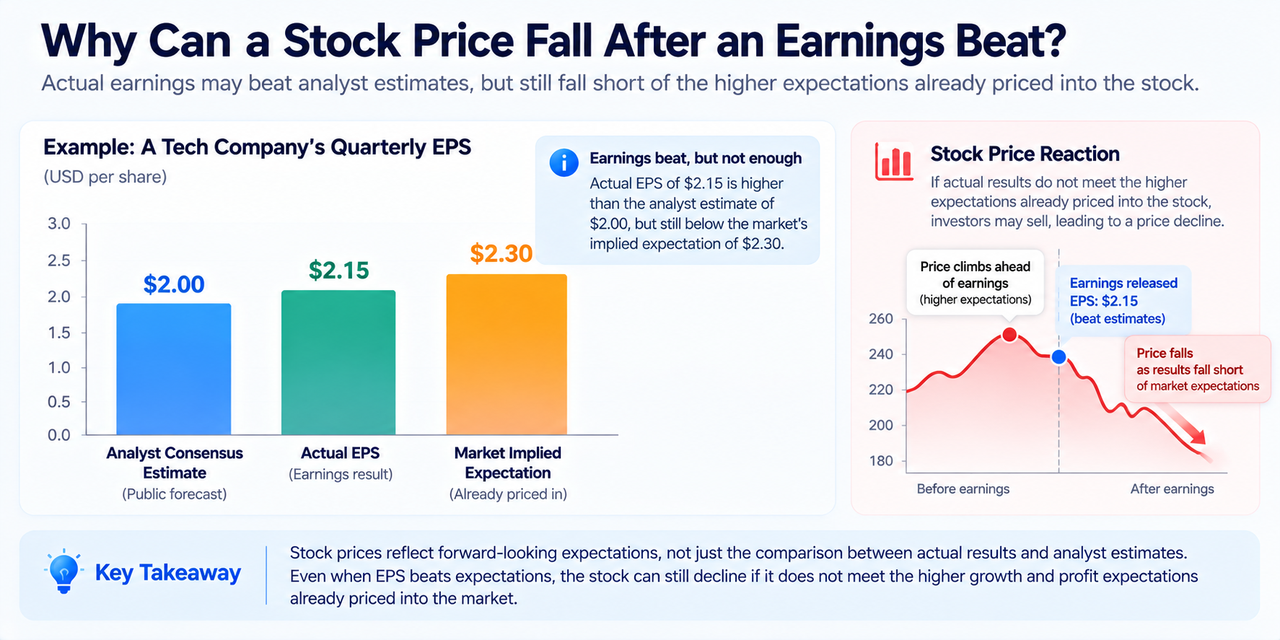
The core reason a stock price may fall after an EPS beat is that the public consensus estimate and the expectations already reflected in the stock price are not exactly the same. Analyst consensus estimates are generally observable financial forecasts, while stock prices are influenced collectively by institutional investors, traders, and other market participants. When large numbers of investors buy a stock in advance, its price may already incorporate an optimistic view that exceeds the consensus estimate.
Suppose a company's stock is trading at $200, analysts expect quarterly EPS of $2.00, but market participants generally believe the company can achieve EPS of $2.30 and push the stock price higher in advance. If the company ultimately reports EPS of $2.15, that result is 7.5% above the analyst consensus but below the level some investors actually expected. Because the results did not sufficiently validate the previous optimistic pricing, some investors may choose to sell, causing the stock price to decline.
This is why earnings analysis cannot focus only on a Beat or Miss. Investors must also observe the stock's performance before the earnings release. If a stock has already risen 20% in the month before earnings while valuations across its industry have not increased by a similar amount, its earnings report may need to provide stronger evidence of growth to support the higher price. Conversely, if a company's stock has been under sustained pressure, even a slightly below-consensus earnings report may be viewed positively if its forward guidance improves.
Post-earnings price movements are also affected by investor positioning, options market pricing, industry sentiment, and the broader macroeconomic environment. After-hours trading usually has lower liquidity than regular trading hours, which can amplify short-term price movements. Therefore, an EPS beat and a stock price decline are not contradictory: the former measures the difference between actual results and forecasts, while the latter reflects investors' repricing of the company's future value.
What Is the Difference Between EPS, Revenue, and Profit Margin? Why Can't Investors Look Only at EPS?
EPS is an important measure of a publicly traded company's profitability, but it does not fully reflect the quality of its operations. EPS is generally calculated by dividing net income attributable to common shareholders by the weighted average number of shares outstanding. As a result, changes in EPS are influenced not only by profit from core operations but also by tax rates, one-time gains, share repurchases, and accounting adjustments.
For example, a company may beat EPS expectations by cutting expenses or reducing its share count, while revenue growth slows significantly during the same period. For high-growth technology companies, the market often pays closer attention to whether the core business still has room to expand. If revenue growth declines and EPS growth is driven primarily by cost controls, investors may worry that future earnings growth lacks sustainable momentum.
Revenue reflects the income a company generates from selling goods or providing services and is an important indicator of business scale and market demand. Gross Margin reflects profitability after direct costs are deducted from revenue. Operating Margin goes further by accounting for operating expenses such as research and development, sales, and administration. Free Cash Flow (FCF) is generally calculated as cash flow from operating activities minus capital expenditures. It measures how much cash a company can generate after maintaining or expanding its business investments.
| Financial Metric |
What It Primarily Measures |
Key Investor Question |
| EPS |
Earnings attributable to each share |
Did earnings exceed market expectations? |
| Revenue |
The scale of the company's operating revenue |
Is business demand continuing to grow? |
| Gross Margin |
The gross profit generated by products or services |
How effective are cost controls and pricing? |
| Operating Margin |
The efficiency of core business operations |
Can revenue growth translate into profit? |
| Free Cash Flow |
Cash generation after capital expenditures |
Does the company have the capacity to continue financing and investing? |
| Guidance |
Management's forecast for future performance |
Is growth in the next phase in line with expectations? |
For semiconductor companies such as NVIDIA and AMD, investors may focus more on data center revenue, gross margin, and future order demand. For internet companies such as Meta and Alphabet, advertising growth, AI capital expenditures, and free cash flow are also important. For Tesla, vehicle deliveries, automotive gross margin, the energy business, and investments related to autonomous driving collectively influence market expectations. Therefore, earnings quality should be assessed from multiple perspectives, including revenue, profit, cash flow, and business structure, rather than equating an EPS beat with comprehensive operational improvement.
What Is Guidance? Why Can Future Revenue Forecasts Matter More Than Current-Quarter Earnings?
Guidance is management's forecast for the company's operating performance in the next quarter or full fiscal year. It commonly includes revenue ranges, profit margins, capital expenditures, and business growth targets. Unlike quarterly results that have already been realized, guidance reflects management's assessment of future market demand, operating costs, and business development. It therefore often directly affects investors' estimates of the company's future profitability.
Suppose a company's quarterly revenue reaches $10.5 billion, exceeding analysts' expectation of $10 billion, but management forecasts revenue of only $10.8 billion to $11.2 billion for the next quarter, while the market had expected $12 billion. In this situation, the company has delivered an earnings beat for the current period while also signaling that future growth may be below expectations. Investors may consequently lower their revenue and profit forecasts for the next several quarters and recalculate the stock's fair valuation.
The market also compares current guidance with previous guidance. If a company raises its revenue forecast for several consecutive quarters, it generally indicates that demand or operating efficiency is stronger than previously expected. If management suddenly lowers guidance, it may indicate slowing customer demand, intensifying industry competition, or rising operating costs. However, guidance below expectations does not necessarily mean that the business is deteriorating. Differences may also result from currency movements, changes in investment timing, or management adopting a more conservative forecasting approach.
Therefore, investors should focus on three levels when reading an earnings report: whether current-period results exceeded expectations, whether next-quarter guidance is above market forecasts, and whether full-year operating targets have changed. For technology stocks whose valuations depend heavily on future growth, management's view of the next stage of the business may influence the stock price more than the already reported quarterly EPS.
Why Did Meta Remain Under Pressure Despite an Earnings Beat? How Do AI Capital Expenditures Affect Valuation?
Meta is a typical example of a stock declining after an earnings beat. In the third quarter of 2026, Meta's operating performance exceeded market expectations, but its continually expanding AI infrastructure investments and the resulting cash flow pressure became important factors in investors' reassessment of the company's value.
In its latest earnings report, Meta disclosed that third-quarter capital expenditures, including principal payments on finance leases, reached $34.91 billion. Cash flow from operating activities was $32.79 billion, and free cash flow was negative $2.12 billion. The company also adjusted its full-year 2026 capital expenditure forecast to $135 billion–$145 billion, compared with its previous forecast range of $130 billion–$145 billion. This means that the lower end of its full-year capital expenditure forecast increased further, reflecting the company's continued investment in AI infrastructure.
Capital expenditures (Capital Expenditure, CapEx) primarily include purchases of servers, GPUs, and networking equipment, as well as data center construction and other long-term assets. For a technology company such as Meta, AI investment can improve ad recommendations, content distribution, and user experience. It may also support new products and revenue sources in the future. However, these investments generally require substantial cash payments in the short term, while the related benefits may take years to materialize gradually.
This creates an important tension in technology stock valuation: investors recognize AI's long-term commercial potential but must also assess whether current investment levels are excessive and whether future revenue growth can cover the investment costs. If capital expenditure growth continues to outpace growth in operating cash flow, free cash flow may come under pressure, affecting the market's view of the company's capital efficiency and future shareholder returns.
On October 22, 2026, Meta's stock price fell approximately 7%, indicating that investors were not trading solely on whether quarterly earnings exceeded expectations. They were also considering the scale of AI investment, future cash flow, and valuation risk.
It is important to note that negative free cash flow in a single quarter does not by itself prove that an investment has failed. For a company building large-scale infrastructure, the more important question is whether capital expenditures can gradually translate into revenue growth, improved profit margins, and long-term cash-generating capacity.
Why Is the Market Still Focused on Future Growth After Tesla Beats Earnings Expectations?
Tesla's earnings report likewise shows that an EPS beat does not mean the market will ignore other operating metrics. In the third quarter of 2026, Tesla reported adjusted EPS of $0.48, slightly above market expectations, while GAAP net income was approximately $787 million, down approximately 44% year over year. Revenue was approximately $28 billion, with little overall change. This shows that an earnings beat and a year-over-year decline in profit can occur at the same time.
In terms of cash flow, Tesla generated approximately $1.5 billion in free cash flow during the quarter, performing better than some market expectations. However, its capital expenditure plans, automotive profitability, and future investments in autonomous driving and robotics continued to influence investors' assessment of long-term growth. For a company such as Tesla, whose valuation incorporates substantial expectations for future businesses, traditional vehicle sales are not the only pricing factor. Robotaxi, Optimus, the energy business, and AI infrastructure investments may all change the market's estimate of future profit.
For example, if automotive margins improve but autonomous driving commercialization takes longer than investors expect, the market may conclude that the pace of future revenue realization is insufficient to support the current valuation. Conversely, even if quarterly profit falls below expectations, investors may raise their long-term growth forecasts if management provides clearer evidence of commercialization progress.
Tesla's stock fell in after-hours trading following the earnings release, further demonstrating the market's focus on future business development.
Therefore, analyzing TSLA requires more than comparing adjusted EPS with analyst forecasts. Investors should also examine automotive margins, free cash flow, capital expenditures, and the commercialization progress of new businesses to determine whether they are consistent with previous market expectations.
Why Are Highly Valued Technology Stocks More Likely to Experience Large Post-Earnings Swings?
Stock valuation reflects the price investors are willing to pay for a company's current and future earnings. For mature companies, the market typically focuses more on stable profits, cash flow, and shareholder returns. For high-growth technology companies, investors are often willing to pay higher valuations in exchange for the possibility of rapid future revenue and profit growth. As a result, the price of a highly valued technology stock depends not only on current earnings but also heavily on whether future growth can continue to materialize.
The price-to-earnings ratio (Price-to-Earnings Ratio, P/E) is a common valuation metric calculated by dividing the stock price by EPS. Forward P/E uses expected future EPS and is more suitable for evaluating how the market prices the next phase of earnings. Suppose a company's stock price is $150 and the market expects EPS of $5 over the next 12 months. Its forward P/E would be 30x. If the market lowers its future EPS forecast to $4.50 after the earnings release, the price calculated at the same 30x P/E would fall to $135.
More importantly, a reduction in earnings forecasts may also trigger multiple contraction. If investors believe that the company's long-term growth prospects are weaker than previously expected, the P/E they are willing to pay may fall from 30x to 25x. At a future EPS of $4.50, the valuation would then fall further to $112.50.
| Assumed Scenario |
Future EPS |
Forward P/E |
Implied Valuation |
| Pre-earnings expectations |
$5.00 |
30x |
$150.00 |
| Earnings forecast lowered |
$4.50 |
30x |
$135.00 |
| Earnings and valuation both lowered |
$4.50 |
25x |
$112.50 |
The examples above illustrate valuation mechanics only. They do not represent the fair value or future performance of any specific stock. Actual markets also consider interest rates, cash flow, capital structure, and industry competition.
This mechanism explains why some highly valued technology stocks experience large declines after earnings releases. The market may lower future earnings forecasts and reduce the valuation multiple it is willing to pay because growth has become less certain. Conversely, if earnings growth improves significantly, investors may raise both earnings forecasts and valuation multiples, amplifying the stock's upside.
How Does a Pre-Earnings Stock Price Increase Affect Post-Earnings Performance?
A stock's performance before an earnings release can help investors understand how much optimism the market has already priced in. If a company's stock continues to rise before earnings, particularly without new material fundamental information, part of the increase may reflect investors' optimism about the upcoming results. In that case, even if actual EPS and revenue exceed the analyst consensus, the market may still view the results as insufficient to support the previous gain.
For example, suppose a stock rises from $100 to $120 before earnings, a 20% increase. If the increase was driven primarily by expectations that the company would substantially raise its future guidance, a small EPS beat after the earnings release may not satisfy those expectations. Some investors who bought in advance may choose to take profits, increasing short-term selling pressure.
The common market phrase "Buy the Rumor, Sell the News" describes a similar phenomenon, but it is not a fixed pattern that occurs after every earnings report. A pre-earnings rise may reflect improving fundamentals, capital inflows, sector rotation, or options trading. Investors should assess the pre-earnings gain together with valuation changes, revisions to analyst forecasts, and the performance of comparable companies.
Post-earnings price volatility may also be affected by the options market. Before earnings, investors typically pay higher options premiums for the possibility of a large price move. After earnings, uncertainty declines and implied volatility may fall quickly. However, changes in options volatility alone cannot directly explain whether a stock will rise or fall. The actual direction still depends on the combined effects of earnings information, market positioning, and trading flows.
How Can Investors Use Five Metrics to Determine Whether U.S. Stock Earnings Truly Beat Expectations?
Determining whether an earnings report is meaningfully positive requires a more complete analytical framework than simply comparing EPS. For most publicly traded U.S. companies, investors can assess results from five perspectives: actual earnings, revenue growth, forward guidance, cash flow, and valuation.
First, compare EPS with the market consensus estimate. Confirm whether actual EPS exceeded the forecast, while distinguishing between GAAP EPS and adjusted EPS to avoid comparing different accounting bases. If the EPS beat was primarily driven by a one-time gain, a lower tax rate, or share repurchases, investors should further determine whether those factors are sustainable.
Second, examine revenue growth and business mix. Revenue growth can reflect product demand and business expansion, but the quality of growth may vary across business segments. For technology companies, investors should look more closely at core revenue sources such as cloud computing, advertising, data centers, or subscriptions, as well as whether growth depends on price adjustments or one-time factors.
Third, evaluate guidance for the next quarter and full year. Forecasts for future revenue, profit margins, and capital expenditures that exceed market expectations often determine whether investors need to adjust their earnings models. Pay particular attention to whether management raises or lowers its previous operating targets.
Fourth, analyze free cash flow and capital expenditures. Profit growth does not necessarily mean that cash flow is improving at the same time. For companies expanding their AI infrastructure investments, the relationship between operating cash flow, capital expenditures, and free cash flow can help investors assess whether growth requires continued reliance on external financing.
Fifth, consider valuation and the stock's pre-earnings performance. Even if a company's operations are performing well, the market may hold the earnings report to a higher standard if the stock has already risen significantly and its valuation is well above historical levels. Investors need to determine whether the newly released information is sufficient to support the future growth expectations reflected in the current stock price.
| Analysis Dimension |
Core Question |
Possible Risk Signal |
| EPS |
Did earnings beat expectations, and can growth continue? |
EPS growth depends on one-time items |
| Revenue |
Is demand for the core business improving? |
Slowing revenue growth or core business below expectations |
| Guidance |
Is future growth in line with market expectations? |
Revenue, profit, or growth targets lowered |
| Free Cash Flow |
Can profit be converted into cash? |
Capital expenditure growth is faster than cash-generating capacity |
| Valuation |
Has the current stock price already reflected optimistic expectations? |
High valuation combined with slowing growth |
These five metrics must be analyzed together. Investors should not mechanically conclude that an improvement in any single metric means that the stock price will necessarily rise. For example, higher capital expenditures may compress free cash flow in the short term while supporting future revenue growth. A decline in profit margin may result from deteriorating operating efficiency, or it may reflect a company's deliberate increase in research and development investment. Understanding the reasons behind metric changes is more important than simply comparing the figures.
What Follow-Up Signals Should Investors Watch After an Earnings Release?
The stock price reaction following an earnings release is usually only the beginning of the market's repricing process. For investors seeking to understand a company's long-term value, the earnings call, analyst forecast revisions, and subsequent operating data often provide more complete information than short-term price movements.
First, pay attention to management's explanations during the earnings call, particularly regarding future demand, product pricing, customer spending, capital expenditures, and changes in profit margins. If management clearly explains the relationship between investment growth and future revenue, the market may gradually become more comfortable with the investment. If the company cannot clearly explain the timing of revenue realization, funding requirements, or the profitability of its business model, investors may continue to demand greater compensation for risk.
Second, observe the direction of analyst revisions to future EPS, revenue, and price targets after the earnings release. If most analysts raise their future earnings forecasts but the stock price still declines, valuation or market sentiment may be playing a significant role. If both earnings forecasts and valuation multiples are lowered, it may indicate a deeper change in the market's view of the company's future growth.
Finally, distinguish short-term trading volatility from long-term fundamental changes. After-hours trading generally has lower liquidity, and the stock price may react sharply to an individual financial metric. However, as the earnings call, institutional research, and price discovery during regular trading hours unfold, market views may still change. Earnings analysis is therefore better suited to ongoing monitoring of operating data and expectation revisions than to judging a company's value based only on its price movement during the first few minutes after the release.
After understanding the relationship between earnings data and market expectations, investors also need to incorporate fundamental analysis into their actual trading decisions. For users following U.S. technology companies such as NVIDIA (NVDA), Tesla (TSLA), and Meta (META), earnings season is not only an important window for assessing corporate profitability but also a key period for reassessing portfolio risk, valuation, and trading timing. In Gate's stock trading products, users can monitor supported U.S. stock symbols and their market movements, while analyzing company earnings, guidance, and market sentiment.
In actual trading, an earnings beat does not mean that investors should buy immediately, and a stock price decline does not necessarily mean that the valuation is reasonable. Investors can first compare actual EPS and revenue with the market consensus estimate, then review management's views on future growth and capital expenditures. They can also assess whether the relevant information has already been fully reflected in the market by examining price movements before and after the earnings release. For highly volatile technology stocks, investors should pay particular attention to trading costs, liquidity, and position management, and avoid making decisions based solely on a single financial metric.
Please note that Gate's different stock trading products may vary in their trading mechanisms, supported symbols, trading hours, and risk characteristics. Refer to the applicable product page and rules for details. Investors should distinguish between actual stock ownership and other products that provide exposure to stock prices, confirm whether shareholder rights are available, and trade only after understanding the relevant risks.
Conclusion
The fundamental reason a stock price may fall after U.S. stock earnings beat expectations is that the stock market trades on future expectations rather than simply grading operating results from the past quarter. When EPS and revenue exceed analysts' consensus estimates, it only means that actual results were above a publicly available forecast benchmark. It does not mean that the results met all of the expectations investors had already priced into the stock.
EPS, revenue growth, profit margin, free cash flow, and guidance collectively determine the actual quality of an earnings report. For technology companies such as Meta and Tesla, AI capital expenditures, the pace of commercialization for future businesses, and long-term cash-generating capacity may influence valuation more than the size of a single-quarter EPS beat. When a stock is already valued at a high level, lower earnings forecasts and valuation multiple contraction may occur at the same time, amplifying post-earnings price movements.
Therefore, understanding U.S. stock earnings requires a complete analytical framework: first assess the difference between actual results and the consensus estimate, then analyze whether forward guidance has changed, and finally consider valuation, pre-earnings stock performance, and the broader market environment to determine why investors repriced the stock. Compared with simply classifying an earnings report as positive or negative, this approach provides a better understanding of the pricing mechanisms of the U.S. stock market.
FAQ
Why Can a Stock Price Fall Even When U.S. Stock Earnings Beat Expectations?
Because stock prices usually already reflect the market's expectations for future performance. Even if actual EPS exceeds the analyst consensus, the stock price may still fall if future guidance is below expectations, free cash flow deteriorates, or the market had already priced in a higher level of growth.
What Does EPS Beat Mean?
EPS Beat means that a company's reported EPS exceeded the analyst consensus estimate. It indicates that current-period earnings were above the forecast benchmark, but it does not by itself prove that the company's future growth outlook has improved.
Which Is More Important: an EPS Beat or a Revenue Beat?
Both are important, but their relative importance depends on the company's industry and stage of development. Mature companies may place greater emphasis on profitability and cash flow, while high-growth technology companies generally focus more on revenue growth, business expansion, and future profit potential.
Why Does Guidance Affect U.S. Stock Prices?
Guidance is management's forecast for future revenue, profit, or capital expenditures. If management lowers its forward guidance, investors may reduce their earnings expectations and valuation, which can affect the stock price.
Does a Stock Decline After an Earnings Release Mean That the Company's Operations Are Deteriorating?
Not necessarily. A stock price may decline because of excessive valuation, overly optimistic market expectations, profit-taking, or changes in the macroeconomic environment. Investors need to assess actual financial data and forward guidance together to determine whether the company's operations are truly worsening.
Why Do AI Capital Expenditures Affect Technology Stock Valuations?
Building AI infrastructure requires substantial investment in servers, chips, and data centers. These investments may increase cash outflows and pressure free cash flow in the short term. If the investments generate sufficient revenue and profit in the future, they may support long-term valuation; otherwise, they may increase funding pressure.
What Is Forward P/E?
Forward P/E is the ratio of a stock's price to its expected future EPS. It is commonly used to assess how many times the market is willing to value a company's future earnings. Changes in future EPS forecasts or in the valuation multiple investors are willing to pay can both affect the stock price.
How Can Investors Determine Whether a U.S. Stock Earnings Report Deserves Attention?
Investors can focus on EPS, revenue growth, profit margin, free cash flow, and forward guidance, while also considering the stock's pre-earnings performance, current valuation, and industry environment. For different types of companies, investors should also examine core business metrics and long-term growth drivers.