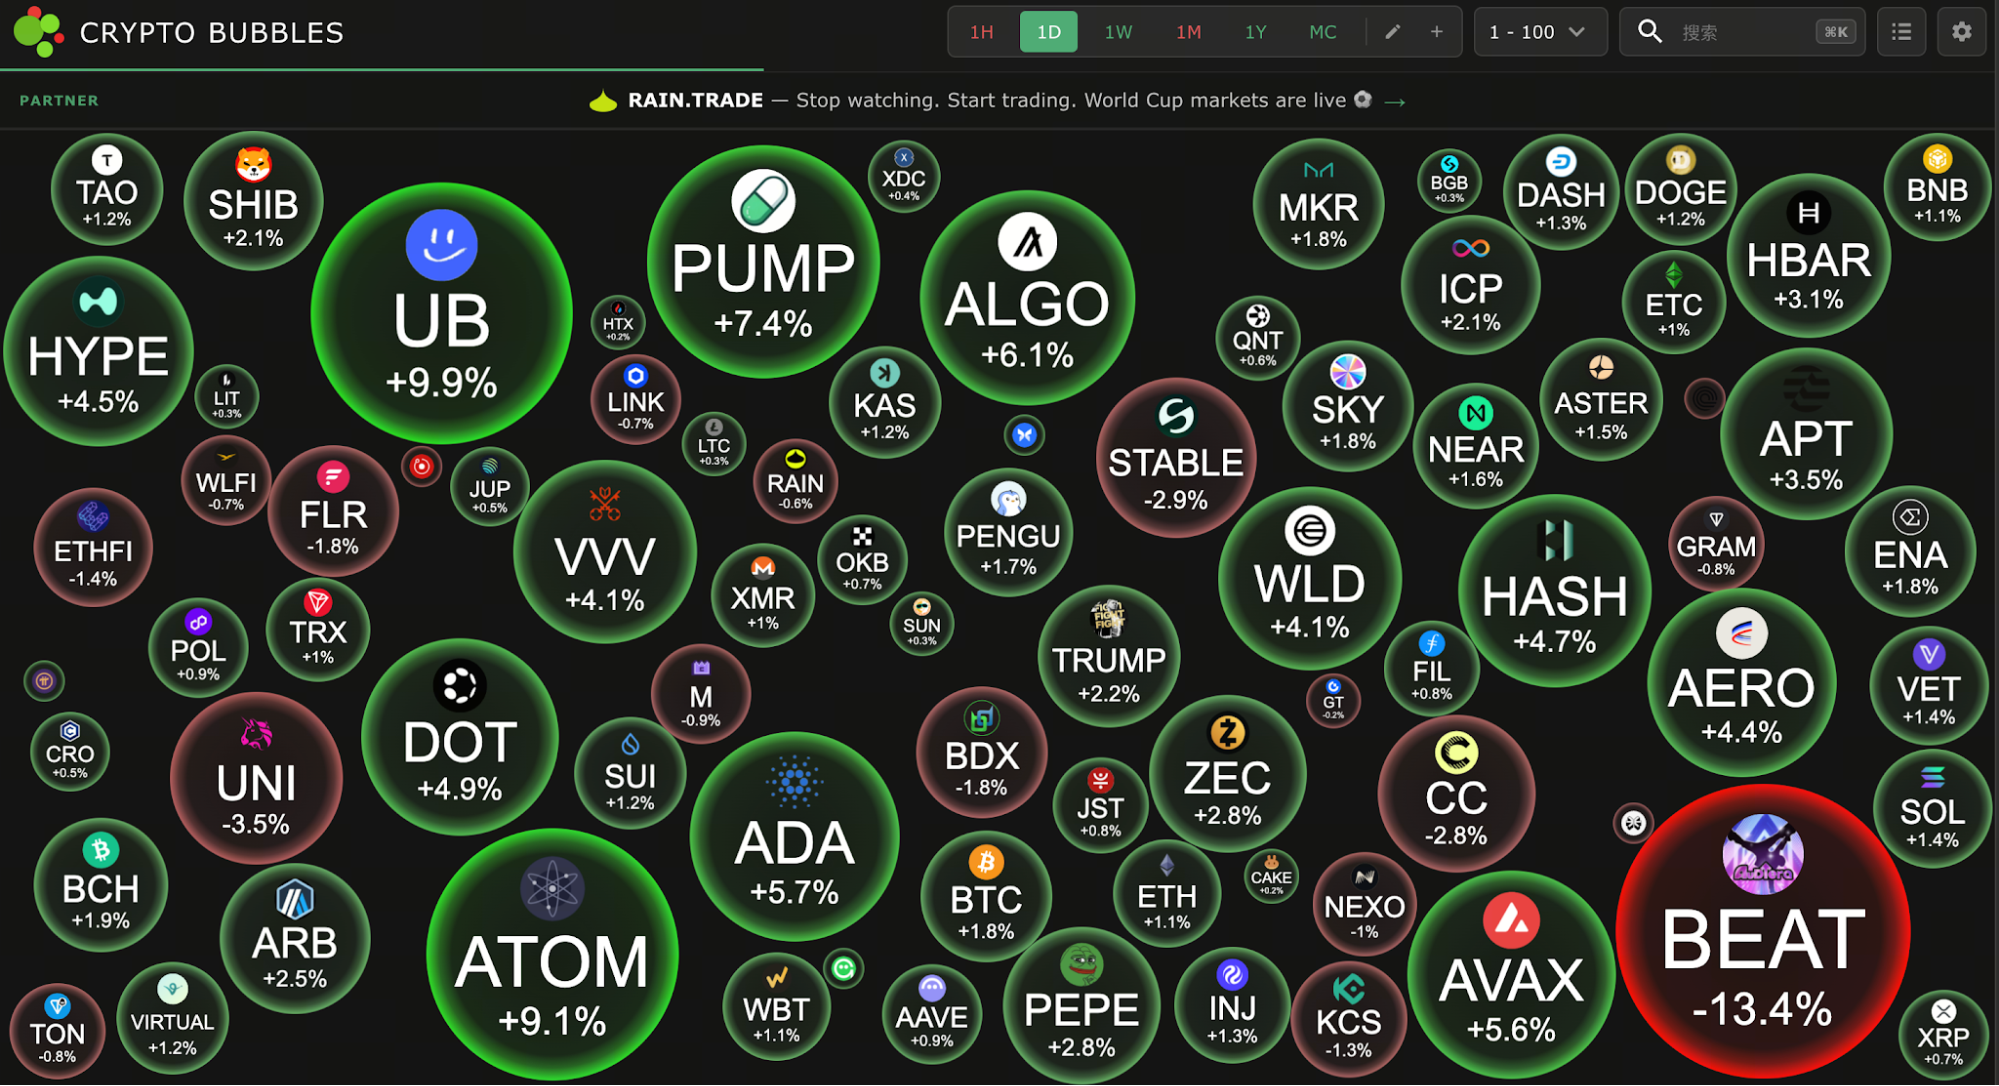
The crypto market contains thousands of assets, and reviewing prices, trading volume, and market capitalization one by one can take a considerable amount of time. Traditional market tables provide detailed data, but rows of numbers may not be the fastest way to understand whether the broader market is rising, falling, or showing unusual activity.
Crypto Bubbles displays crypto assets as interactive colored bubbles. Each bubble represents one token. Color usually indicates price direction, while bubble size and on-screen data can be adjusted to reflect metrics such as percentage change, market capitalization, or trading volume.
This makes Crypto Bubbles useful as a market-scanning tool. Users can quickly observe the overall distribution of market performance, identify assets with unusual movements, and then conduct further research through trading platforms, project announcements, or blockchain data.
Crypto Bubbles is not a price prediction or valuation system. A large, brightly colored bubble only indicates that an asset stands out under the selected settings. It does not prove that the asset is undervalued, likely to continue rising, or suitable for trading.
What Is Crypto Bubbles and Speculative Bubbles?
Crypto Bubbles is a crypto market visualization platform that presents market data through an interactive bubble map. In market terms, a crypto bubble happens when prices rise far above real value, often as FOMO and media hype push speculation faster than fundamentals. As a tool, Crypto Bubbles is available through a website and mobile applications and covers a broad range of cryptocurrencies.
Unlike a conventional market table, Crypto Bubbles places multiple assets on the same visual screen. Users can quickly compare the number of rising and falling assets and identify tokens that are moving differently from the rest of the market.
The platform allows users to customize the information displayed by each bubble. Depending on the selected settings, bubbles may show price, percentage change, market capitalization, trading volume, market dominance, or other available metrics.
Crypto Bubbles also offers sortable market views, individual token pages, price charts, favorites, and custom bubble configurations. Clicking a bubble opens more detailed market information and may provide links to external data or trading services. It visually maps the cryptocurrency market, but it does not determine whether a bubble is forming.
Crypto Bubbles is not a wallet and does not hold user assets. Viewing the public bubble map does not normally require a wallet connection. Users should never enter a seed phrase or private key on a market visualization platform.
What Do Bubble Colors and Sizes Mean?
Crypto Bubbles converts market data into three main visual elements: color, size, and text. Their meaning depends on the current configuration, so users should always confirm the selected settings before interpreting the chart.
Under common settings, green indicates that an asset has increased in price during the selected period, while red indicates a decline. A stronger color usually reflects a larger percentage move. Bubbles closer to a neutral color generally represent smaller changes.
Bubble size can be linked to percentage change, market capitalization, trading volume, or another supported metric. When size is set to market capitalization, large assets such as Bitcoin and Ether will usually occupy more space. When size is based on percentage change, a volatile small-cap token may become one of the largest bubbles on the screen.
Visual Element
Common Meaning
What to Keep in Mind
Green bubble
Price increased during the selected period
Does not mean the price will continue rising
Red bubble
Price declined during the selected period
Does not mean the asset is undervalued
Bubble size
Depends on the selected metric
May represent market cap, volume, or price change
Bubble text
Token symbol and selected data
Displayed information can be customized
Bubble position
Dynamic visual arrangement
Usually does not indicate correlation or sector relationships
The position of bubbles is mainly used to create a dynamic visual layout and avoid excessive overlap. Two bubbles appearing next to each other does not necessarily mean that the corresponding assets are connected by fundamentals, capital flows, or price correlation.
How to Change the Timeframe in Crypto Bubbles
The selected timeframe determines which price movement is reflected in the bubble colors and percentage figures. Crypto Bubbles supports multiple time ranges, allowing users to compare short-term moves with broader market trends.
Shorter periods are useful for identifying recent volatility. One-hour or four-hour views can highlight assets that have just started moving, but they are also more sensitive to low liquidity, breaking news, and large individual orders.
A 24-hour or seven-day view provides more context for relative market performance. A token that rises sharply over one hour may still be down over the week, while a short-term rebound may occur within a longer decline.
Longer periods can help users understand whether current activity is isolated or part of a broader trend. Comparing one-day, one-week, and one-month performance provides a more complete picture than relying on a single timeframe.
A practical approach is to start with the overall market view, identify unusual bubbles, and then switch between several time ranges to see whether the same asset remains strong or weak. If it stays unusually strong across multiple windows, check for warning signs such as a rapid price surge and heavy media hype without matching underlying value improvement.
How to Customize Bubble Size and Displayed Data
Crypto Bubbles allows users to adjust the bubble map according to their research goal. Bubble size, color, and internal text can be assigned to different market metrics.
Users who want to study overall market structure can set bubble size to market capitalization. This makes larger assets visually dominant while color shows how they performed during the chosen period.
Users looking for active or volatile assets may prefer to sort or size bubbles by trading volume or percentage change. Under these settings, smaller tokens can appear very large because of short-term volatility, even when their market depth remains limited.
Research Goal
Bubble Size
Suggested Color or Text
Review overall market structure
Market capitalization
24-hour percentage change
Identify short-term movers
Percentage change
One-hour or 24-hour performance
Compare trading activity
24-hour trading volume
Price change
Monitor selected assets
Custom watchlist
Preferred timeframe performance
Users can also save or edit custom market views. Maintaining a consistent configuration can make daily comparisons easier and reduce confusion caused by changing several metrics at once.
How to Search for a Token and View Detailed Data
Crypto Bubbles includes a search function that allows users to locate an asset by name or ticker. Since different crypto projects may use similar names or symbols, users should verify the full project name, market ranking, and other identifying details after searching.
Clicking a bubble opens a token detail view. Depending on the current platform version, this page may display price, performance across several timeframes, market capitalization, trading volume, and a price chart.
Sortable market views can also help users organize assets according to price, market cap, volume, or percentage performance.
The detail page is useful for initial screening, but many cryptocurrencies do not produce earnings or cash flows that can be used for valuation, so careful analysis of utility and project execution still matters. Before considering a trade, users should also examine:
The project’s purpose and development progress;
Token supply and future unlocks;
Market depth and major trading venues;
Holder concentration;
Recent announcements and risk events;
Contract address and blockchain network.
The ico bubble raised billions from projects that often had little more than whitepapers and no real product, so screening beyond the bubble map matters.
Crypto Bubbles can help answer which assets are moving unusually. It cannot fully explain why the movement is happening or whether participating is appropriate.
How to Create a Watchlist and Custom Market View
Crypto Bubbles allows users to add assets to favorites and create custom watchlists. This helps users focus on selected holdings, long-term research targets, or a specific crypto sector instead of scanning the entire market, while also supporting diversification across sectors so you are not putting all your money into one theme and helping reduce risk in your investments during bubbles.
Separate lists can be created for categories such as AI tokens, Layer 2 projects, Meme Coins, DeFi protocols, or other themes. Applying the same timeframe and bubble-size settings across a group makes relative performance easier to compare.
A watchlist should not be confused with a connected investment portfolio. Adding a token to a custom view does not necessarily mean Crypto Bubbles has access to the user’s real holdings or account profit and loss.
Custom lists can also reduce visual noise. A full-market map may contain hundreds of bubbles, and highly volatile assets can dominate attention. A smaller, research-focused list provides a clearer view of the assets that matter to the user’s analysis.
How to Use Crypto Bubbles to Read Market Performance and Market Sentiment
Crypto Bubbles works best as an initial market scanner. Users can begin by reviewing the overall color distribution and then look for assets behaving differently from the broader market.
When most bubbles are red but a few tokens remain strongly green, users can investigate whether those assets are reacting to project announcements, new listings, token burns, ecosystem partnerships, or short-term capital flows. At times, hype on social media and in online communities can attract new investors and more people, with FOMO and emotional buying by novices pushing prices higher as market sentiment turns more reactive.
A move against the broader market is not automatically a trading signal. When confidence suddenly breaks, panic selling can accelerate the drop and highlight the difference between a bubble and a normal correction. It is a prompt for further research.
When most bubbles rise or fall together, the market may be reacting to broader factors such as Bitcoin price action, macroeconomic events, or changes in risk appetite. Bitcoin can also influence other cryptocurrencies and, at times, the entire cryptocurrency market. In this environment, the movement of one token may not be caused entirely by project-specific developments.
Bubble size can provide another layer of context. A major move in a large-cap asset with deep liquidity carries a different market meaning from a sharp move in a low-liquidity small-cap token.
A practical workflow can be organized into four steps:
Select a timeframe and review the broader market direction.
Adjust bubble size to compare market capitalization or trading volume.
Open unusual assets and review performance across several periods.
Verify the possible cause through project announcements, on-chain data, live trading markets, and signs of mainstream-media coverage feeding a reflexive loop, then check social-media-driven sentiment before decision making.
How to Use Crypto Bubbles With Gate
After finding an asset of interest on Crypto Bubbles, users can search for its name or ticker on Gate to check whether a corresponding spot, futures, or other market is available.
Crypto Bubbles may provide external market links, but these links should be treated as navigation tools rather than recommendations. The presence of an asset on an external platform does not mean Crypto Bubbles has evaluated or endorsed it.
Because several tokens may use similar names or symbols, users should verify the full project name and trading pair before entering an order.
The Gate trading page can provide additional information such as order book depth, 24-hour trading volume, bid-ask spread, recent price action, and supported trading products, which can help traders protect decisions during volatile moves.
A market order prioritizes execution speed but may experience slippage when liquidity is limited. A limit order gives users more control over the execution price but may not fill immediately or completely.
The price shown by Crypto Bubbles may differ from the live price on Gate. Aggregated market feeds, update intervals, trading pairs, and local order book conditions can all create differences. These market analysis tools are most useful for visualization and confirmation, not automatic trade execution. Actual order decisions should be based on the live Gate market page.
What Are the Advantages and Limitations of Crypto Bubbles and Bubble Bursts?
The main advantage of Crypto Bubbles is visual efficiency. Users can compare a large number of assets on one screen and quickly identify broad market direction or unusual performance. That matters in a fast-moving crypto world where markets are highly volatile and extremely accessible, since anyone with an internet connection can trade at any time and speculative bubbles can form easily.
The platform is also useful for spotting outliers. Large or strongly colored bubbles attract attention more quickly than rows in a standard market table.
That same visual design can introduce bias. Bright colors and large bubbles may encourage users to focus on recent winners or losers without understanding the cause of the movement. In cryptocurrency markets, narratives often build around excitement, quick gains, herd behavior, overconfidence, media hype, easy access to trading, and stories of explosive growth rather than careful valuation.
Crypto Bubbles does not provide a complete view of project fundamentals, token unlocks, governance, on-chain activity, or valuation. The word “Bubbles” refers to the visual format and should not be interpreted as an automated financial-bubble detection system. It does not diagnose episodes like the 2017 ICO boom or the 2021 NFT market peak, and it cannot predict when a crypto bubble bursts.
Data freshness and source differences may also affect what users see. Important figures should be cross-checked through live trading markets, official project announcements, blockchain explorers, and other reliable sources.
What Risks and Warning Signs Should Users Consider?
Bubble colors and sizes should not be converted directly into buy or sell decisions. A green bubble only means the asset rose during the selected timeframe. A crypto bubble can move through a lifecycle that includes displacement, boom, and panic before it can burst into a sharp correction. A red bubble only means it declined.
Short-term percentage moves can be misleading. Low-liquidity assets may show large changes after a small number of trades, making them appear unusually important on the map even though entering or exiting a position may be difficult. High leverage can magnify both the rise and the fall when bubble peaks reverse, leading to rapid price corrections.
Similar token names and tickers create another risk. Users should verify the full project identity, blockchain network, and contract address instead of relying on a ticker alone.
External links do not guarantee safety. When moving from Crypto Bubbles to another website, users should verify the domain, account permissions, and transaction details. Seed phrases and private keys should never be shared.
Crypto Bubbles is most useful as a supporting research tool. Position size, liquidity, exit planning, stop-loss orders, and acceptable loss still need to be assessed independently; gradually taking profits can help reduce risk, and advanced users may hedge with options to protect funds.
Summary
Crypto Bubbles is a market visualization platform that uses colored bubbles to present crypto price performance and other market metrics.
Users can customize bubble size, color, text, and timeframes to compare assets by percentage change, market capitalization, trading volume, or other available data. The platform also provides search, watchlists, sortable market views, individual token details, and links to external market services.
Crypto Bubbles can help users identify unusual activity and understand the broader market at a glance. It does not determine whether a token is overvalued, predict future prices, or replace project and risk research.
A more complete analysis should combine the bubble map with project fundamentals, token supply information, liquidity, on-chain data, live order books, and personal risk tolerance.
FAQ
Do I Need an Account to Use Crypto Bubbles?
Public market bubbles can usually be viewed without connecting a crypto wallet. Whether custom settings and favorites can be synchronized across devices depends on the current website or app version.
Why Does Crypto Bubbles Show a Different Price From Gate?
The two platforms may use different data sources, update intervals, and trading markets. Crypto Bubbles generally displays aggregated market data, while Gate shows live pricing for a specific trading pair.
Does a Larger Bubble Mean Large Investors Are Buying?
Not necessarily. Bubble size depends on the selected setting and may represent market capitalization, trading volume, or percentage change. It does not directly reveal who is buying or selling.
Can Crypto Bubbles Track My Real Portfolio?
Users can create watchlists, but a watchlist is not necessarily connected to a real exchange account or wallet. Market performance shown in a custom view should not be treated as actual account profit or loss.
Why Is a Token Missing From Crypto Bubbles?
The asset may fall outside the platform’s current coverage, ranking range, or data-source requirements. Users can search by full name and ticker and verify the asset through other market-data sources.
Is Crypto Bubbles Suitable for Beginners?
It can help beginners understand relative market performance, but the visual format is easy to misread. For example, bitcoin's price rose from about $1,000 to nearly $20,000 in 2017, then fell toward $3,000 in 2018 after the bubble bursts. An earlier example came in 2013, when bitcoin's price peaked at $1,127.45 before crashing. Users should confirm the selected timeframe and bubble metric before drawing conclusions.
Author: Allen
Disclaimer
* The information is not intended to be and does not constitute financial advice or any other recommendation of any sort offered or endorsed by Gate.
* This article may not be reproduced, transmitted or copied without referencing Gate. Contravention is an infringement of Copyright Act and may be subject to legal action.
DEX aggregators integrate order data, price information, and liquidity pools from multiple decentralized exchanges, helping users find the optimal trading path in the shortest time. This article delves into 8 commonly used DEX aggregators, highlighting their unique features and routing algorithms.
The report shows that in Q1 2026, the crypto market will reach a stage of structural maturity, with Derivative trading making up more than 90% of total trading volume, exceeding $20 trillion. As Spot demand weakens, liquidity will become even more concentrated in top exchanges, reflecting a more cautious market sentiment and a shift toward leveraged and institutional trading.