Readers comparing income funds have to keep two results apart: cash distributed, and the change in net asset value. In the same period, the two results can move in opposite directions. A higher yield does not offset a price decline. Yield is only the ratio of distributions to price, so the ratio can look strong while the price result is negative. The differences among screens are what high-dividend ETF rules separate. That page sorts rules. It does not rank the funds.
Key Takeaways
- A high-dividend ETF selects stocks with a published dividend rule; trailing yield, dividend growth, and covered-call premium are three different rules.
- A high trailing-yield screen often raises the weight of financials, energy, and consumer staples, so those sector shocks hit NAV first.
- Distribution frequency, the fee, and tax character each answer a different question.
- A higher yield does not offset a fall in NAV, and CFD price exposure is not the cash distribution a shareholder receives.
What rules does a high-dividend ETF use to pick stocks and calculate dividend yield?
A high-dividend ETF adds and removes stocks under a published dividend rule, typically designed to produce regular cash flow, then adjusts the portfolio to that rule rather than gathering whatever names show the highest yield on a single day. In practice, that means a high dividend ETF is an exchange-traded fund that follows a stated income-selection method—such as high trailing yield, dividend growth, or covered-call premium—and distributes income based on that method. The rule sits in the index methodology or the fund documents, and reconstitution follows that text.
The Vanguard High Dividend Yield ETF (VYM) tracks the FTSE High Dividend Yield Index and holds the index constituents through passive full replication. The index includes common stocks with above-average dividends over the previous 12 months and leaves out real estate investment trusts.
The Schwab US Dividend Equity ETF (SCHD) tracks the Dow Jones U.S. Dividend 100 Index. That index looks at the quality and sustainability of dividends and selects companies on fundamental strength versus peers, using financial ratios. The SCHD rule is not a sort by trailing yield alone.
How do yield, dividend growth, and covered-call income differ?
The three rules diverge in two places at once: which stocks the screen keeps, and what the distribution is made of. A high trailing yield, dividend growth, and covered-call premium cannot be treated as one yield figure.
| Rule family |
What the index screens |
What the distribution is made of |
Example tickers |
| High trailing yield |
Above-average trailing dividends, or a yield-weighted selection |
Dividends from the constituent stocks |
VYM, HDV, SPYD |
| Dividend growth |
Consecutive dividend increases, or a long growth record |
Dividends from the constituent stocks |
VIG, DGRO, NOBL |
| Covered-call income |
An equity portfolio plus written call options |
Dividends plus option premium |
JEPI, JEPQ |
The first row keeps stocks whose dividends have already run high, and the distribution is mainly those stock dividends. VYM, HDV, and SPYD are examples. The second row requires a growth record or a streak of increases. VIG, DGRO, and NOBL usually show a lower headline yield, and the distribution is still a stock dividend. The third row adds written calls on top of an equity portfolio. The distribution mixes dividends with option premium, and the written calls give away part of the upside. The JPMorgan Equity Premium Income ETF (JEPI) seeks monthly distributable income and implements that layer with out-of-the-money S&P 500 call options. JEPQ sits in the same covered-call income family.
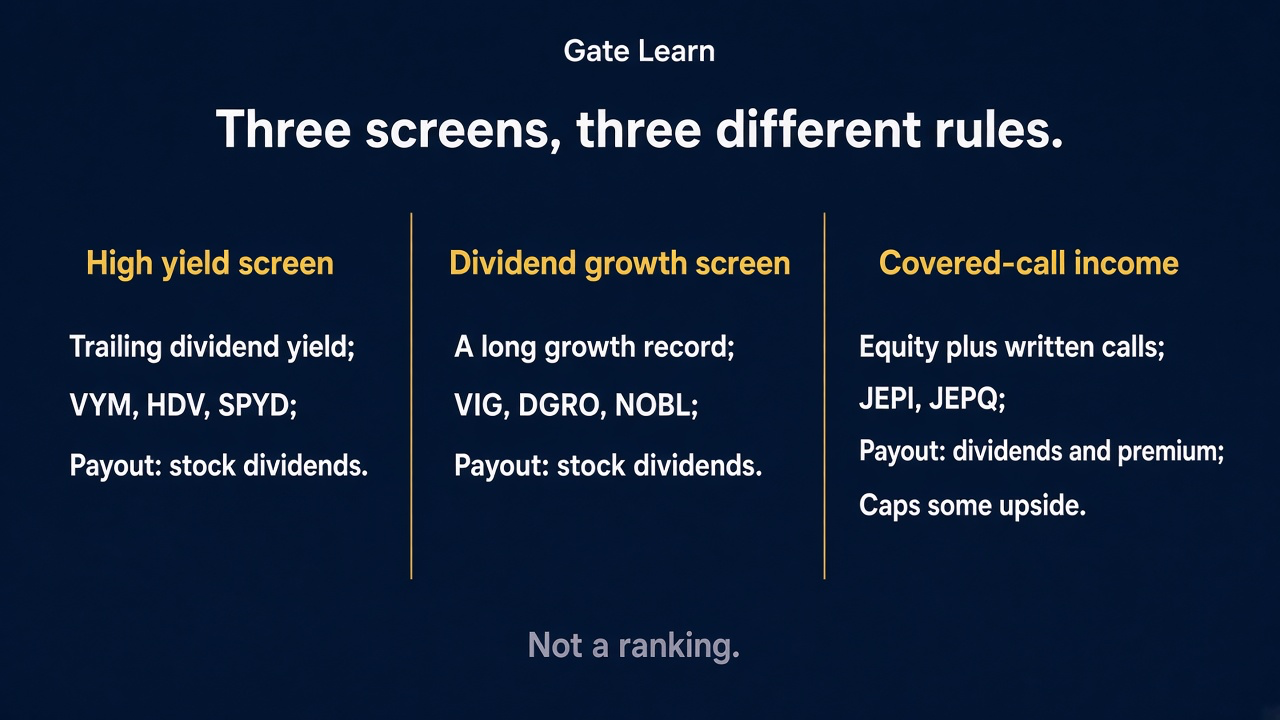
Figure 1. Yield, dividend growth, and covered-call income follow three different screens.
How does sector tilt change the risk?
Sector tilt changes which shocks reach net asset value first. A high trailing-yield screen concentrates weight in sectors that pay more, and each reconstitution pulls weight back toward those sectors.
High trailing-yield screens such as VYM, HDV, and SPYD often raise the weight of financials, energy, and consumer staples. Moves in interest rates, oil prices, and defensive demand show up in the NAV early.
Dividend-growth or consecutive-increase rules, including VIG, DGRO, and NOBL, usually come with a lower yield and a sector mix that differs from a high-yield screen. A covered-call overlay sits on top of the equity book, and the sector risk stays in that book. Because sector mix leans defensive, high-dividend ETFs often show lower price volatility during market downturns, though that is not a guarantee.
Why split distribution frequency, fees, and tax treatment?
Distribution frequency, the fee, and tax character need separate readings. Frequency describes when cash arrives, and dividend payments may be made in cash or additional shares depending on the arrangement. The fee describes the cost taken from fund assets. Tax character describes which income category the distribution falls into where the holder is taxed.
A monthly payout and a quarterly payout change the arrival calendar. JEPI seeks monthly distributable income, while many funds are paid quarterly, so the calendar marks when cash arrives, while the premium remains option income.
The fee is deducted from fund assets and is a different figure from the distribution yield. A distribution may be classed as a qualified dividend, ordinary income, or a return of capital, and option premium inside a covered-call product may be classed on its own. The final label depends on the source of the distribution, the account type, and the tax rules where the holder lives.
Does a higher yield or payout ratio offset a fall in NAV?
No. A higher yield does not offset a fall in net asset value. Yield is a period's distributions divided by price, and the cash distribution and the price change are recorded separately.
When the price falls and the cash dividend changes little, trailing yield rises because the denominator shrank. To calculate dividend yield, divide the annual dividend by the market price: a stock at $100 with a $5 annual dividend has a 5% yield. That figure is an illustration of the ratio, not a live quote. A higher yield can be the trace the decline leaves behind.
Total return adds the price change and the distributions. When one period's cash is smaller than the NAV drawdown, the drawdown remains on the NAV. Premium received in a covered-call strategy is also cash, and the written calls give away part of the upside.
Why are credit-bond funds and a utilities sector fund not high-dividend equity ETFs?
Credit-bond funds and a utilities sector fund sit outside the high-dividend equity ETF category. A high-dividend equity ETF holds stocks chosen by a dividend rule. A credit-bond fund holds bonds. A utilities sector fund holds stocks from an industry list, and membership comes from the sector classification.
High-yield corporate bonds, investment-grade corporate bonds, and utilities-sector equity are not high-dividend equity ETFs: high-yield corporate-bond exposure is iShares high-yield corporate bonds (HYG), investment-grade corporate-bond exposure is iShares investment-grade corporate bonds (LQD), and utilities-sector equity is utilities sector equity (XLU). Bond interest is the coupon on credit. XLU admits holdings by industry classification. A company that pays a large dividend does not rewrite that sector fund into a high-dividend equity ETF.
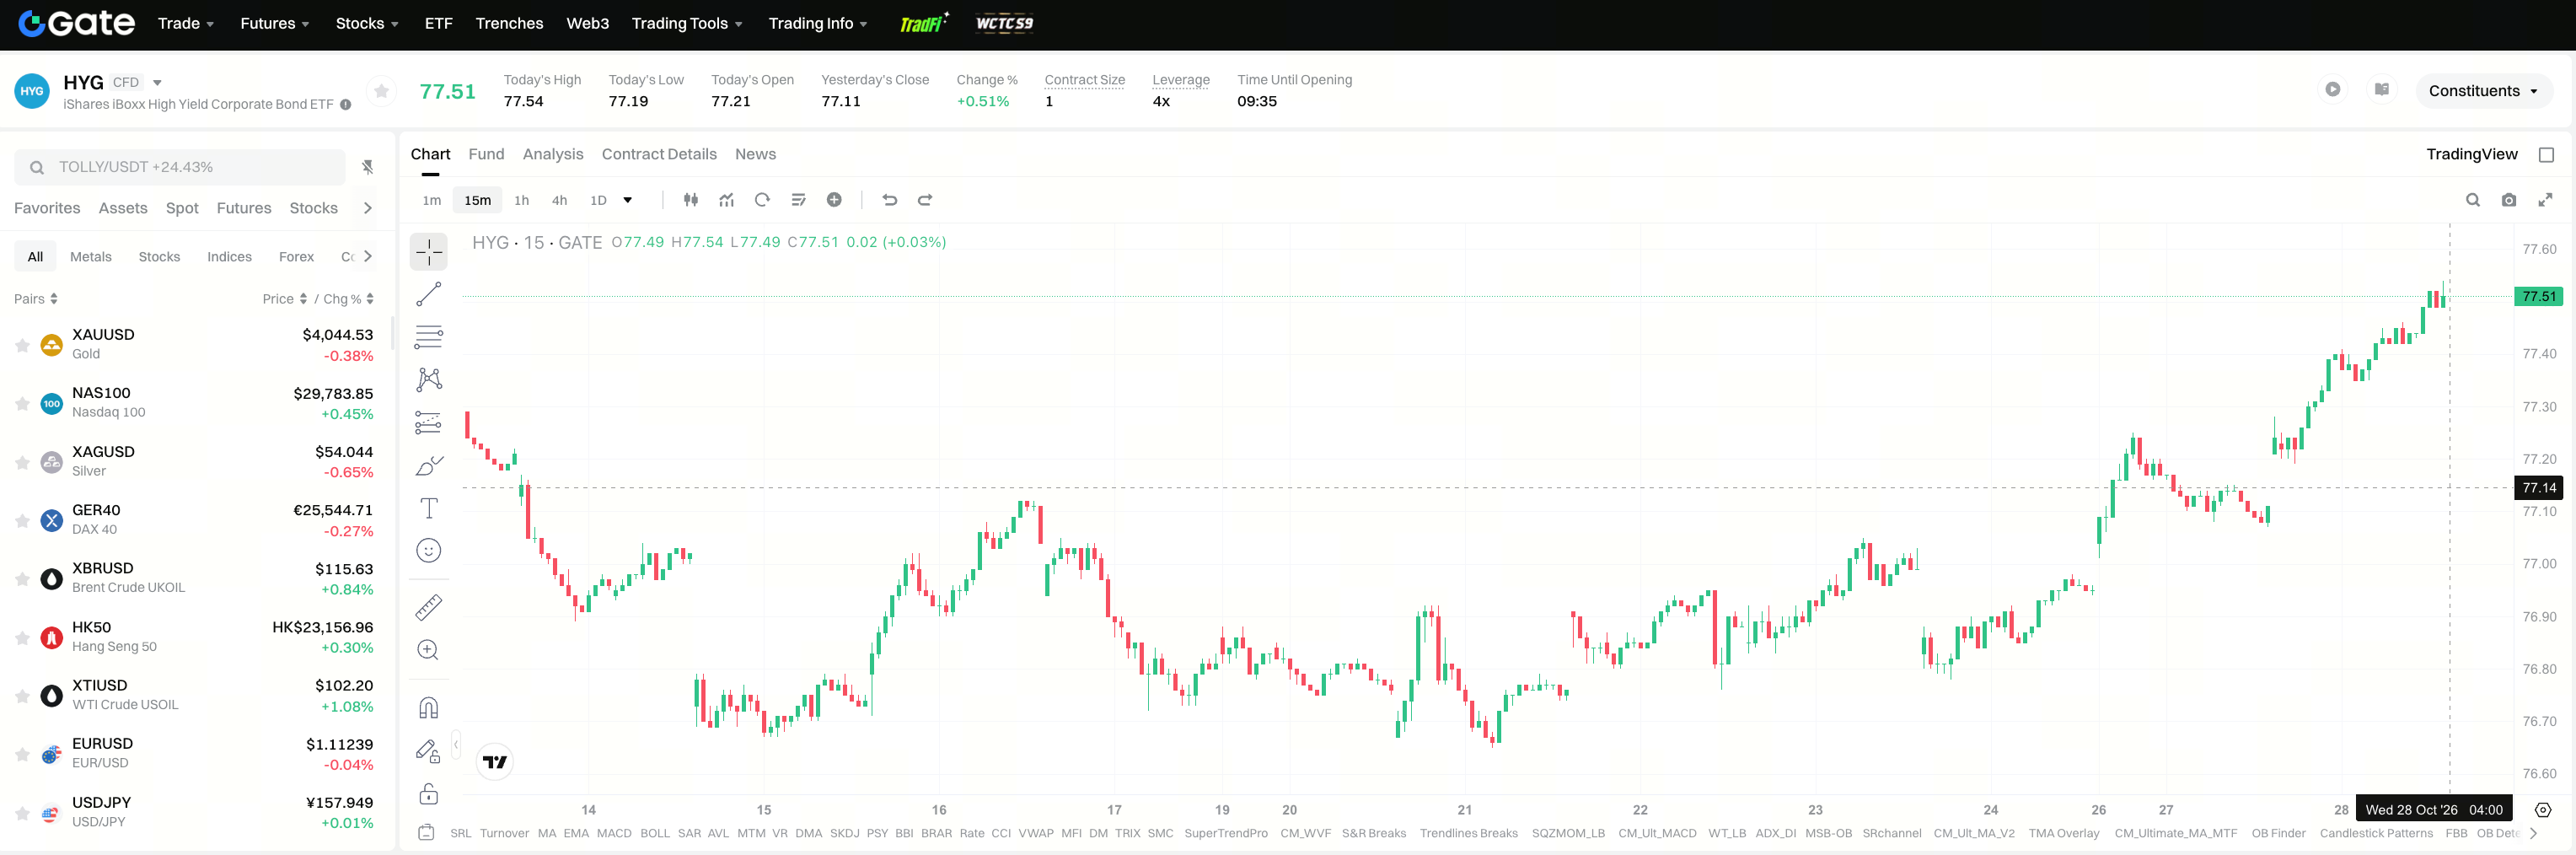
How does a CFD differ from receiving the ETF distribution?
A CFD provides price exposure to the ETF's market price. That exposure and the cash distribution a fund shareholder receives are two separate records. The price change is entered on the contract. The fund distribution is entered in the share account.
A shareholder receives the distribution under the fund's rules and the account that holds the shares. Investors must own shares before the Ex-Dividend Date to receive dividends. They can still sell after the ex-dividend date and remain eligible for that distribution. A CFD position tracks the price, and the position holder does not become a shareholder of VYM, SCHD, or JEPI because of that position. Some contracts add a cash adjustment around a distribution. Whether an adjustment exists, and how it is calculated, is a term in that contract's specification.
Summary
A high-dividend ETF is set apart by its screen: a high trailing yield, dividend growth, and covered-call premium select different stocks, and the distribution is built differently. A higher yield is the ratio of distributions to price, and that ratio does not offset a fall in NAV.
Distribution frequency, the fee, and tax character each keep their own ledger. Credit-bond funds and a utilities sector fund stand outside the equity dividend screen. A CFD exposes the holder to price. The cash a shareholder receives is the fund distribution. Whether the contract adds a separate cash adjustment is stated in the contract specification.
FAQ
Does a high-dividend ETF simply hold the highest-yielding companies?
No. A high-dividend ETF selects stocks with a published rule, and a high trailing yield is only one of those rules. A dividend-growth rule looks at the growth record, and a covered-call product counts premium from written calls in the distribution. SCHD screens for dividend quality, sustainability, and financial ratios, so it is not a same-day list of the highest yields either.
How does a dividend-growth ETF differ from a high-yield ETF?
A high-yield ETF keeps stocks whose trailing dividends already sit above average. The distribution is mainly those stock dividends, and the portfolio often leans toward financials, energy, and consumer staples. A dividend-growth ETF requires the growth record to keep lengthening. The headline yield is usually lower, and the distribution still comes from stock dividends. The two rules answer different screening questions, so one yield figure does not stand in for the other.
Is the distribution from a covered-call product such as JEPI a dividend?
Not entirely. JEPI writes out-of-the-money S&P 500 call options alongside the equity portfolio and seeks monthly distributable income, so the distribution contains both stock dividends and option premium. The premium is the cash attached to upside that the written calls give away. The cash from JEPI and JEPQ is not the same distribution as the cash from a high-yield ETF that passes through stock dividends only.
Does a higher yield keep net asset value from falling?
No. Yield equals distributions divided by price. When the price falls and the cash dividend stays roughly the same, yield rises because the denominator got smaller, so the higher figure can be a result of the decline. When one period's cash is smaller than the NAV drawdown, the drawdown remains. Premium does not fill in the price decline either.
Does a CFD on the ETF price pay the fund distribution into the account?
Not along the shareholder path, and not automatically. A CFD tracks the ETF price. The position holder is not a fund shareholder, so the distribution the fund pays shareholders does not arrive in the CFD account as that same shareholder payment. A given contract may add a separate cash adjustment. Whether it adjusts, and on what basis, has to be read from that contract's specification. The ETF distribution calendar does not supply the answer.